
The Effect of Topology on Phase Behavior under Confinement


Department of Energy Resources Engineering, Stanford University, Stanford, CA 94305, USA
*
Author to whom correspondence should be addressed.
Processes 2021, 9(7), 1220; https://doi.org/10.3390/pr9071220
Submission received: 13 May 2021
/
Revised: 24 June 2021
/
Accepted: 13 July 2021
/
Published: 15 July 2021
(This article belongs to the Special Issue Gas Diffusivity in Reservoir-Fluid Systems)
Abstract
:This work studies how morphology (i.e., the shape of a structure) and topology (i.e., how different structures are connected) influence wall adsorption and capillary condensation under tight confinement. Numerical simulations based on classical density functional theory (cDFT) are run for a wide variety of geometries using both hard-sphere and Lennard-Jones fluids. These cDFT computations are compared to results obtained using the Minkowski functionals. It is found that the Minkowski functionals can provide a good description of the behavior of Lennard-Jones fluids down to small system sizes. In addition, through decomposition of the free energy, the Minkowski functionals provide a good framework to better understand what are the dominant contributions to the phase behavior of a system. Lastly, while studying the phase envelope shift as a function of the Minkowski functionals it is found that topology has a different effect depending on whether the phase transition under consideration is a continuous or a discrete (first-order) transition.
1. Introduction
Under tight confinement, a gas can form a condensed phase at a pressure below the bulk vapor pressure. This phenomenon is known as capillary condensation and has applications in many fields of science and engineering, including the storage of hydrogen carriers [1,2,3], battery technology [4], hydrocarbon extraction from unconventional reservoirs [5], and carbon dioxide sequestration [6]. Capillary condensation can have a large effect on transport properties, including effective diffusion coefficients [7], imbibition [8], and mass flow rates [9], and it is reported in the literature that both morphology (i.e., the shape of a structure) and topology (i.e., how different structures are connected) have a strong effect on the sorption of both sub- and supercritical fluids [2,10,11]. For ordered porous media, the relation between capillary condensation and geometry is well understood [12]; however, in practice, many porous media are disordered rather than ordered. To get a better understanding of capillary condensation in disordered porous media, simple geometries like cylinders, slit pores, ink bottles, and spheres [13,14] have been studied extensively. Unfortunately, topology is generally not considered in these model systems and, because there is no well-defined geometrical parameter space, the results of these studies are difficult to compare with each other. As a consequence, it is still not well understood how phase transitions in porous media are affected by topology [14,15,16,17,18,19].
In this work, we study the effect of topology on capillary condensation and wall adsorption under confinement (i.e., small pores) through the lens of the Minkowski functionals. The aim is to develop a description of phase behavior under confinement that is universally valid, independent of the details of the pore structure under consideration. The Minkowski functionals are a concept from integral geometry which not only characterize the morphology, but also the topology of spatial patterns [20]. They have been applied in a wide array of research areas including astronomy [21,22], statistical physics [23], phase behavior [24], granular materials [25,26], and porous media [27,28]. For a system in D dimensions, there are Minkowski functionals and in the case of a two-dimensional system, these functionals are related to the surface area, circumference, and signed curvature (i.e., the Euler characteristic) of the system [29]. A central component of the Minkowski functionals framework is Hadwiger’s theorem [30]. It states that in many cases, the free energy of a system, or any other functional, can be expressed as a linear combination of Minkowski functionals [30,31], thus decoupling the thermodynamical behavior of a system from its morphology and topology. This has two important consequences: (i) Characterization and classification; when the assumptions of Hadwiger’s theorem are fulfilled, the Minkowski functionals provide a complete spatial description of a physical system. This means that they provide a finite well defined geometrical parameter space that allows for the direct comparison of the results of different studies using different geometries. (ii) Scale translation; as mentioned above, the Minkowski functionals allow for the separation of the thermodynamics of a system from its geometry. This makes it possible to perform a simulation of a small system with known Minkowski functionals, compute the linear coefficients for various thermodynamic properties, and use these to derive the properties of a much larger system with known Minkowski functionals. In addition, this also implies that simple geometries can be used to represent complex geometries.
To study fluids under confinement, the Minkowski functionals have been used in combination with both hard-sphere fluids [31] and more complex force fields in conjunction with molecular dynamics [32]. Building on the work of König et al. [31], this study looks at the efficacy of using the Minkowski functionals to describe the behavior of Lennard-Jones fluids under confinement. A Lennard-Jones potential is more realistic than a hard-sphere potential for many applications. However, the interaction length of a Lennard-Jones fluid is much longer than the interaction length of a hard-sphere fluid and can become of the same order as the pore size. This can result in the breakdown of Hadwiger’s theorem. Minkowski functionals can be used in combination with experiments, theory, or simulations. In this work, classical density functional theory (cDFT) is employed [33] to compute the free energy and adsorption of a Lennard-Jones fluid for a wide variety of geometries. This simulation technique is commonly used to study capillary condensation and wetting [34,35,36,37] and can capture larger length scales than molecular dynamics simulations. The Minkowski functionals are fitted to the cDFT results to study how well they can describe the complex phase behavior of a Lennard-Jones fluid under tight confinement.
We find that Minkowski functionals can provide a good description of Lennard-Jones fluids down to fairly small system sizes. In addition, it is found that topology has a different effect on the phase envelope shift of a Lennard-Jones fluid under confinement depending on whether the phase transition under consideration is a continuous or discrete (first-order) transition. The reason behind this intriguing behavior is still under active investigation.
2. Theory
2.1. Minkowski Functionals
The Minkowski functionals are a concept from integral geometry. These functionals characterize both the morphology and the topology of a spatial pattern [38,39]. For a D dimensional space, there are functionals. Considering a 2D system with a surface, X, and a smooth boundary, , the following functionals can be defined:
where is the total surface area, , a surface element, , the total circumference, a circumference element, , the total signed curvature, and is the local signed curvature [40]. Following the Gauss–Bonnet theorem, in the absence of geodesic curvature, the signed curvature is directly proportional to the Euler characteristic, , which is a measure of connectivity/topology. Now consider a functional, , which is additive:
motion invariant:
and continuous:
Then, following Hadwiger’s theorem [30], this functional, , can be expressed as a linear combination of Minkowski functionals, , as follows:
Additivity implies that the functional of the domain consisting of both and is equal to the sum of the functionals of the individual domains and , minus the boundary. Motion invariance signifies that the value of the functional is independent of the translation or rotation of the domain X. Lastly, continuity means that as a series of domains converges to domain X, the functional of the series should converge to the functional of X as well. An example of such a functional is the grand potential or Landau free energy, , which is commonly used to study capillary condensation [41,42]. For a 2D system, the grand potential can thus be written as [20]:
where L is a unit length perpendicular to the 2D system, is the average local pressure, is the surface tension between the liquid and the wall, and is the signed bending rigidity. The above expression for the grand potential demonstrates the importance of Hadwiger’s theorem. The pressure, surface tension, and signed bending rigidity are all only dependent on the chemical potential, , and the temperature, T. Thus, the above equation shows how thermodynamics can be separated from morphology and topology [31]. Once the grand potential is known, other thermodynamic properties can be derived. This includes the excess free energy or surface tension [13,43]:
and, through Gibbs’ theorem, the excess adsorption:
In the above equations, is the bulk pressure and is the bulk density. While it has been suggested in the past that Gibbs’ theorem is not valid for some systems undergoing capillary condensation [34,41], later work found that Gibbs’ theorem is not violated when using an arc length tracking algorithm [13,44].
In addition to the excess adsorption, one can also compute the effect of confinement on the phase envelope [43]:
With:
where and are the solid-gas and solid-liquid surface energies, respectively, and and are the solid-gas and solid-liquid bending rigidities. The above equation is a generalization of the Kelvin equation, and an equation of the same form can be derived for the temperature shift [45]. Two points should be noted about the above equation: (i) due to diverging density fluctuations, a mean field approach is not expected to fully capture the correct scaling at the critical point [46], and (ii) the correlation length that measures the range of density fluctuations at the critical point also diverges, resulting in a potential violation of Hadwiger’s theorem. When the characteristic interaction length scale becomes of the same order as the system size it is no longer additive. However, while these points need to be investigated further, the above equation should give a good first approximation of how phase behavior is affected by topology.
3. Methods
3.1. Density Functional Theory
The Minkowski functionals can be used with either experiments, theory, or simulations. In this work, classical density functional theory (cDFT) is used to compute the coefficients in front of the Minkowski functionals. DFT is a mean field approach that was first developed for quantum mechanics [47] but was later adapted to describe classical mechanical systems [33] as well. This mean field approach has the advantage of giving a description of the physics at the nanoscopic molecular level while scaling up to the mesoscopic level at which capillary condensation occurs.
The two basic assumptions of density functional theory are (i) the Hohenberg-Kohn variational principle, which states that there is a functional of the ground state free energy which can be fully recovered from the ground-state one-particle density distribution, and (ii) the Gibbs’ inequality, which states that any particle density distribution that is not the ground state will have a higher free energy than the ground state free energy [47]. Formulated in the grand canonical (,V,T) ensemble, at the most basic level this means that classical DFT solves the following minimization problem:
where is the grand potential or Landau free energy, is the density, and is the Fréchet (functional) derivative [48]. To solve the above equation, we use the cDFT solver Tramonto, which is developed at the Sandia National Laboratories [13,44,48,49,50]. This code uses perturbation theory where the grand potential is split up as:
where is the ideal contribution, is the hard-sphere contribution, and is the perturbation contribution. is the external potential resulting from (pore) walls acting on the fluid. The individual contributions are given by the following integrals:
In the above equations, , with the Boltzmann constant, and T the temperature, is the thermal de Broglie wavelength, is the excess free energy density which is a function of , a set of weighted non-local densities, and is an interaction potential. This potential is based on the Weeks-Chandler-Anderson approach [51], which splits an interaction potential as for and for . The potential is a cut and shifted Lennard-Jones potential with , where:
and . Here is the depth of the potential well and is the finite distance at which the potential is zero. In this work, the Fundamental Measure Theory (FMT) is used with the White Bear functional [52]. The weighted non-local densities are:
with the weight functions:
The excess free energy density is given by with:
The last term that needs to be defined is the external potential, , which is defined as:
where the integral is taken over all elements assigned to the (pore) wall. The potential is the same as the Lennard-Jones potential defined in Equation (17), but with replaced with and replaced with . More details about the discretization of the above equations, their numerical implementation, and how to solve them in parallel can be found in the literature [13,44,48,49,50]. Phase transitions are tracked using the pseudo arc length continuation algorithm of Keller [44,53] which has been implemented in the LOCA software library [54].
3.2. Geometries
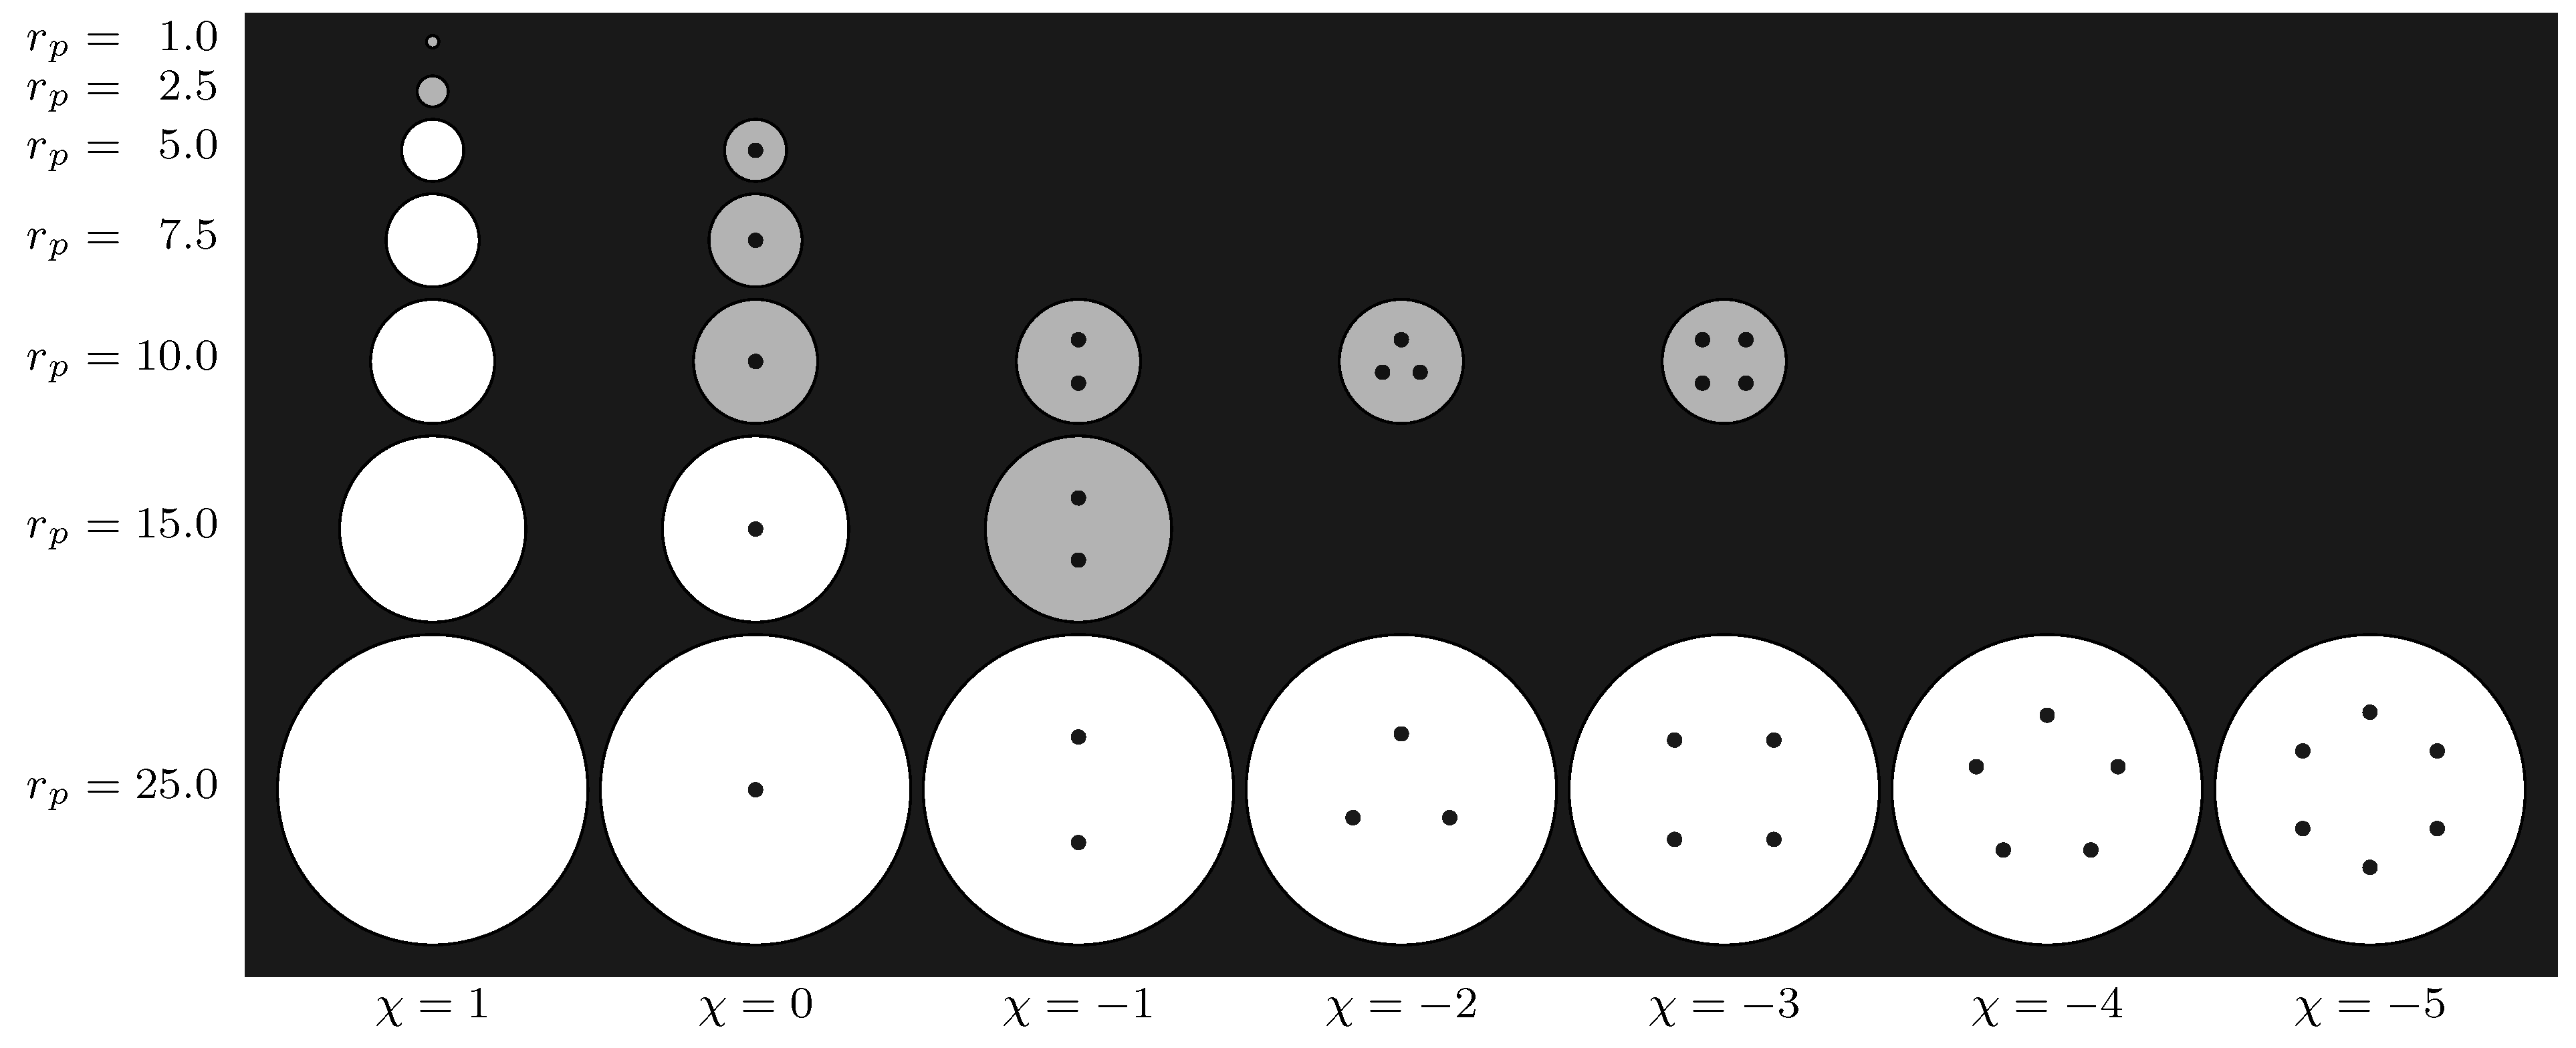
As mentioned in the introduction, the Minkowski functionals framework allows for the separation of thermodynamics and geometry. Therefore, one can study a problem using simple geometries and extrapolate the results to complex geometries with known Minkowski functionals. Figure 1 shows these various 2D geometries and topologies. Along the vertical axis, the various shapes show cross-sections of pores with different radii, . Along the horizontal axis rods with radius (≈) are placed inside the pores to modify the Euler characteristic . While these specific pores may or may not be found in nature or technology, they represent any material with a similar topology. Materials with a negative Euler characteristic are common in nature [55,56]. A negative Euler characteristic indicates that the pore space is multiple times connected. The various 2D Minkowski functionals associated with the surface area, circumference, and signed curvature, respectively, can be computed with the following set of equations:
where is the number of rods inside the pore. As mentioned in Section 2.1, for the Minkowski functionals to accurately capture the physics of capillary condensation, the conditions in Hadwiger’s theorem need to be met. Considering that for very small pores the characteristic interaction length between molecules becomes of the same order as the pore size, the additivity constraint (Equation (2)) is expected to break down first. In the literature it is reported that an error of about is found when the system size becomes of the order of ≈, where is the characteristic length scale of the interaction potential between molecules [31]. For the pores in gray in Figure 1 the minimum distance between the walls of the pore and/or the rods inside the pore is smaller than this distance, and Hadwiger’s theorem is expected to break down. Another potential source of error is that Hadwiger’s theorem applies to convex geometries while the pores are concave.
3.3. Simulation Parameters
Existing literature has focused on the behavior of hard-sphere fluids [31] and TraPPE force fields [32]. In this work, classical density functional theory (cDFT) simulations have been performed for a Lennard-Jones fluid. The combination of a Lennard-Jones potential with cDFT allows for more complex behavior than a hard-sphere potential, while also reducing the need for computational resources compared to the TraPPE force fields combined with molecular dynamics simulations.
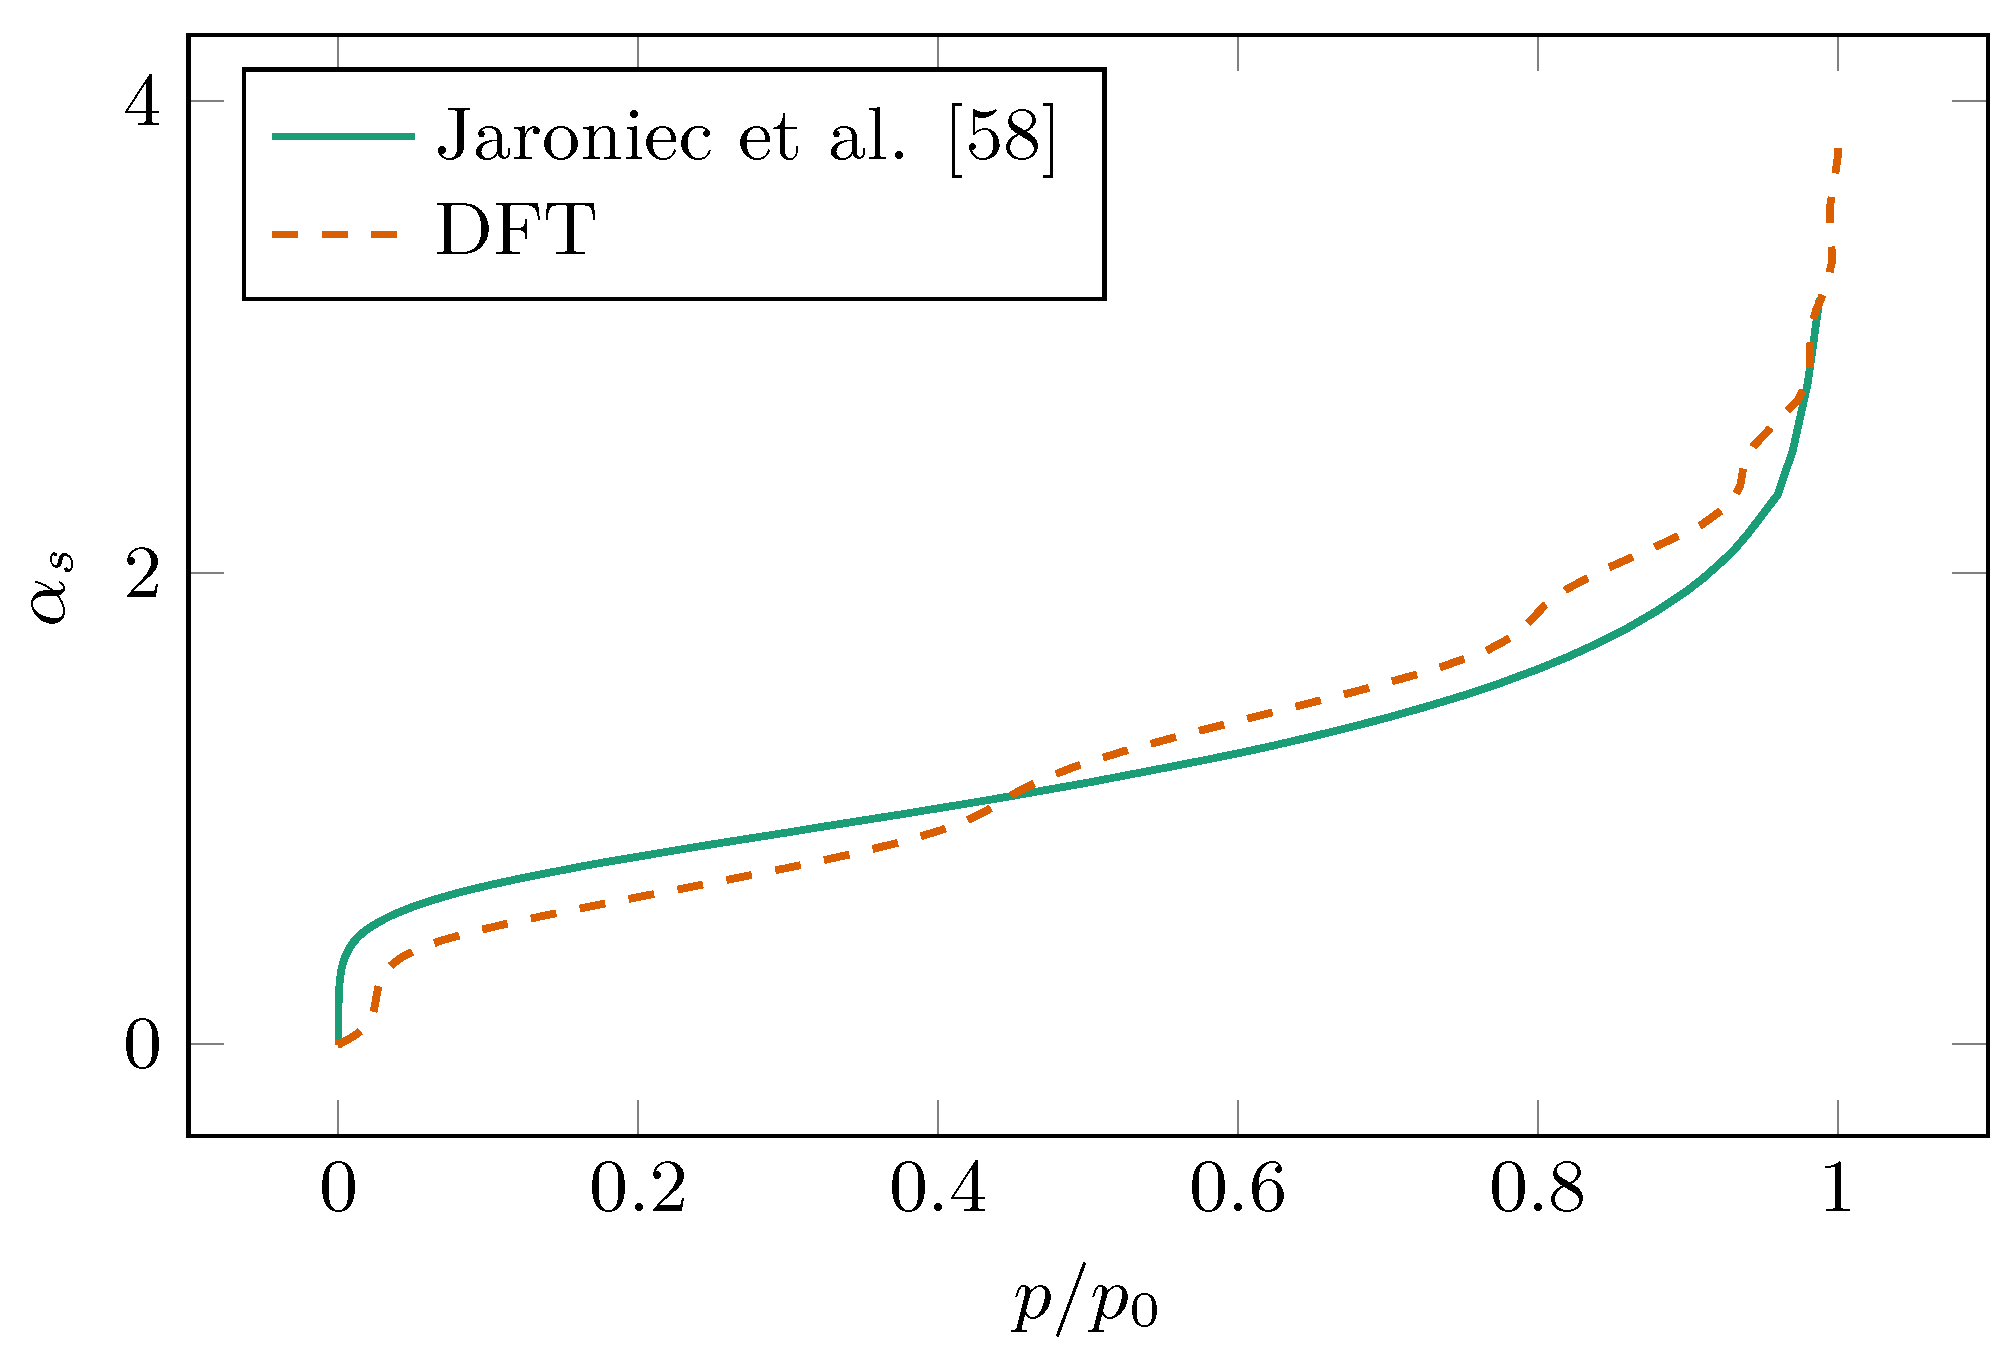
Table 1 shows the parameters used in the cDFT simulations. Because it is a commonly used model system [57,58,59], the Lennard-Jones fluid is parameterized as Nitrogen in Vycor glass. The parameters are the same as those used by Ravikovitch et al. [60] and Ustinov et al. [35] and are very similar to the parameters used by Gelb & Gubbins [61] in their grand canonical Monte Carlo simulations of nitrogen in Vycor glass. Figure 2 shows a comparison between cDFT simulations and experiments [62] for the adsorption isotherm of N2 in a SiO2 slit pore with a width of . The results confirm that the parameters listed in Table 1 are a reasonable choice. With more advanced models for the interaction between N2 and SiO2, a better match can be obtained between cDFT simulations and experiments [35,60]. However, the choice of the same potential for particle-particle and wall-particle keeps the system simple and the results easier to interpret. The computations are performed in the grand canonical () ensemble and the relation between the chemical potential and pressure is obtained from a bulk cDFT simulation. Since the pore space is in equilibrium with the bulk, both the temperature and chemical potential are constant throughout the system [63].
3.4. Minkowski Coefficients
To compute the Minkowski coefficients, , the local pressure, , the surface tension between the liquid and the wall, and the signed bending rigidity, for a given temperature, T, and chemical potential , one needs to know the grand potential and Minkowski functionals for three different geometries. To improve accuracy, cDFT simulations are performed for all geometries shown in Figure 1 and one set of coefficients is computed by performing a least-squares fit to all the simulation data. Any simulation technique or theory that computes free energy can thus be used in combination with the Minkowski functionals. For experiments, the excess adsorption can be measured instead.
4. Results
In this section, the results for the Lennard-Jones fluid cDFT simulations are presented, and how these results can be described using the Minkowski functionals. All the parameters have been made dimensionless with and . An overview of the various dimensionless variables is shown in Table 2.
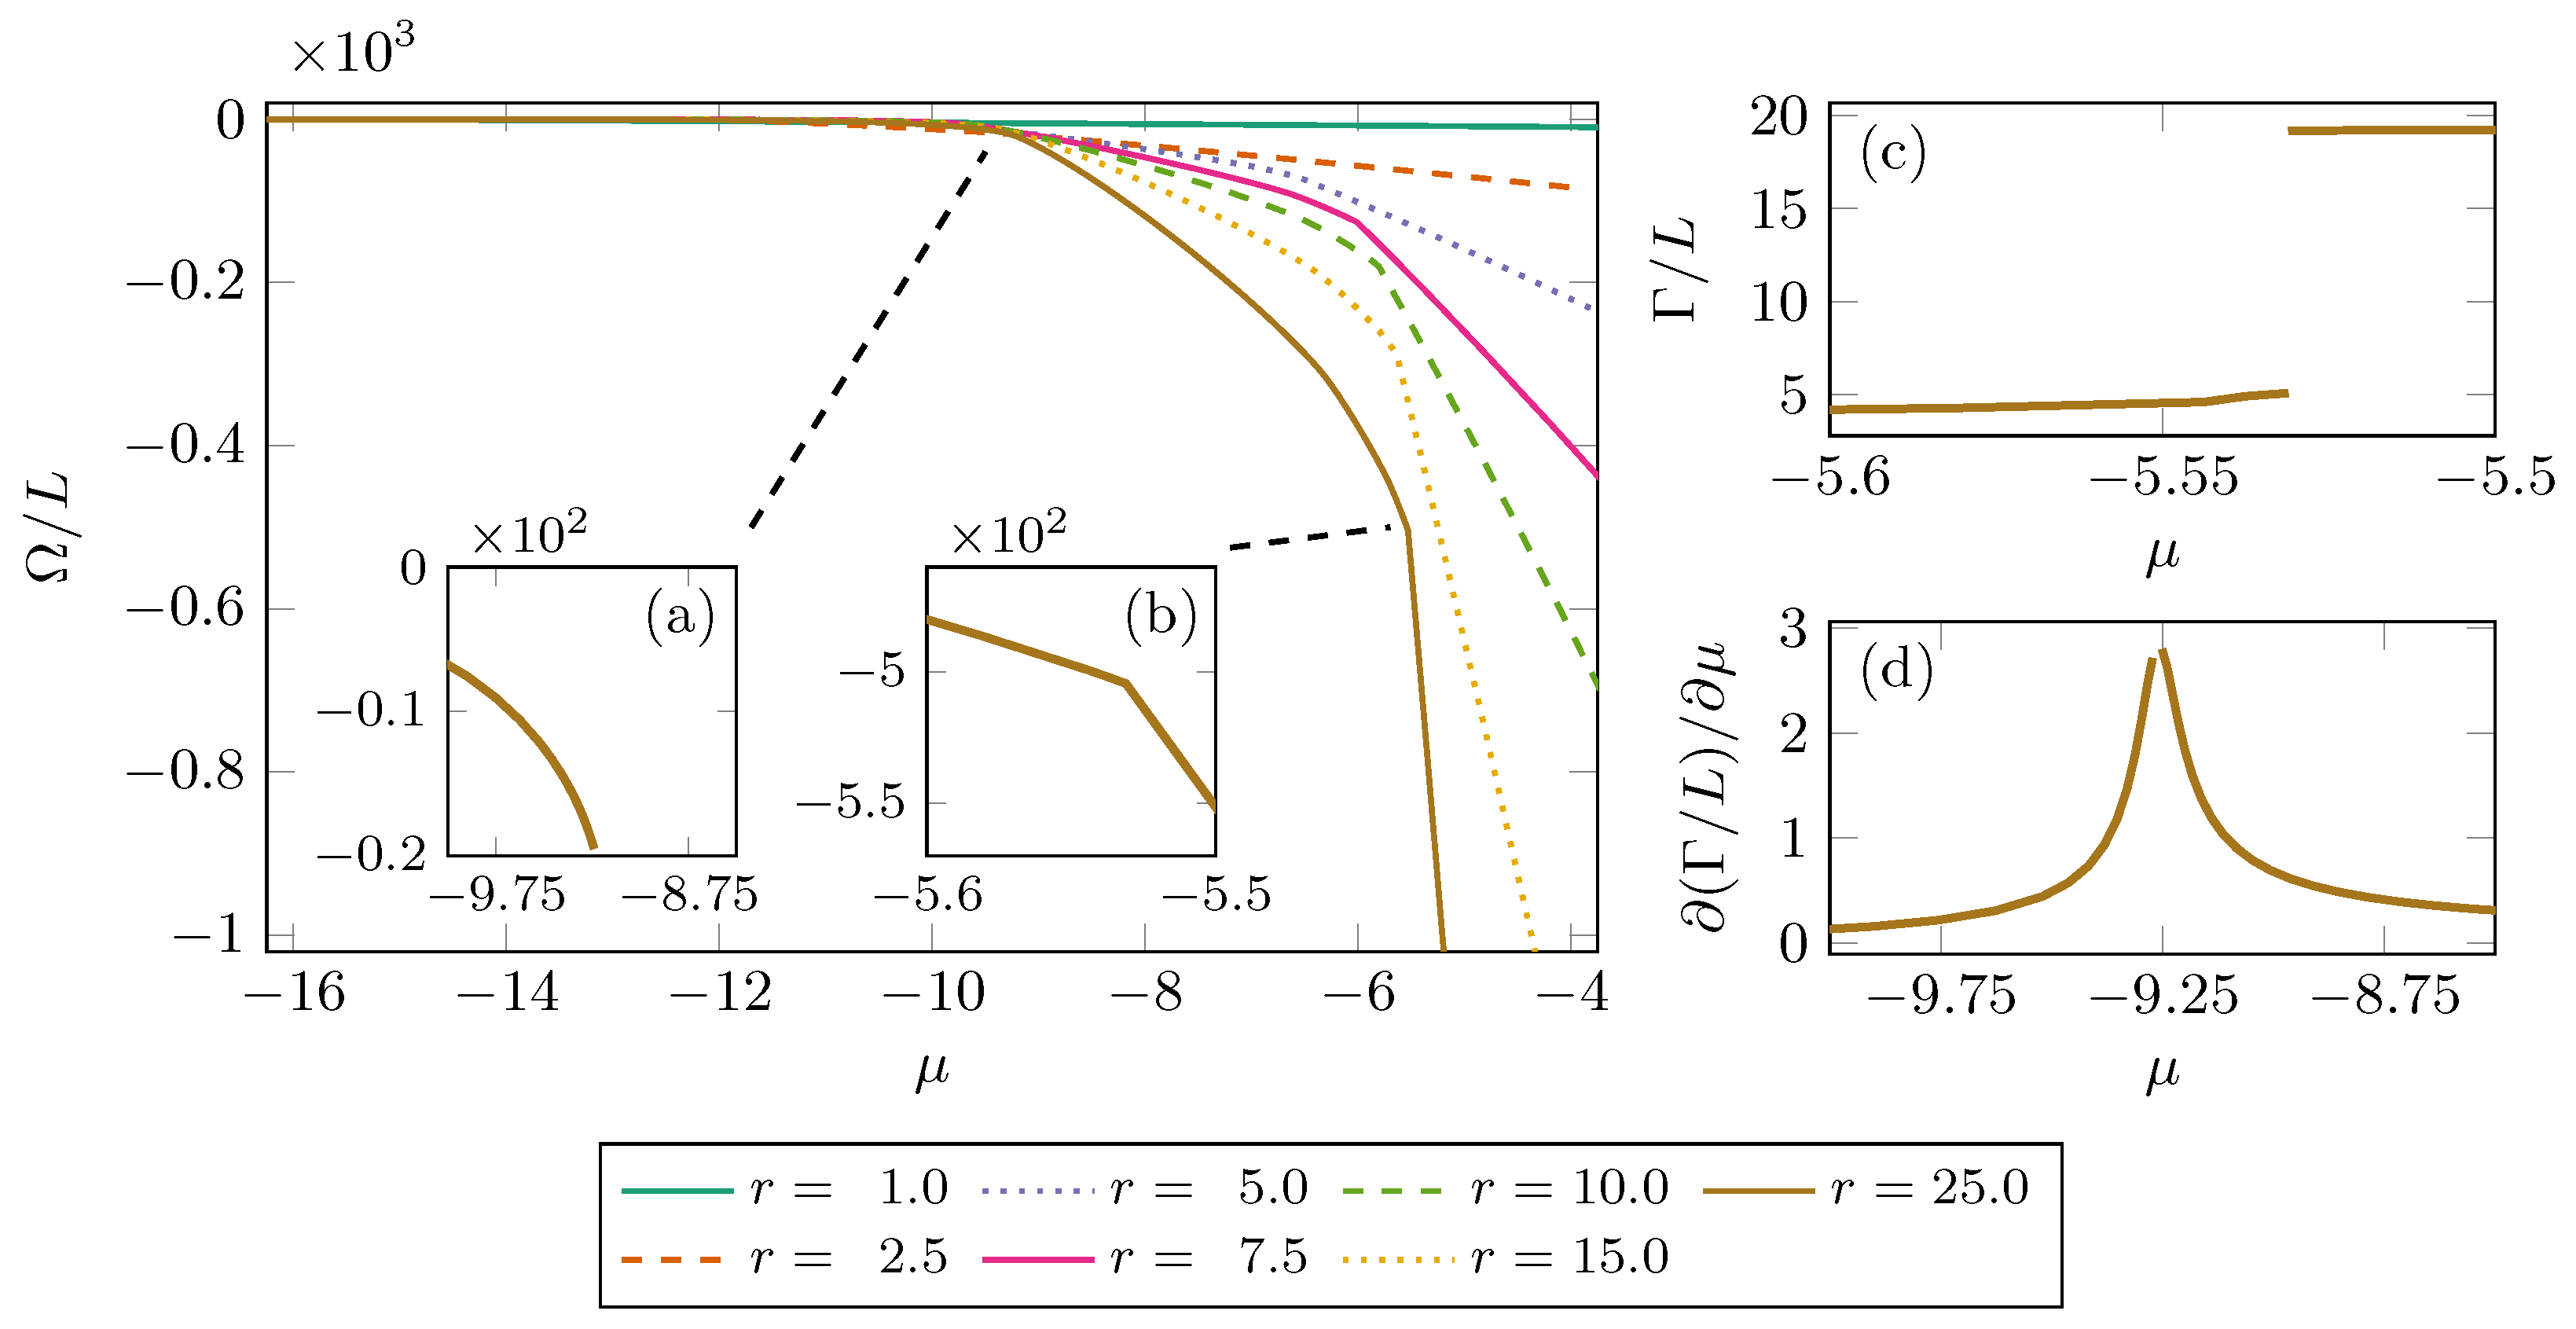
Figure 3 shows some typical results of our cDFT simulations; it shows the 2D dimensionless free energy as a function of the dimensionless chemical potential, , for . For a pore with radius (≈) three different regimes can be identified. Initially, when the chemical potential is very low, the pore is completely empty. At about (≈) a phase transition can be observed, which marks the onset of gas adsorption on the pore wall. Eventually, at about (≈) another phase transition can be observed, which is the capillary condensation phase transition. Consistently with the literature, the capillary condensation phase transition in this 2D system is a first-order phase transition [46]. It is marked by a van der Waals loop in the grand potential and a jump in the excess adsorption as function of the chemical potential [45].
The three different regimes are also identified in the literature [13,46]. The two phase transitions are shown in more detail in Figure 3a–d. In Figure 3a the derivative of the free energy changes continuously, suggesting that the adsorption of gas on the pore wall is a continuous phase transition. Figure 3d shows the matching divergence of the derivative of the excess adsorption. In Figure 3b the derivative of the free energy changes abruptly, indicating a discrete (first-order) phase transition. Figure 3d shows the matching jump in the excess adsorption. Consistently with the literature, as the pore radius becomes smaller the phase behavior changes [64]. For pores smaller than (≈) the discrete phase transition can no longer be observed and becomes continuous instead.
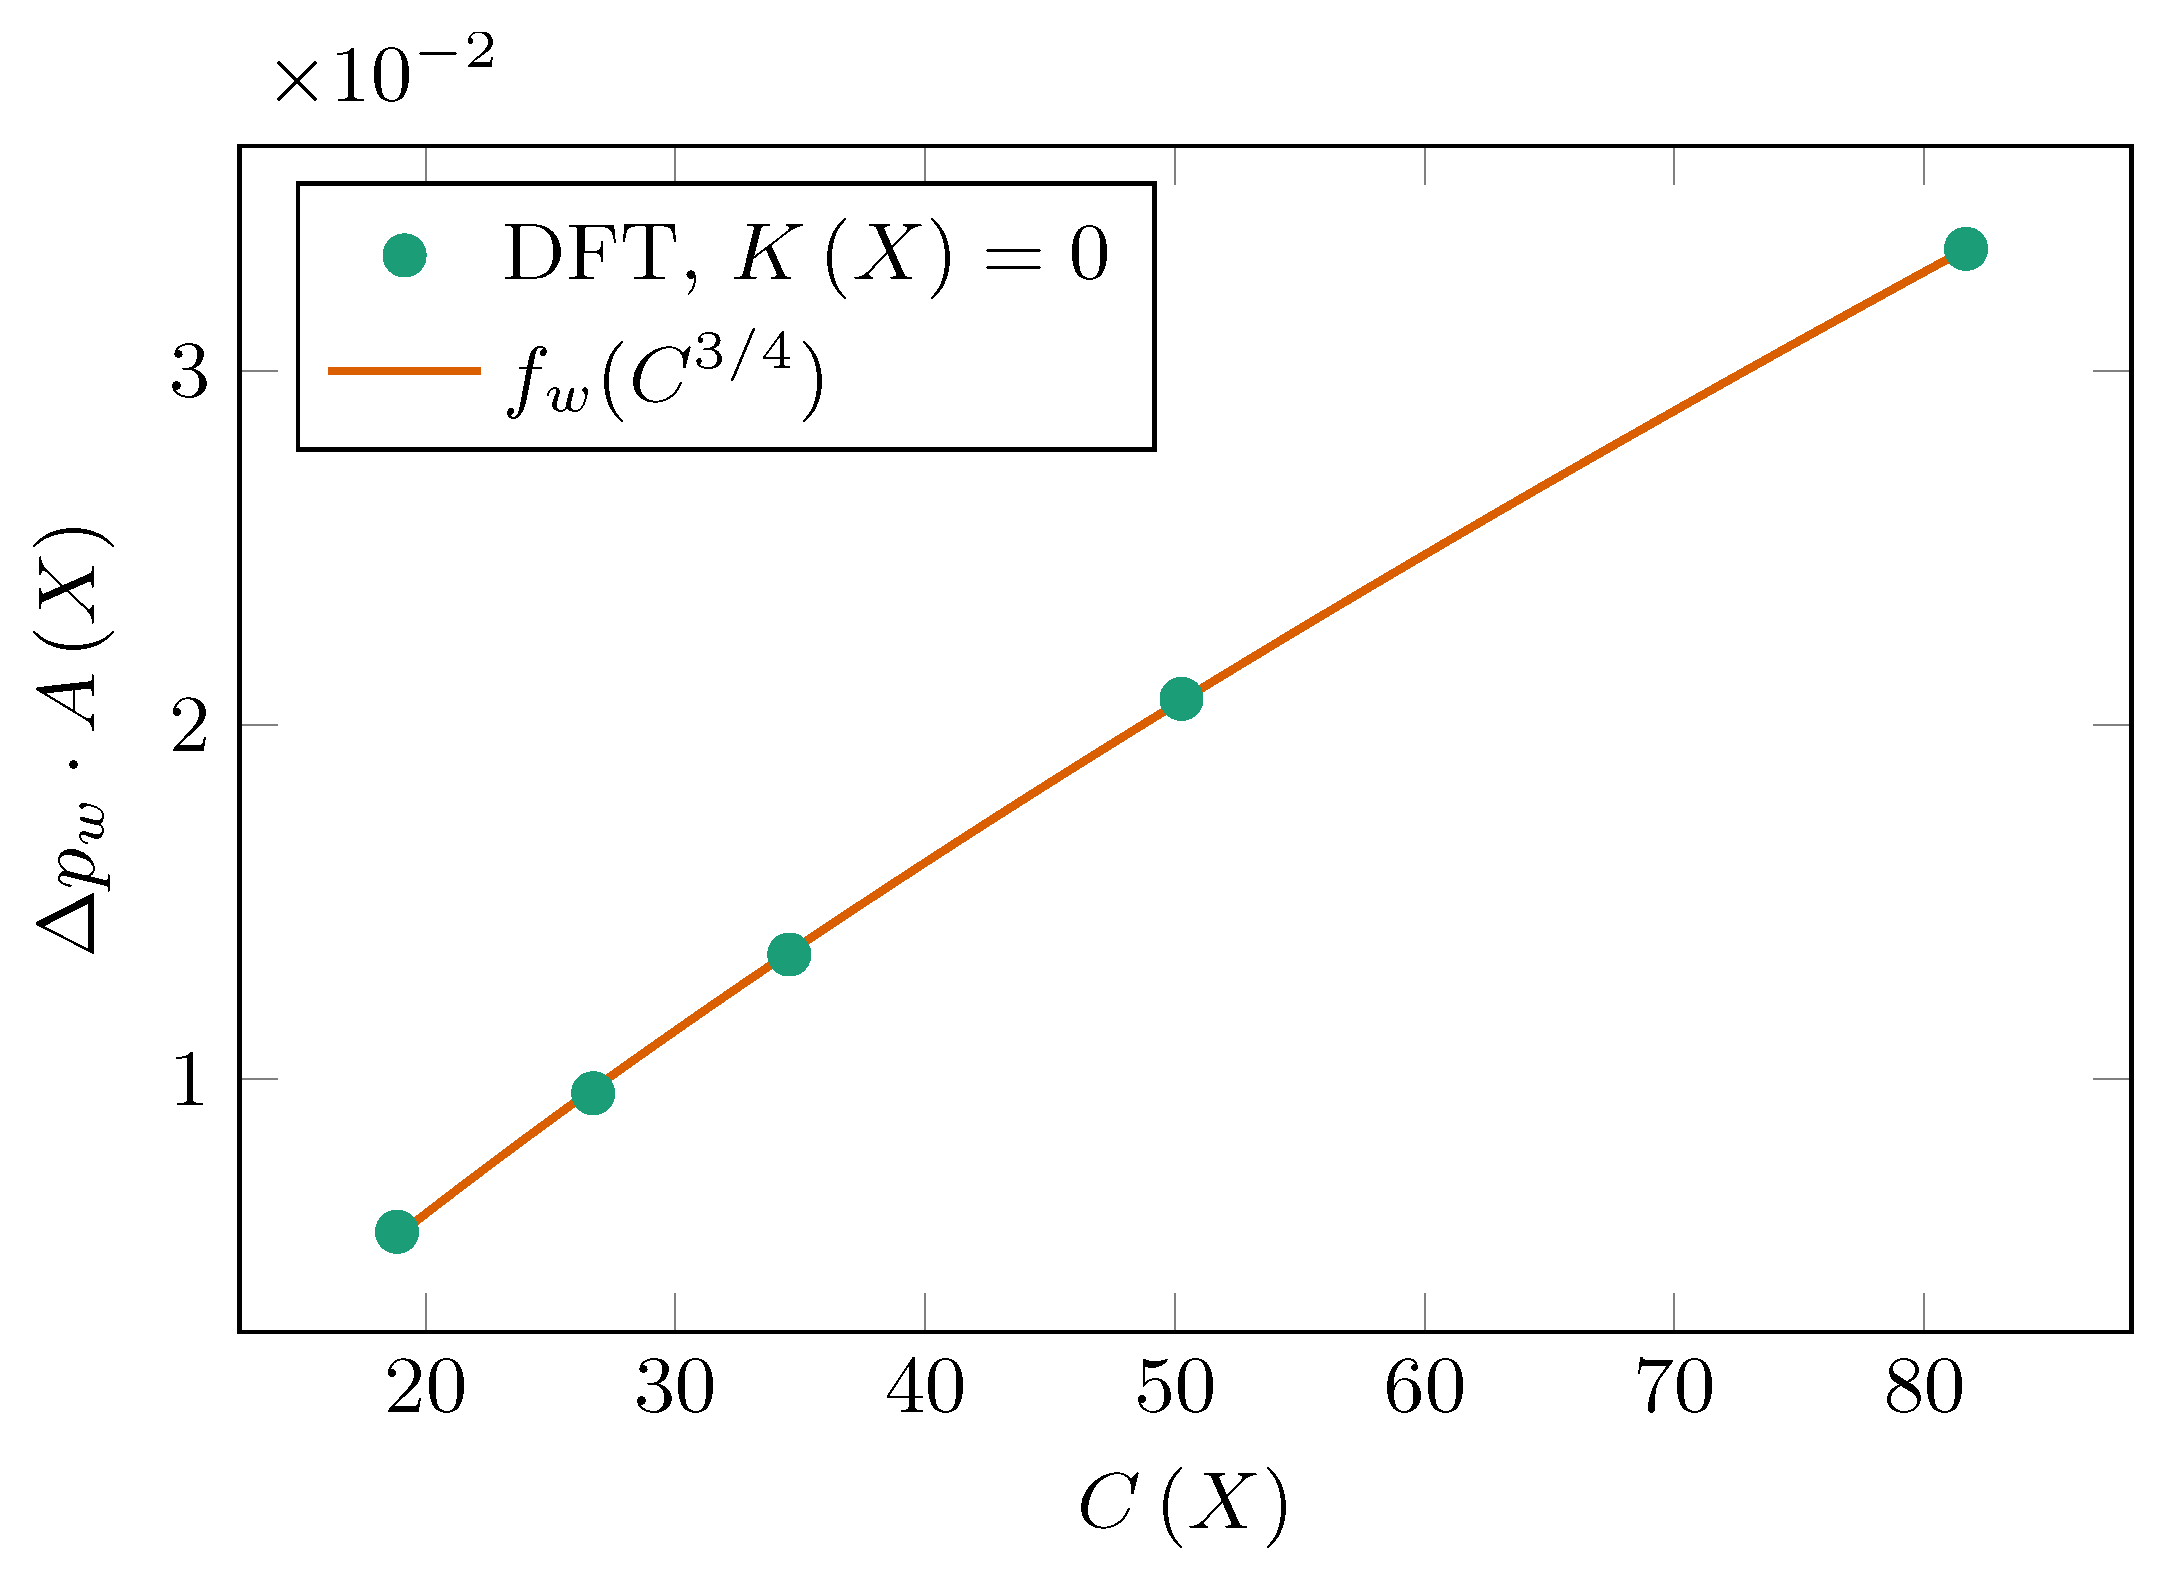
The continuous and discrete phase transitions are now further analyzed using Equation (9), which describes the phase envelope shift as a function of the Minkowski functionals. By only selecting geometries with , one can evaluate the coefficient . Figure 4 shows the dimensionless pressure difference between the continuous phase transition associated with adsorption of gas onto a wall in the bulk and inside a pore times the surface area Minkowski functional, , for [46]. This pressure difference can be predicted well by the function: , where the coefficients are: and . The discrepancy between the power of and the theoretical prediction of 1 shows how, due to the small system size, Hadwiger’s additivity assumption starts to break down. Excluded volume effects keeping molecules away from the wall could be another potential source of error.
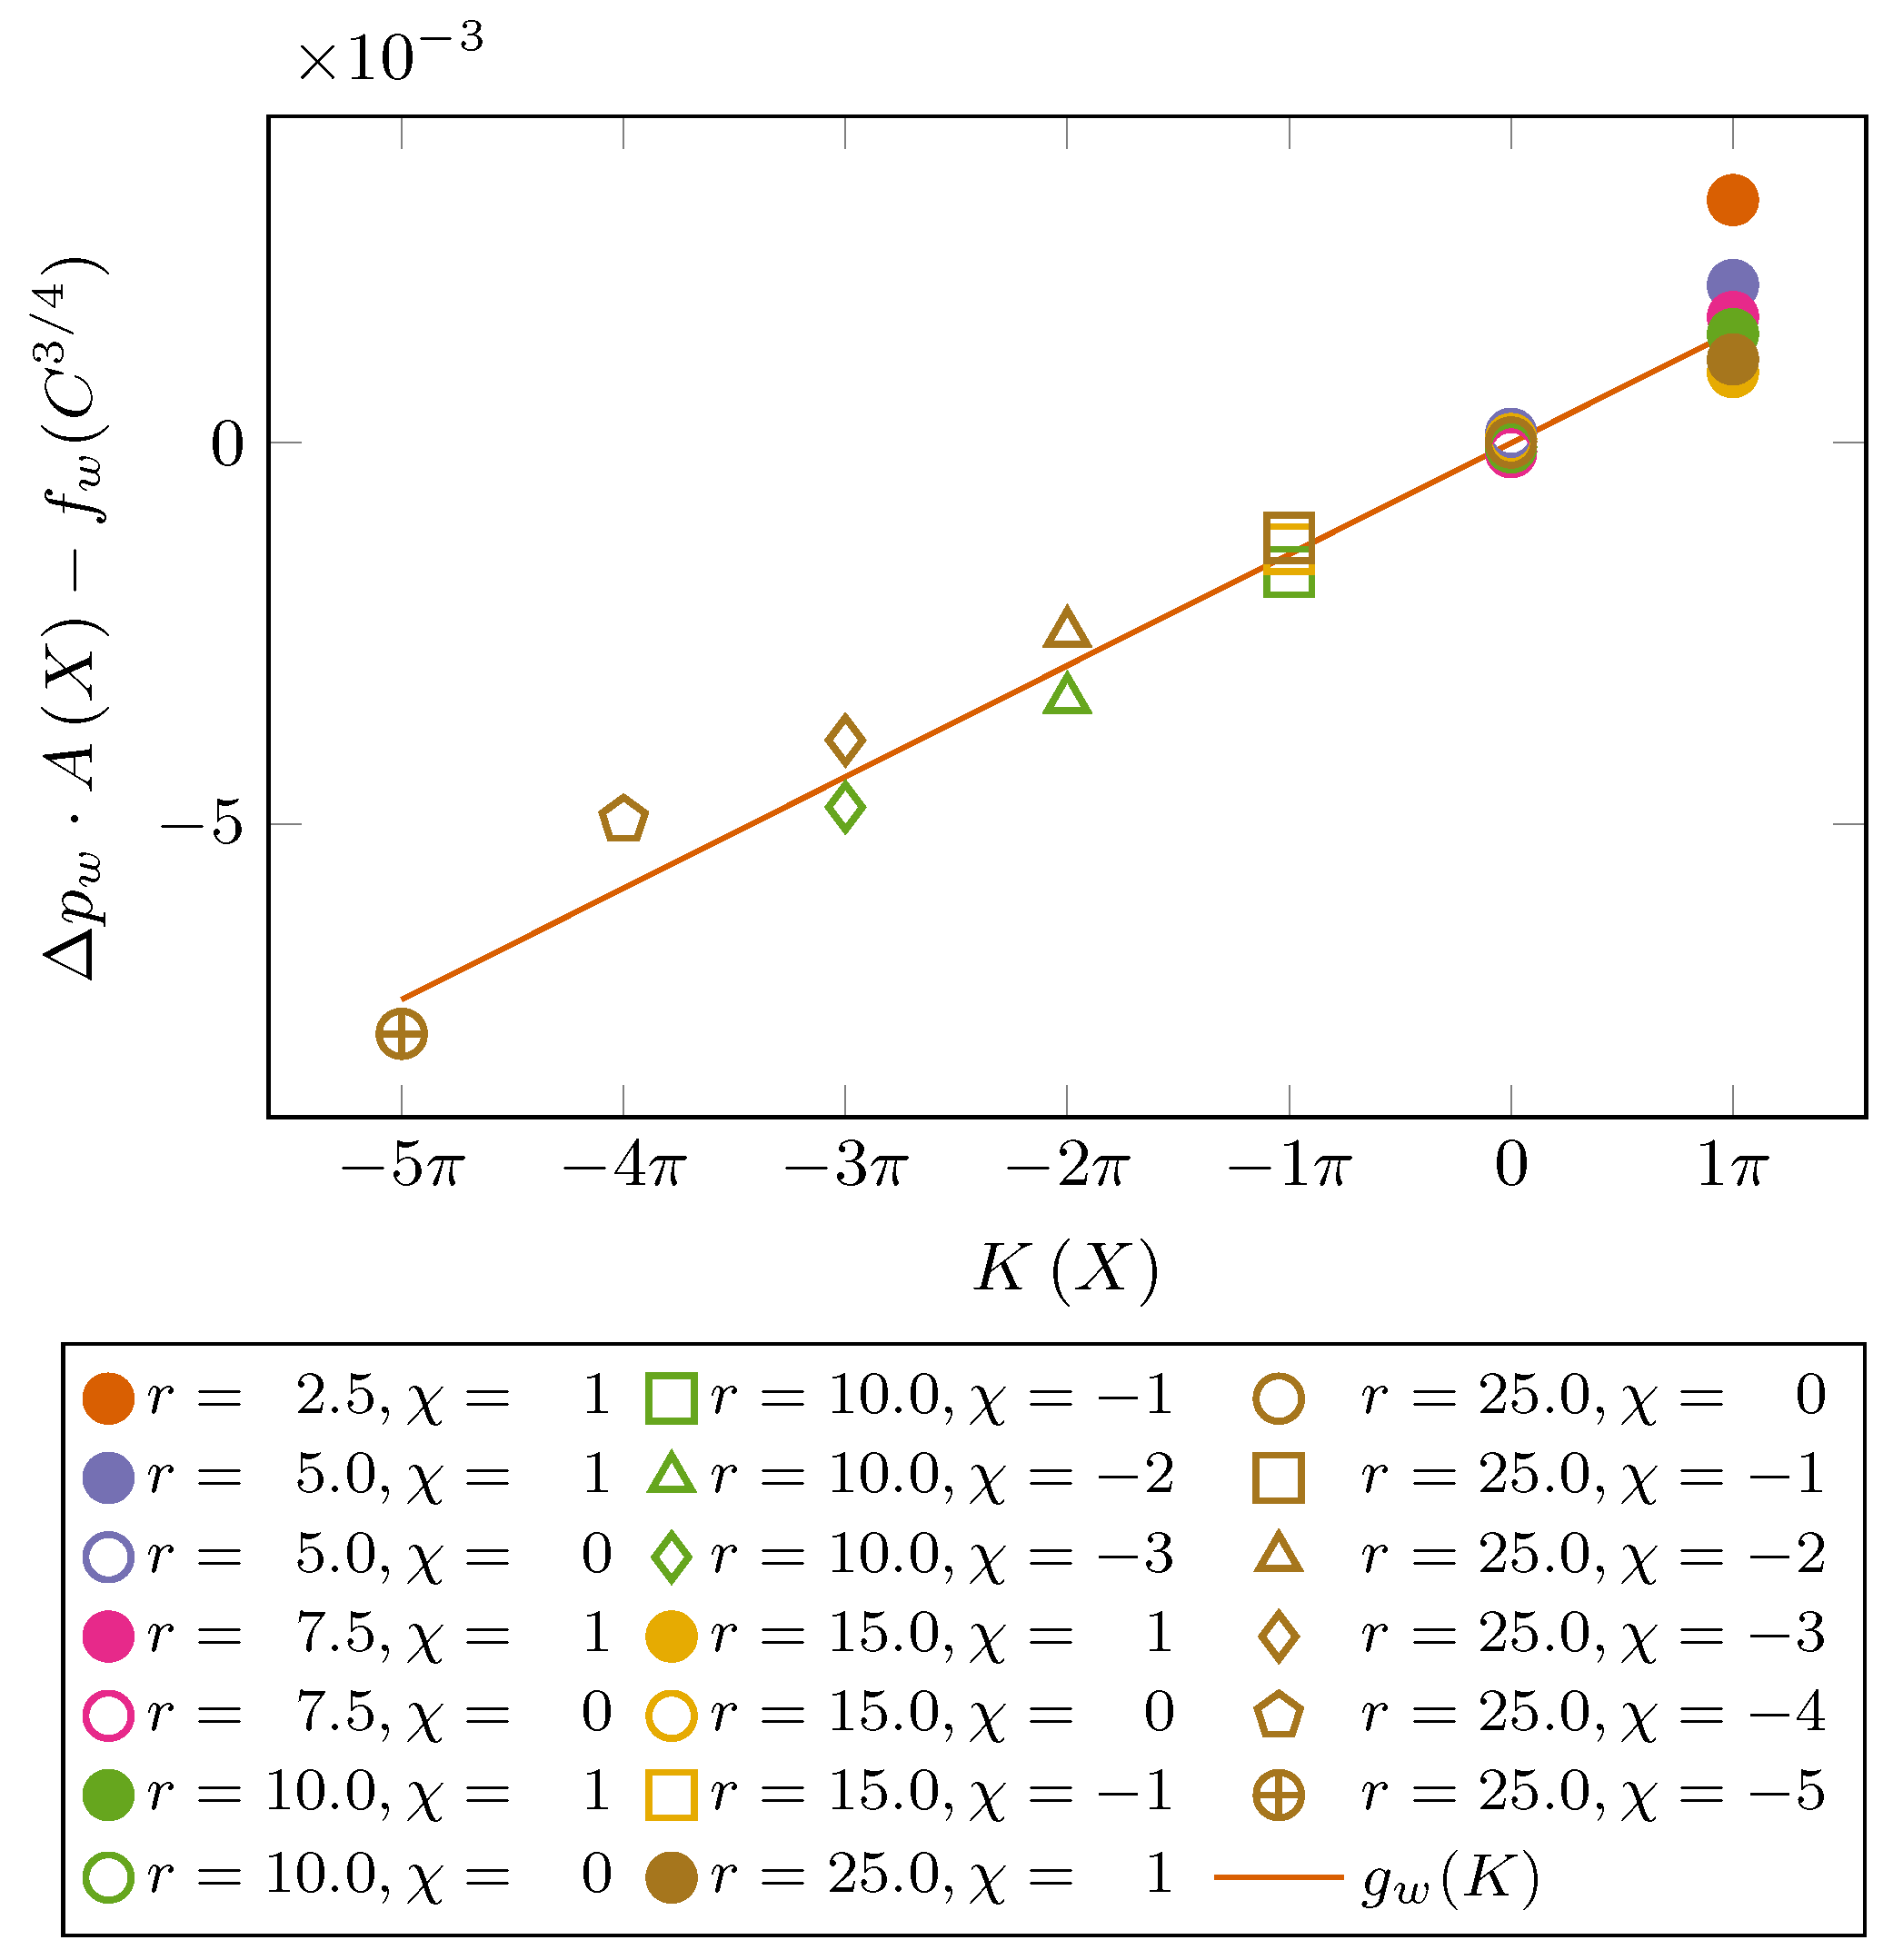
To find the value of and to validate how well the function describes the data, Figure 5 shows the pressure difference, , times the surface area Minkowski functional minus the function , , as a function of the Minkowski functional, . The graph shows a collapse of the data and, as expected, a linear fit with: , where . The collapse of the data confirms that the grand potential and thus the continuous pressure shift in the phase envelope times the surface area Minkowski functional, , is proportional to and is linearly dependent on the topology of the system . In addition, the data shows that the sensitivity of the pressure shift, , to topology is about an order of magnitude smaller than the sensitivity to the pseudo surface tension, . The outlier, (≈), , confirms the breakdown of Hadwiger’s theorem for small pore sizes.
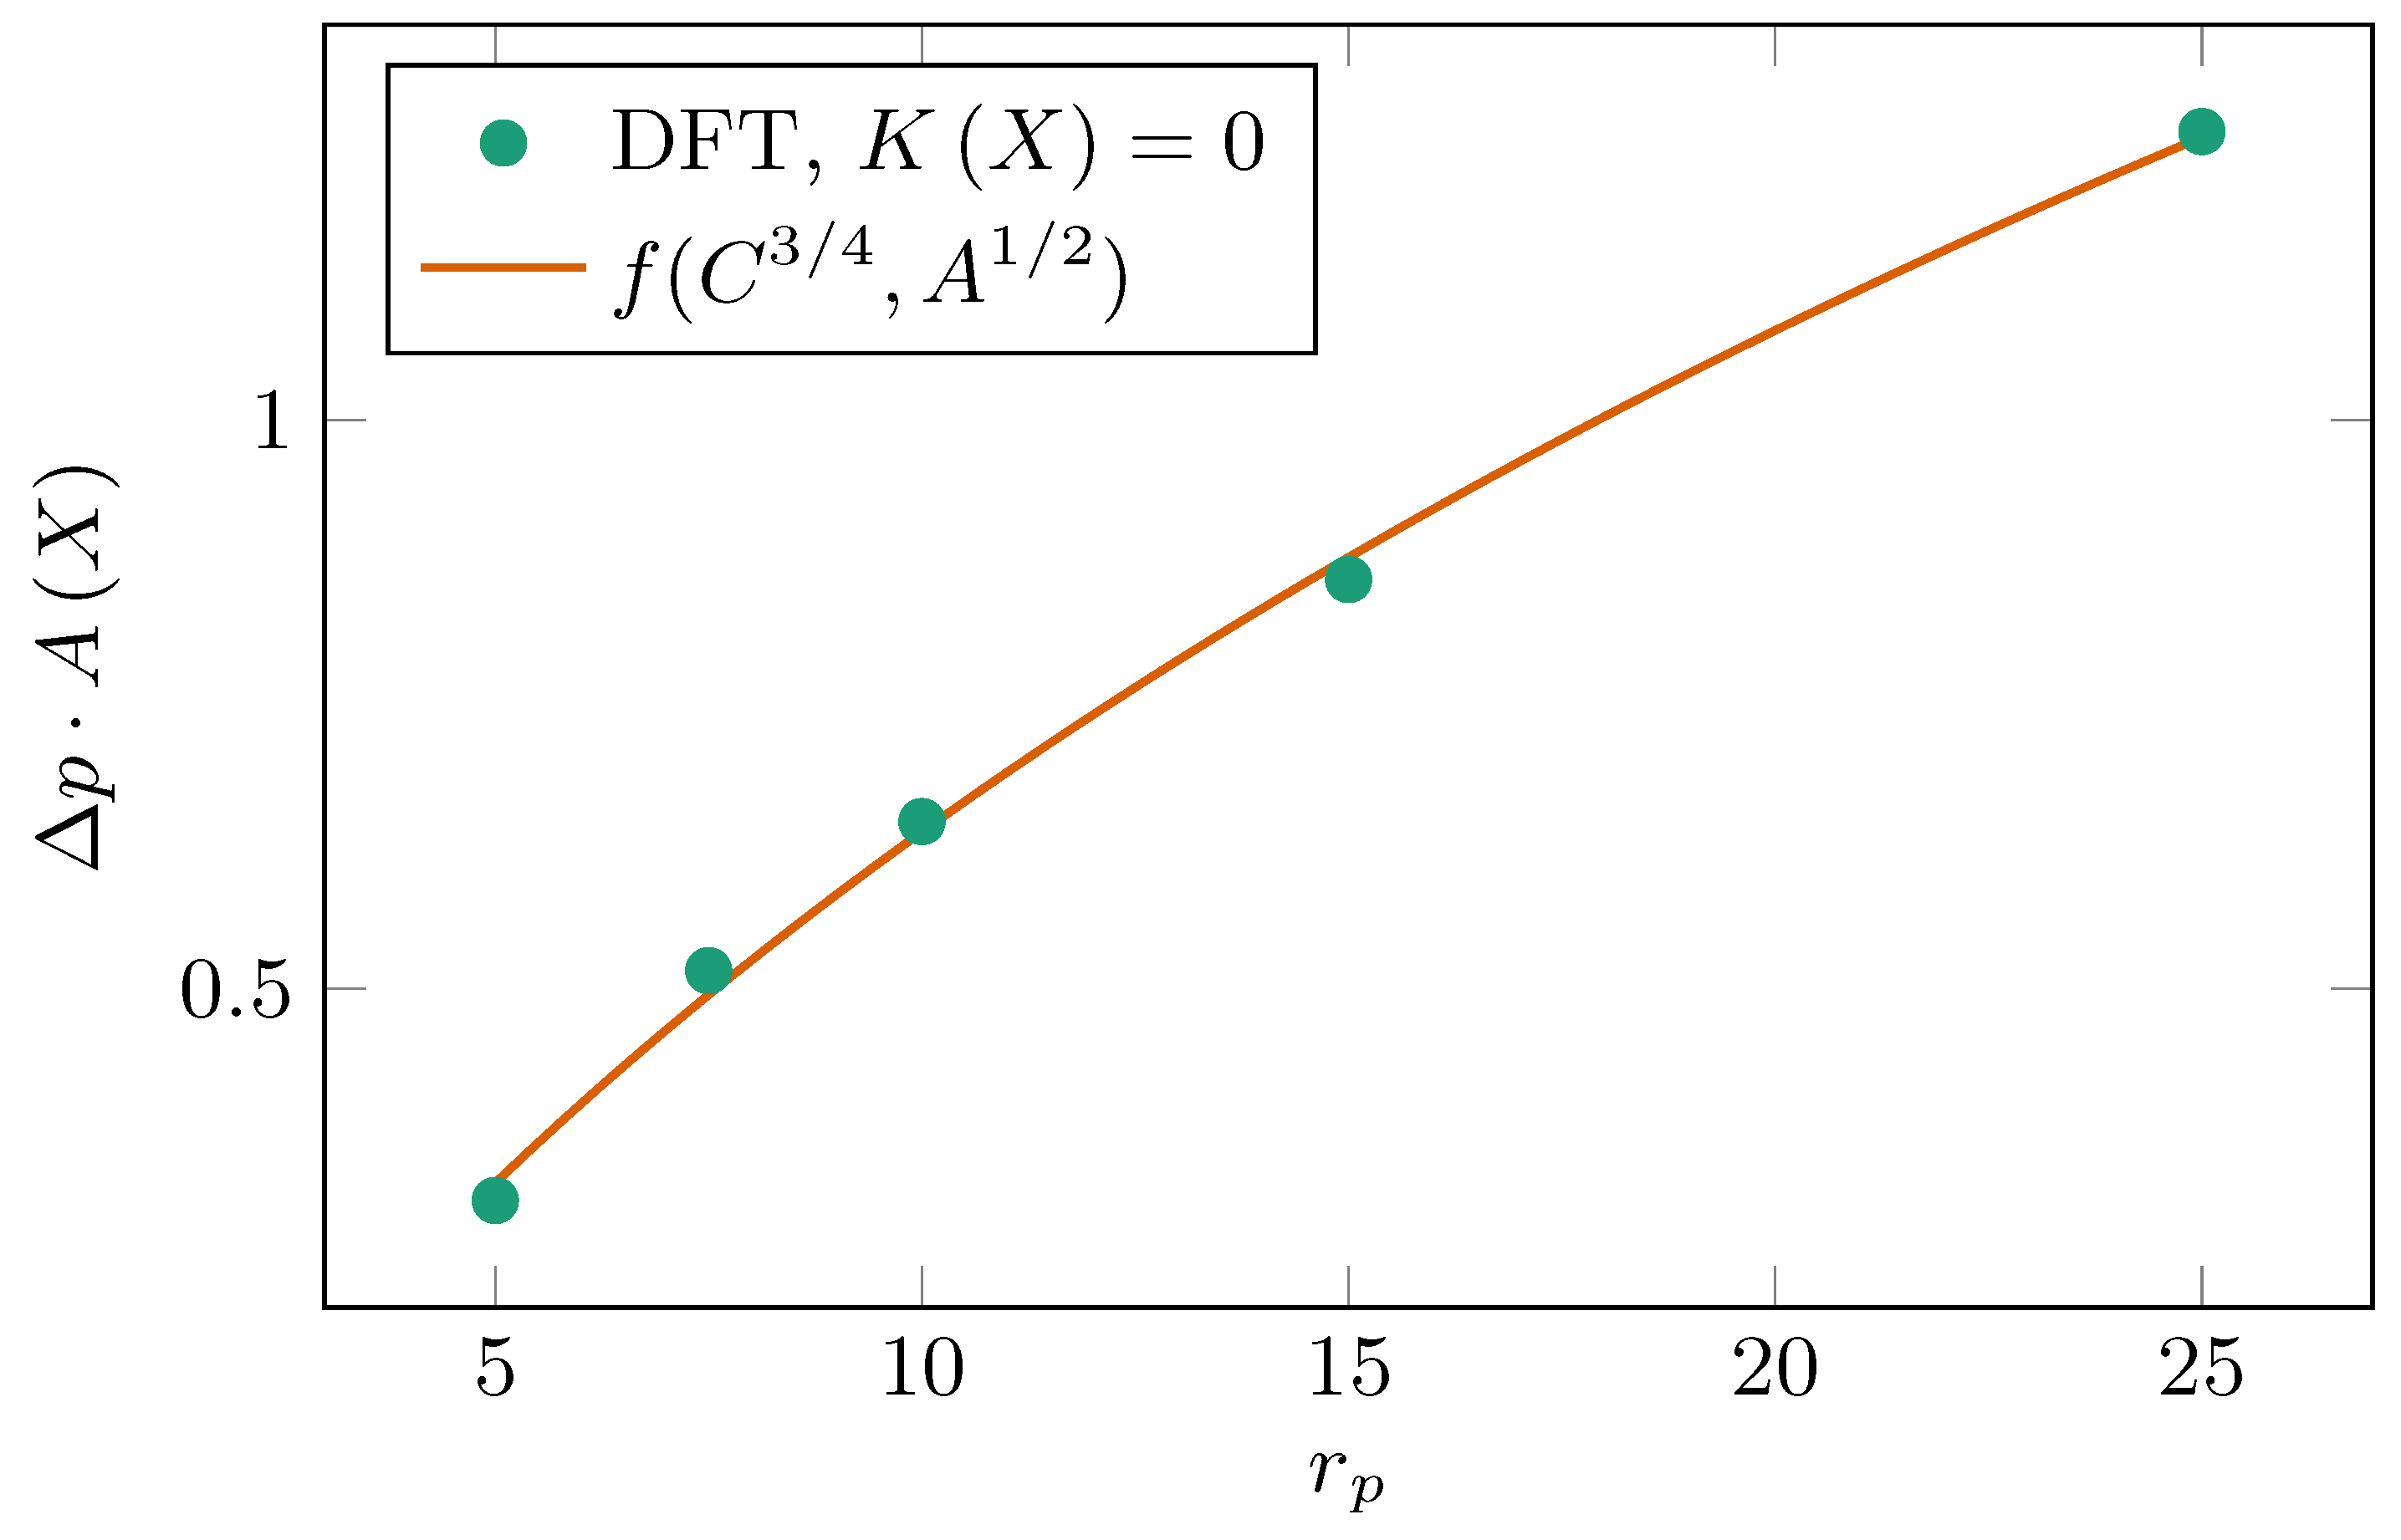
A similar analysis can be performed for the phase envelope shift of the discrete capillary condensation phase transition. Figure 6 shows the pressure difference between the capillary condensation pressure and the bulk phase transition pressure times the surface area Minkowski functional, , as a function of pore radius, . Because the rod size is constant across different simulations, the Minkowski functionals and can be expressed as a function of only the pore radius for constant bending rigidity, . The Minkowski functional for topology is zero in all the cDFT simulations shown in Figure 6, . The curve fit is equal to: , where the Minkowski functionals and only depend on . The coefficients are: , , and .
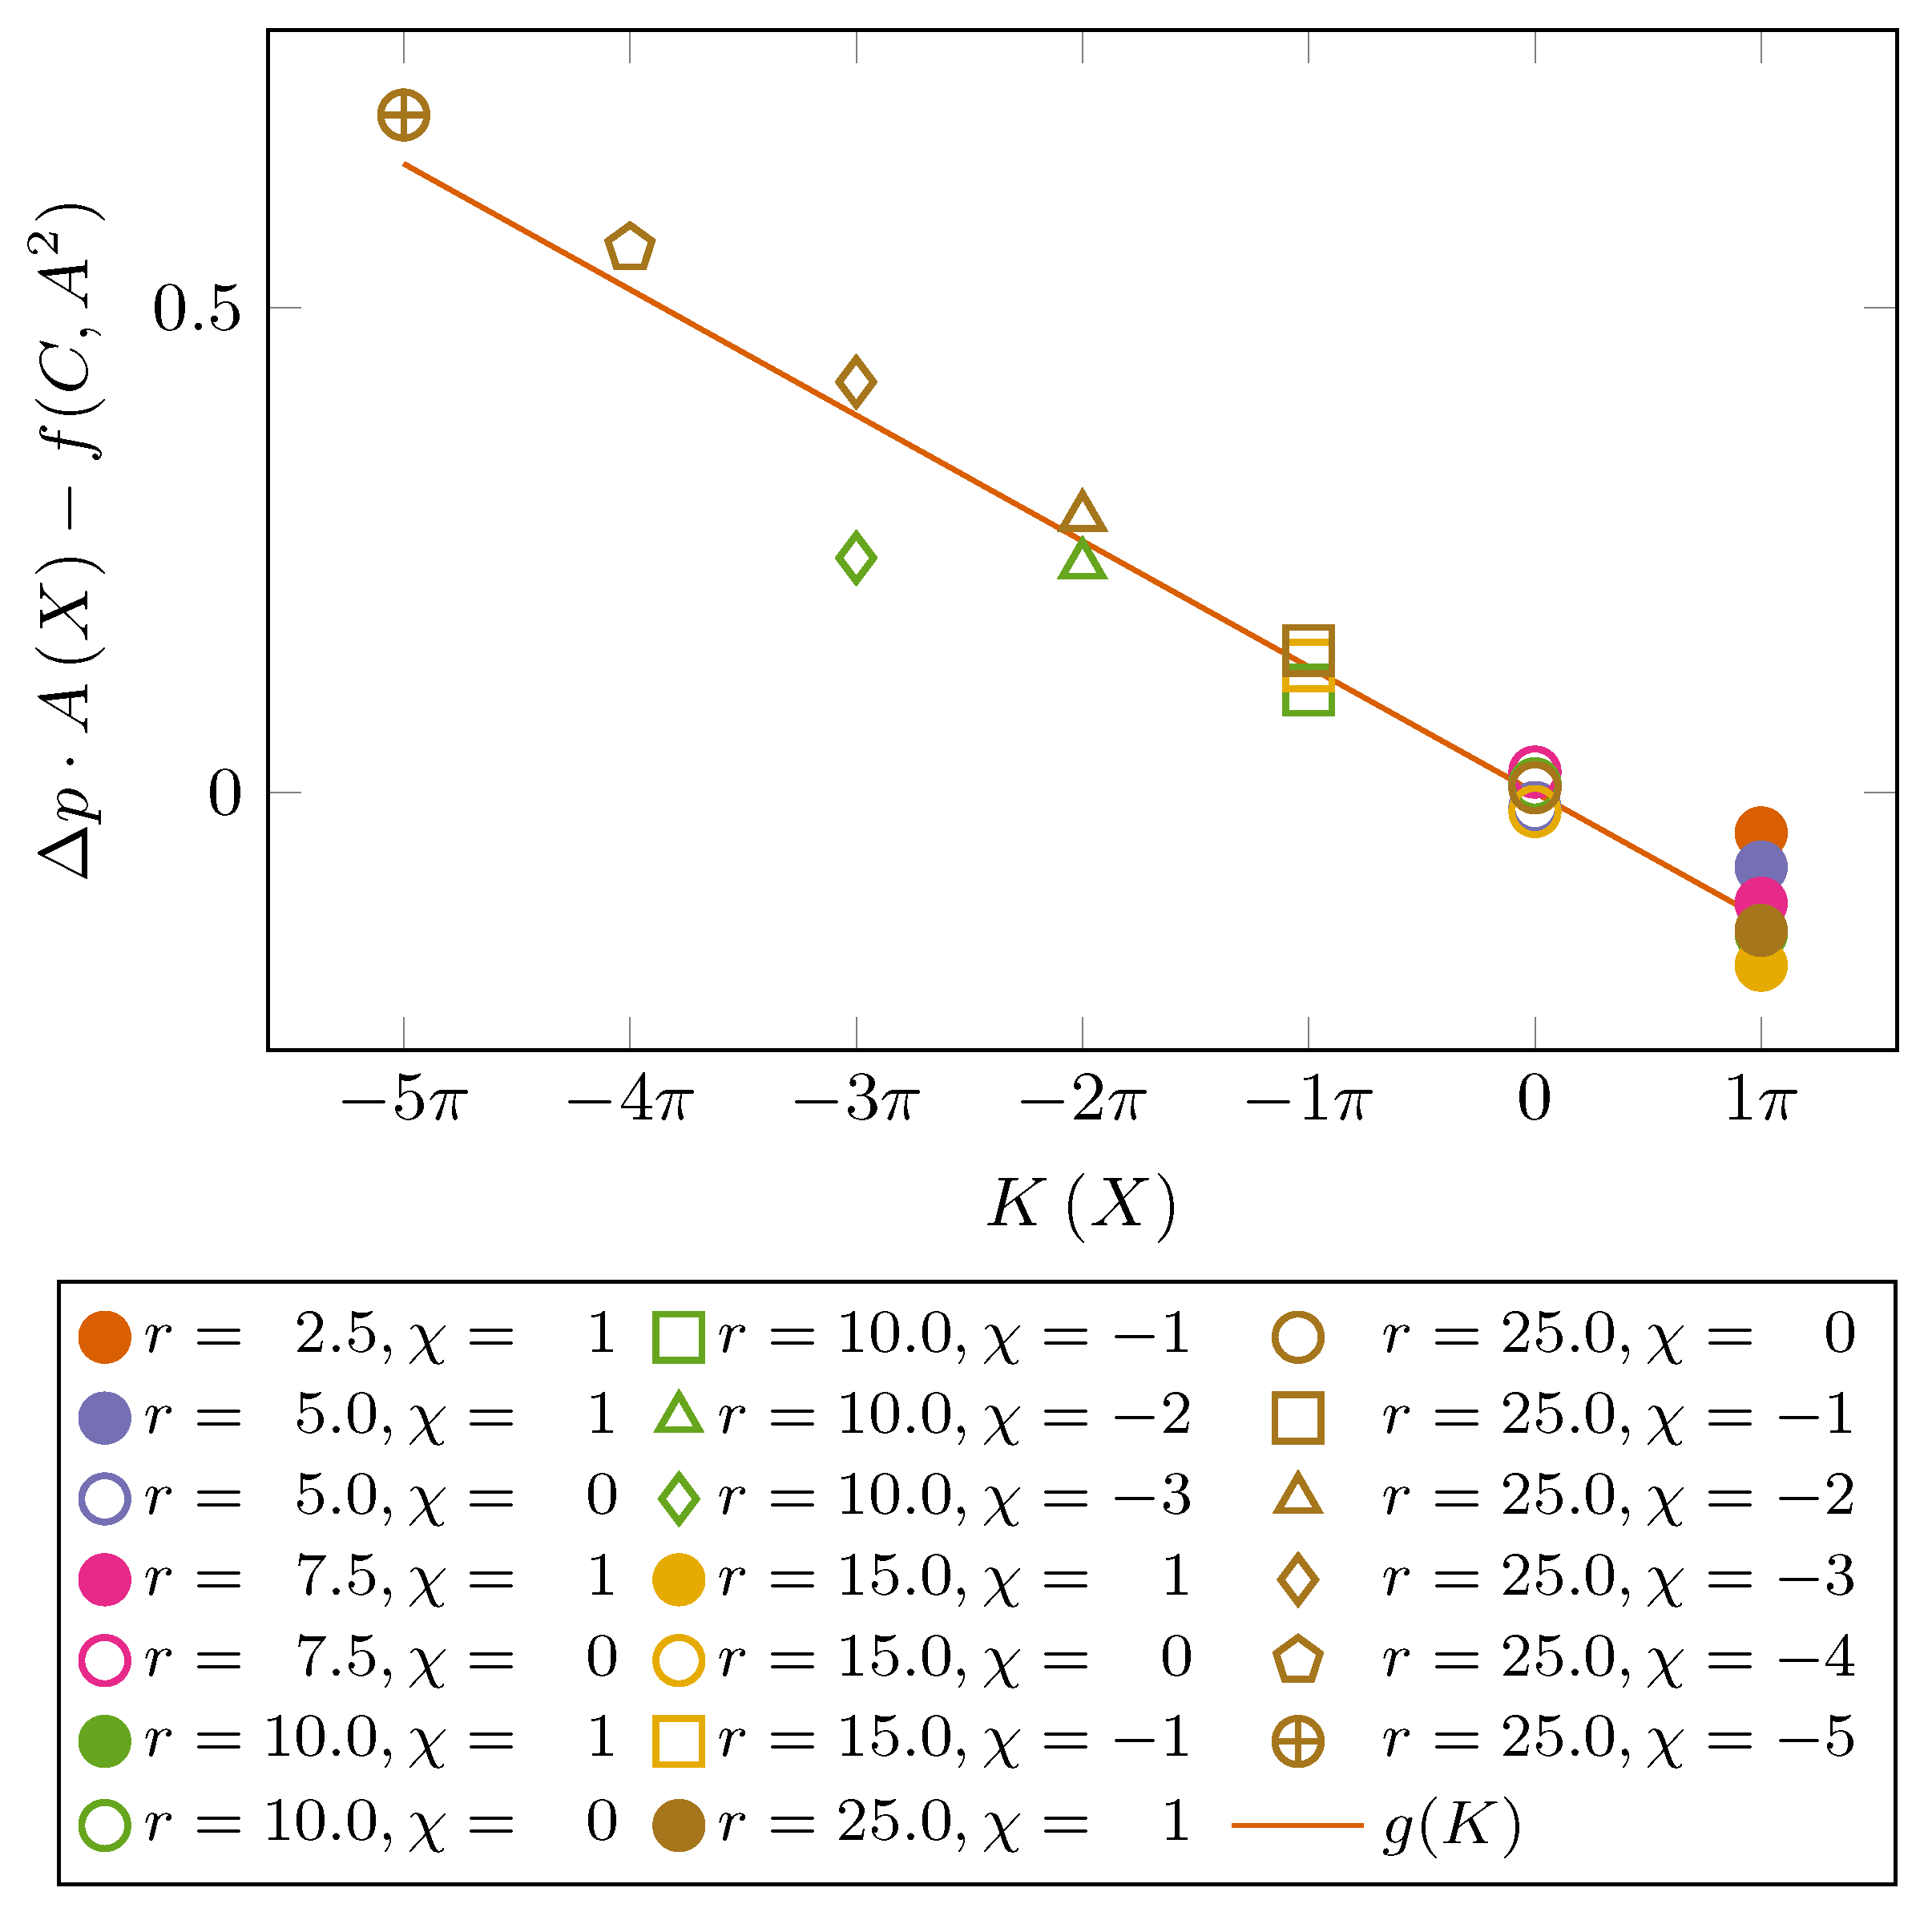
To find the value of and to validate the data fit shown in Figure 6, Figure 7 shows the pressure difference, , times the surface area Minkowski functional minus the function from Figure 6, , as a function of the Minkowski functional, . The graph shows a collapse of the data and, as predicted by theory, a linear fit with: , where . The collapse of the data into one single line, confirms that the pressure difference times the surface area Minkowski functional, , is proportional to , , and . The fitting parameters and show that the difference between the capillary condensation pressure and the bulk phase transition pressure is the most sensitive to changes in the pseudo surface tension, , and the pseudo pressure, . The sensitivity to topology changes, represented by the parameter , is much smaller. The outlier, (≈), , is a system where the topology change compared to, , caused an additional phase transition to occur.
Surprisingly, Figure 5 and Figure 7 show that the phase envelope shift dependence on topology is different depending on whether the phase transition is a discrete first-order or a continuous phase transition. In the case of gas adsorbing onto the pore wall, adding rods to the system decreases the pressure shift in the phase envelope. In the case of the discrete capillary condensation phase transition adding rods to a pore increases the pressure shift. What is behind this behavior and what happens when the discrete capillary condensation phase transition turns into a continuous phase transition at the critical pore radius is a topic for further research. In addition, the physical meaning of the pseudo pressure and the pseudo surface tension needs to be investigated further.
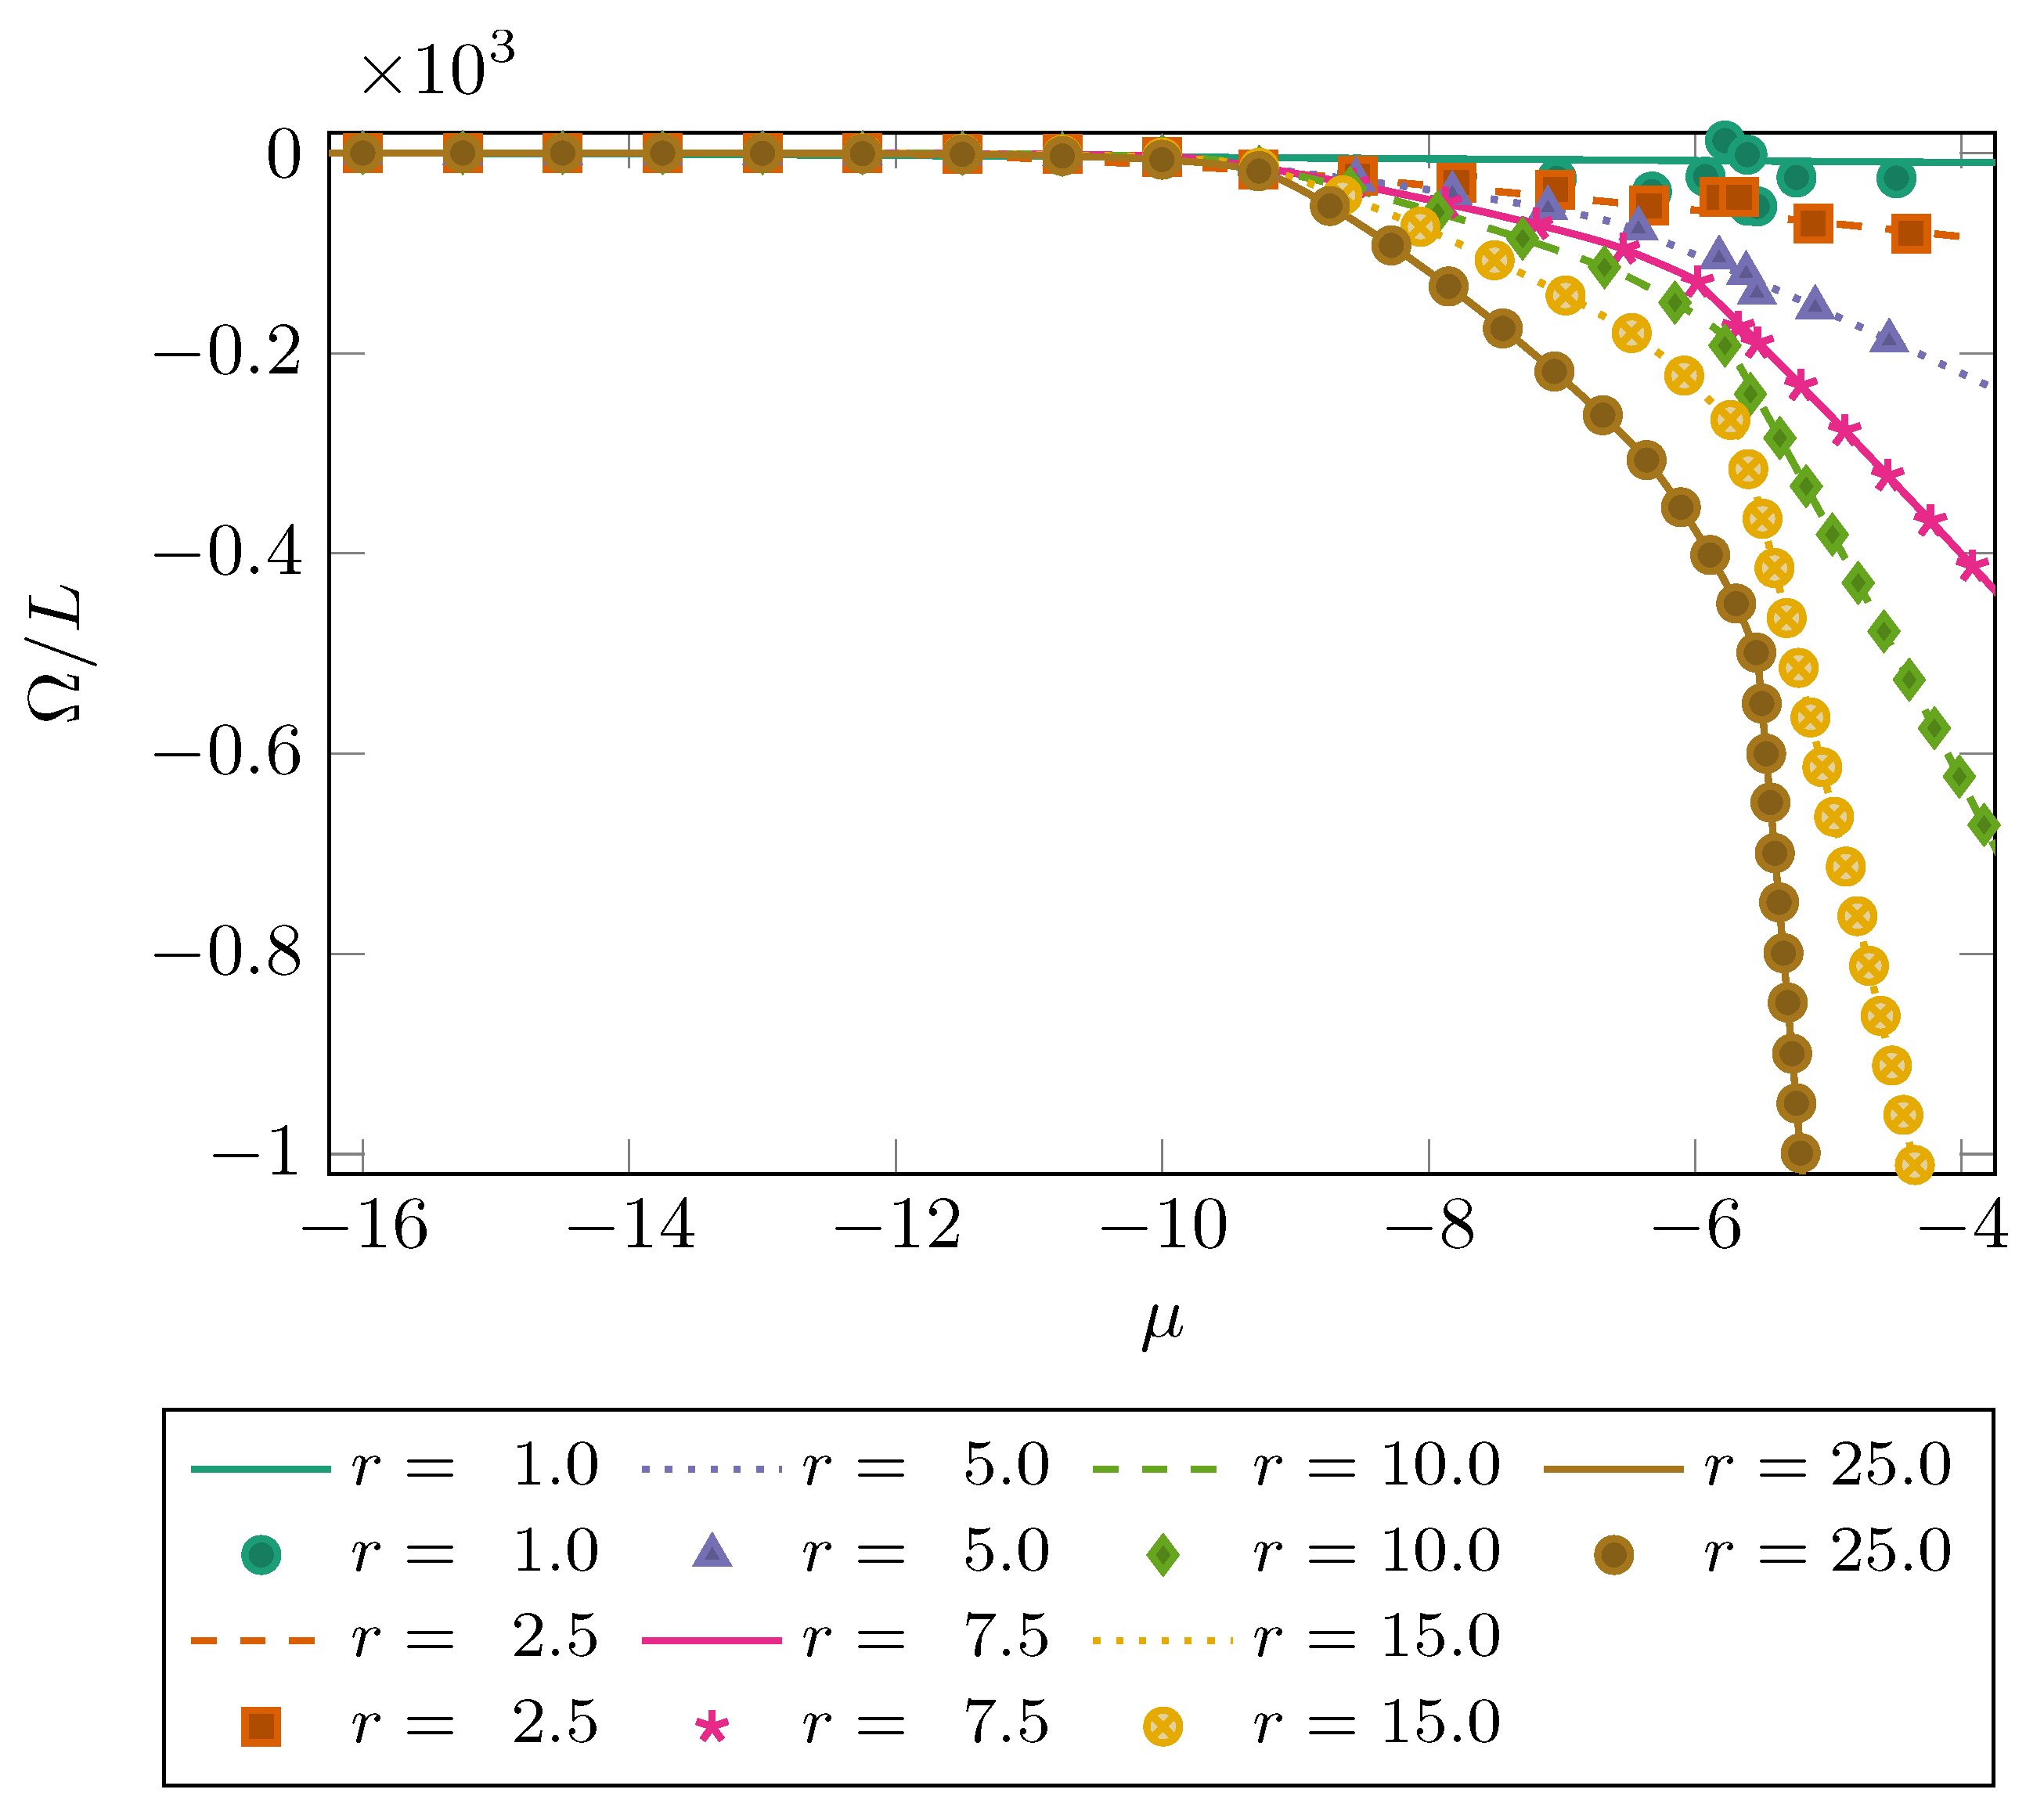
Like Figure 3, Figure 8 shows the dimensionless 2D grand potential, , as a function of the dimensionless chemical potential, . Only the simulation results with Euler characteristic, , are shown. The different lines show the results of the cDFT simulations while the symbols show the grand potential reconstructed from the Minkowski functionals and one set of Minkowski functional coefficients: pressure, , surface tension, , bending rigidity, , and the pseudo pressure and surface tension terms and . The terms and are added to the expansion of the grand potential based on the analysis of the phase behavior above. Both these terms are in effect circumference (surface) terms. While for a pore with Euler characteristic , , these two contributions diverge for . Adding the term to the expression for the grand potential significantly reduced the error in the Minkowski functional fit compared to only having a contribution from the circumference, .
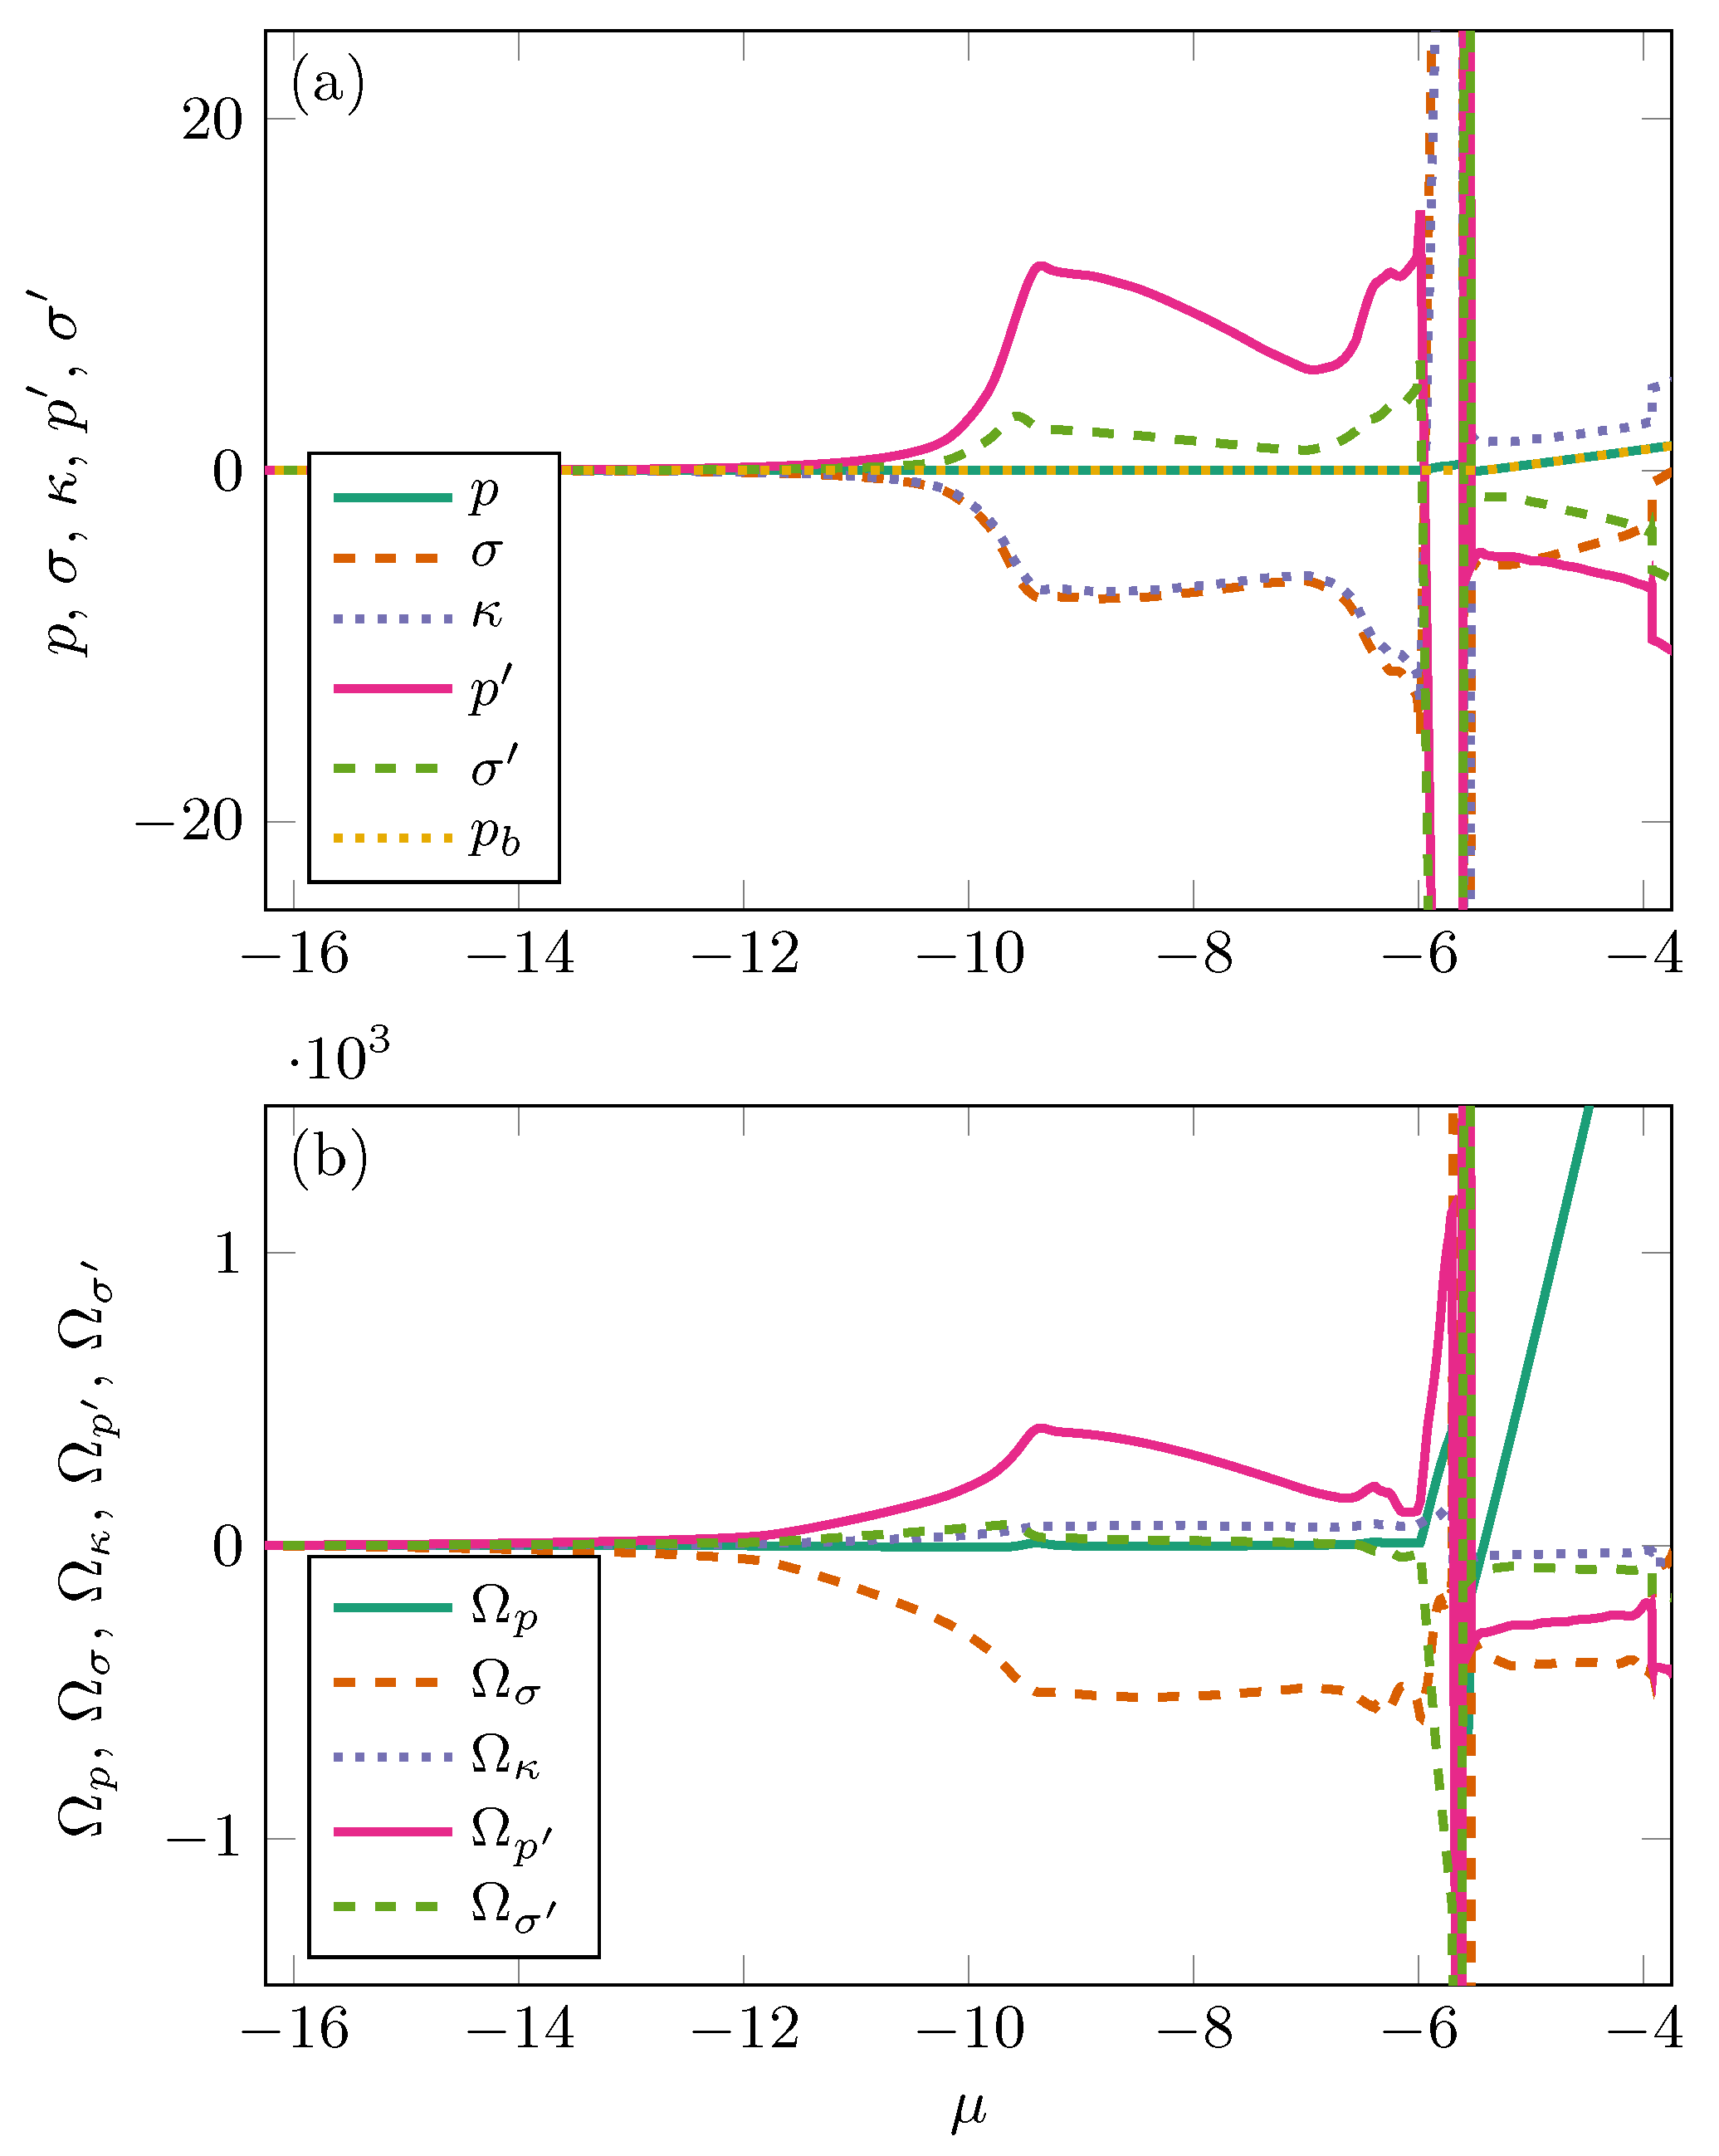
The corresponding dimensionless Minkowski functional coefficients as a function of the dimensionless chemical potential, , are shown in Figure 9a. It can be observed that the pressure coefficient is very similar to the bulk pressure, . All coefficients show a large peak around (≈) and the range of these peaks extends from about to 150. Before these peaks occur, the surface tension and bending rigidity terms show very similar behavior. To get a better understanding of the behavior of a Lennard-Jones fluid under confinement, one can analyze how much individual Minkowski functionals contribute to the grand potential. In Figure 9b, the value of the Minkowski functional coefficients times their corresponding Minkowski functionals is shown for a pore with radius, (≈), and an Euler characteristic of, . This analysis suggests that the adsorption of gas onto the pore wall is dominated by the surface tension and the pseudo pressure. When capillary condensation occurs, the surface tension and pseudo pressure contributions both become discontinuous and show large increases. Also, the contribution from the pseudo surface tension contribution becomes significant. After the bulk phase transition, the system becomes increasingly dominated by the pressure. The contribution from topology is the third largest, after the surface tension and the pseudo pressure.
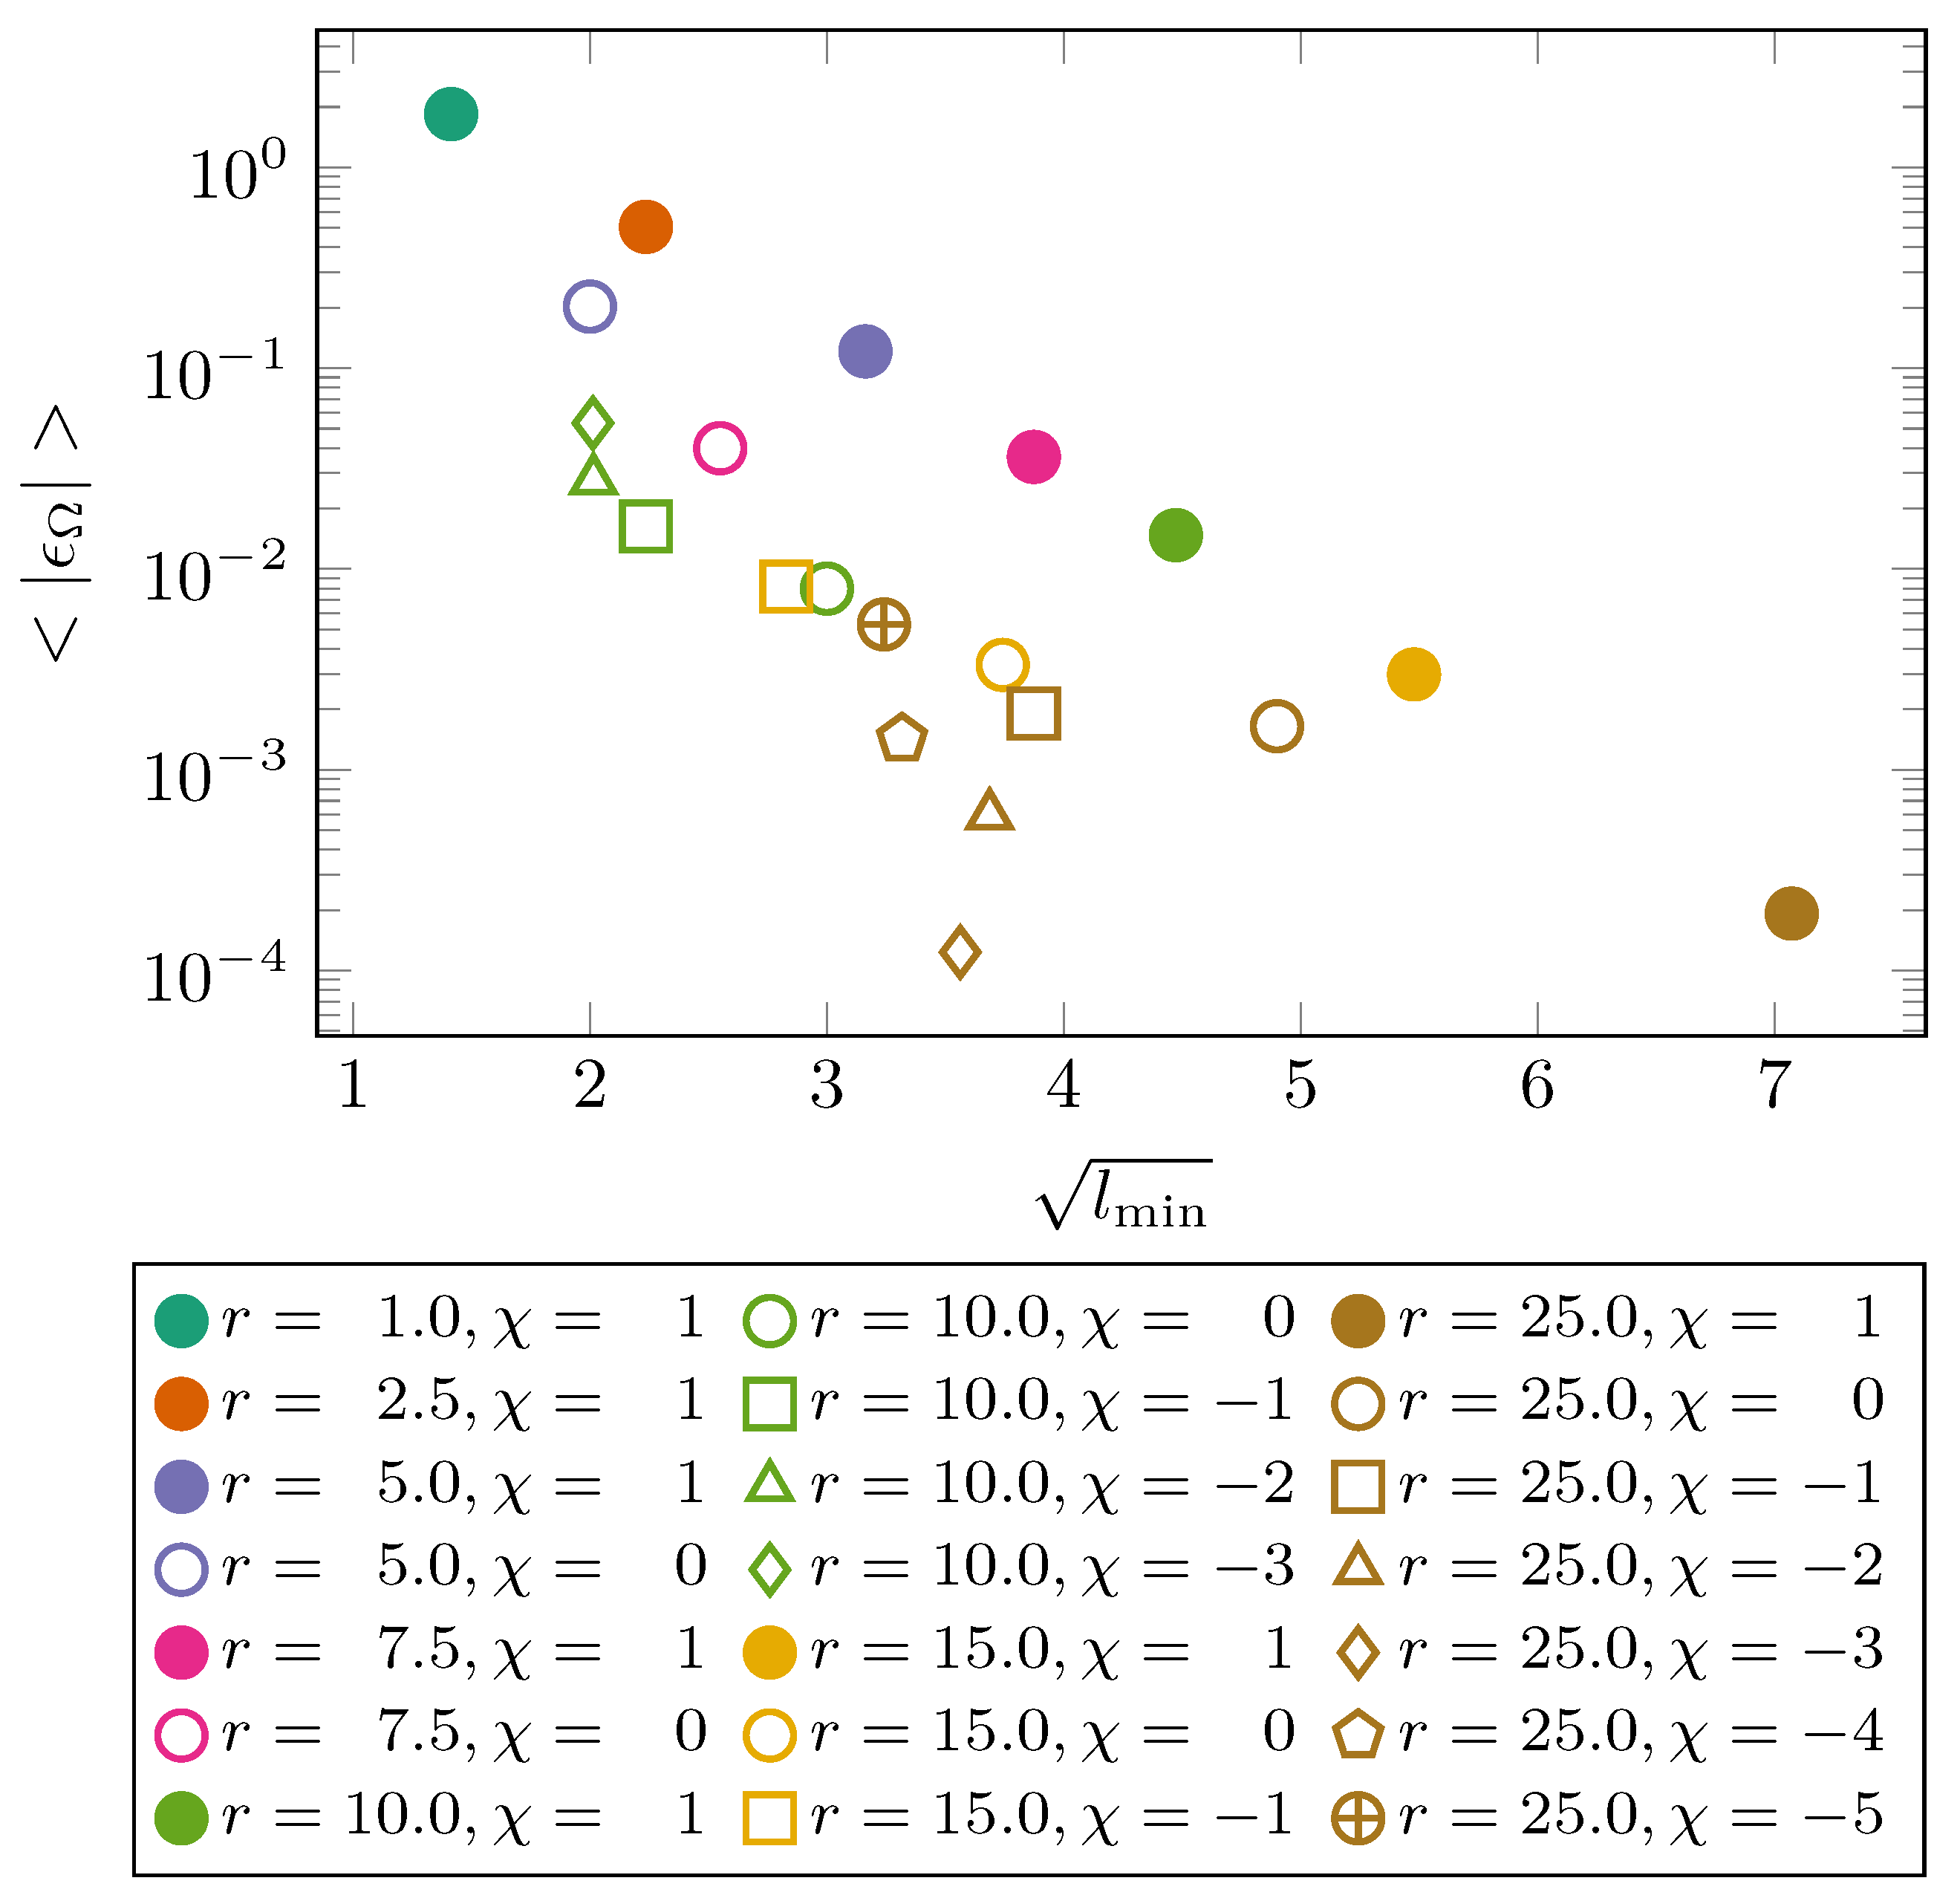
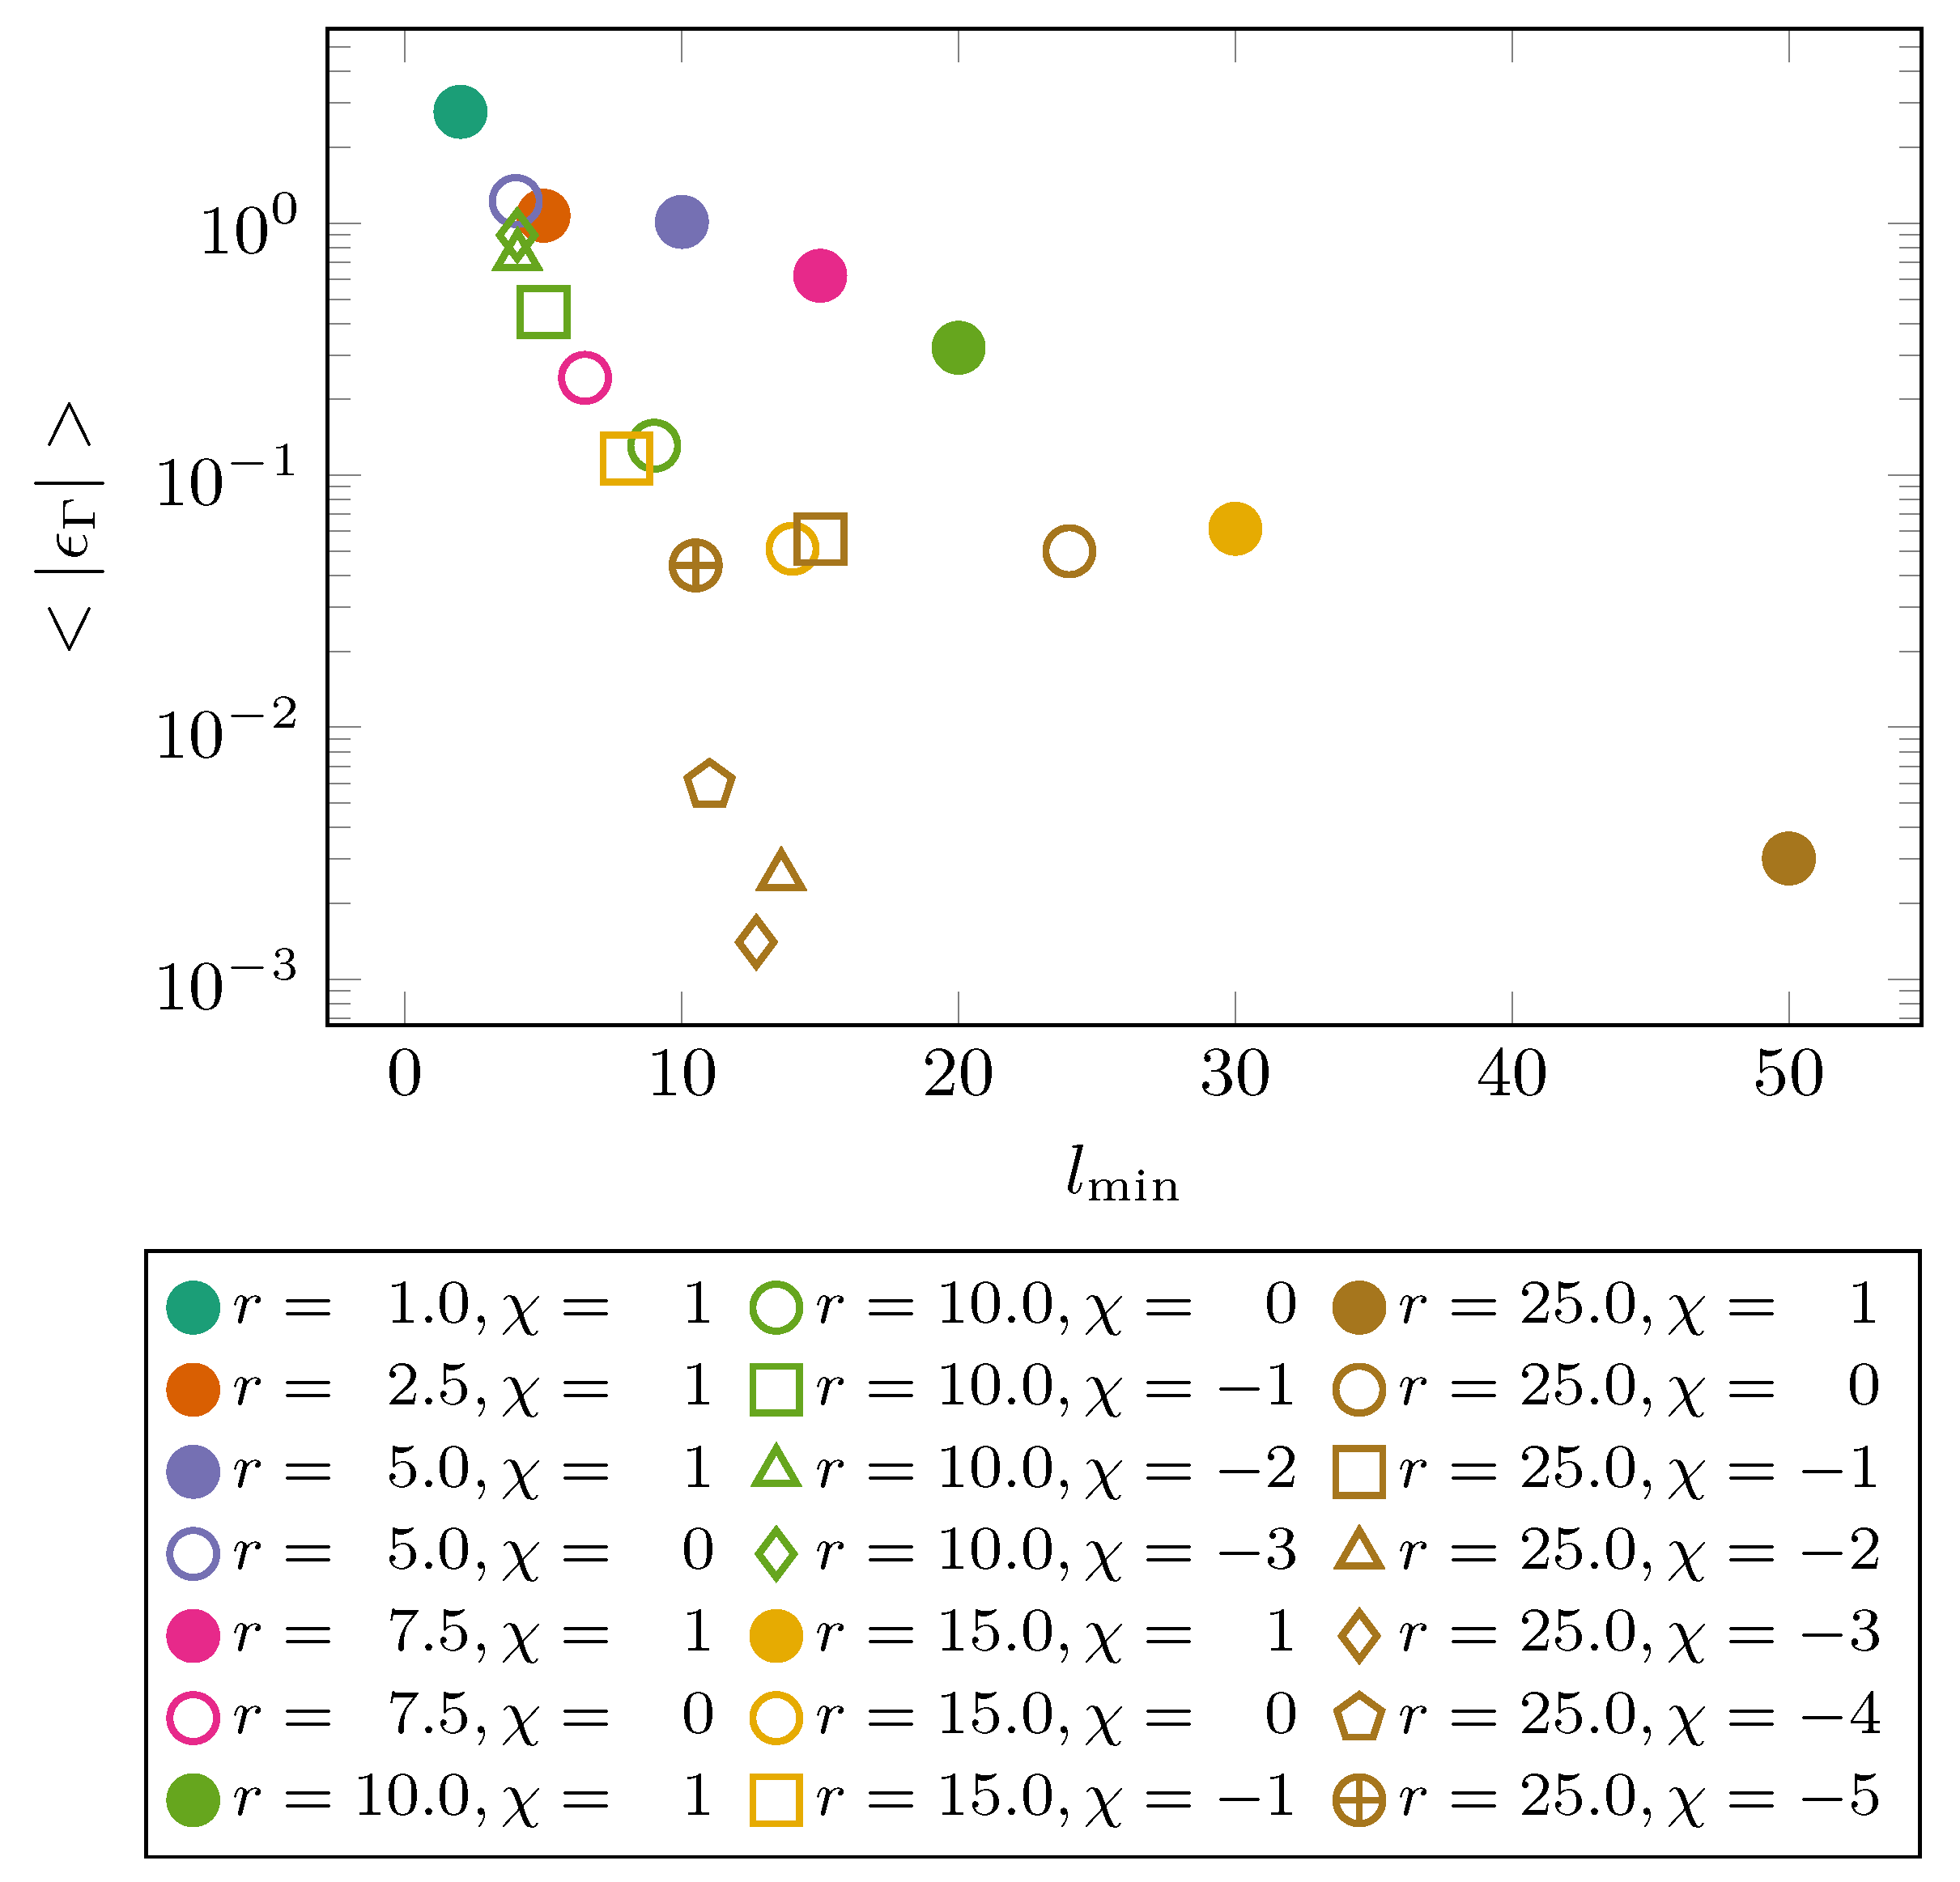
Figure 10 shows the average absolute relative error, , as a function of the square root of the minimal characteristic length scale of the system, . The average absolute relative error is defined as:
where is the grand potential computed using cDFT, and is the reconstruction of the grand potential using the Minkowski functionals. The error is averaged with respect to the chemical potential, . Due to the longer interaction length of the Lennard-Jones potential compared to the hard-sphere potential and the more complex phase behavior, the observed error is larger than the error reported in the literature where an error of is found when the system size becomes of the order of ≈ [31]. While the cut-off length of the interaction potential is equal to in the cDFT simulations the Lennard-Jones potential is almost zero at . One could therefore expect the error to be significantly less than at a system size of ≈, which is indeed the case. This might be in part due to the addition of the pseudo pressure and surface tension terms to the Minkowski functional expression for the grand potential. For pores without rods, it can be observed that scales almost linearly with . However, this scaling does not hold for pores with rods. Changing the topology of the system with rods does not have a large effect on the error, , especially for smaller pores. The fact that, as shown above, the topology has a smaller contribution to the grand potential than the various surface contributions could partly explain this observation. The figure confirms the observation in Figure 8 that for larger pores the fit of the Minkowski functional reconstruction of the grand potential is much better than for smaller pores.
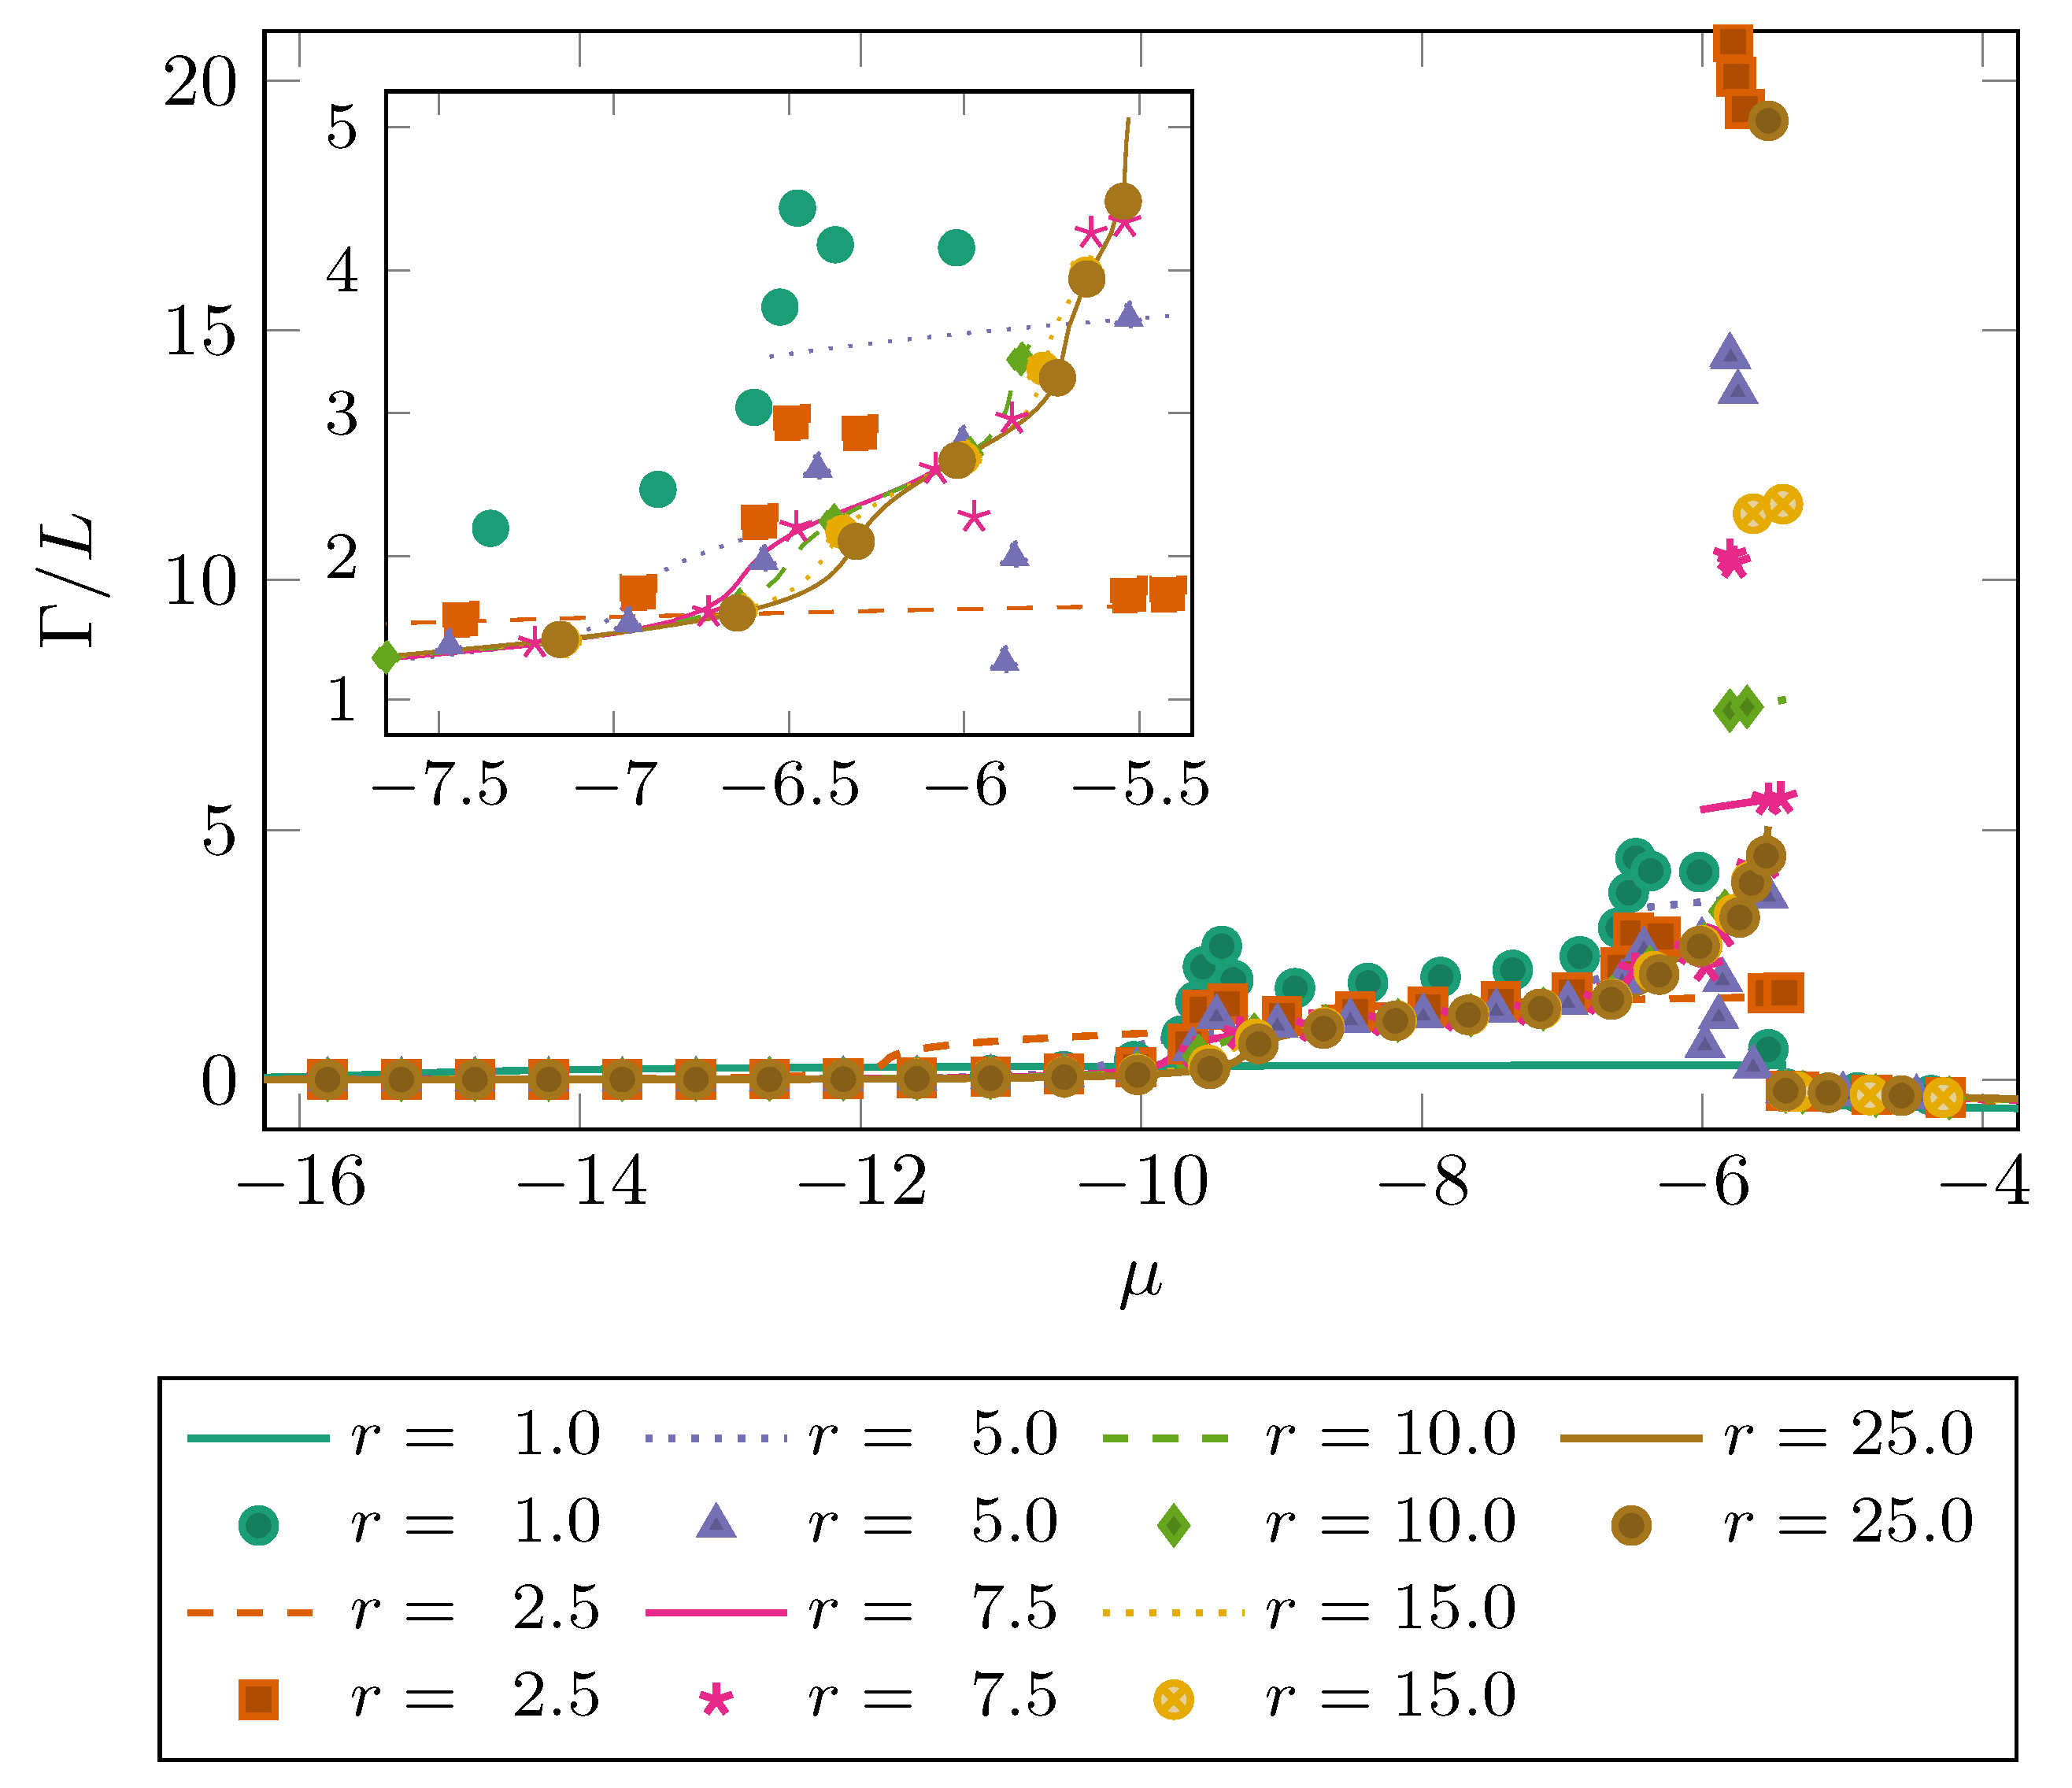
The dimensionless 2D excess adsorption, , as a function of the dimensionless chemical potential, , for a Lennard-Jones fluid is shown in Figure 11. Again, only the simulation results when are shown. The different lines show the results of the cDFT simulations while the symbols show the grand potential as reconstructed from the Minkowski functionals and one set of Minkowski functional coefficients: the derivatives of pressure, , surface tension, , bending rigidity, , and the pseudo pressure and surface tension terms and with respect to the chemical potential. As is the case for the grand potential in Figure 8, different regimes can be identified in Figure 11. For the pore size, (≈), the following regimes can be observed: (i) at low chemical potential the pores are completely empty, (ii) starting at about (≈), a continuous phase transition can be observed and gas starts adsorbing on the wall [46], (iii) at about capillary condensation can be observed, and iv) around (≈) the bulk phase transition occurs and the excess adsorption shows a significant drop. The inset shows that for larger pores there is a very good match between the cDFT computations and the Minkowski functional reconstructions. However, for the smallest pores, the match is quite poor and neither the film adsorption stage nor capillary condensation is captured well.
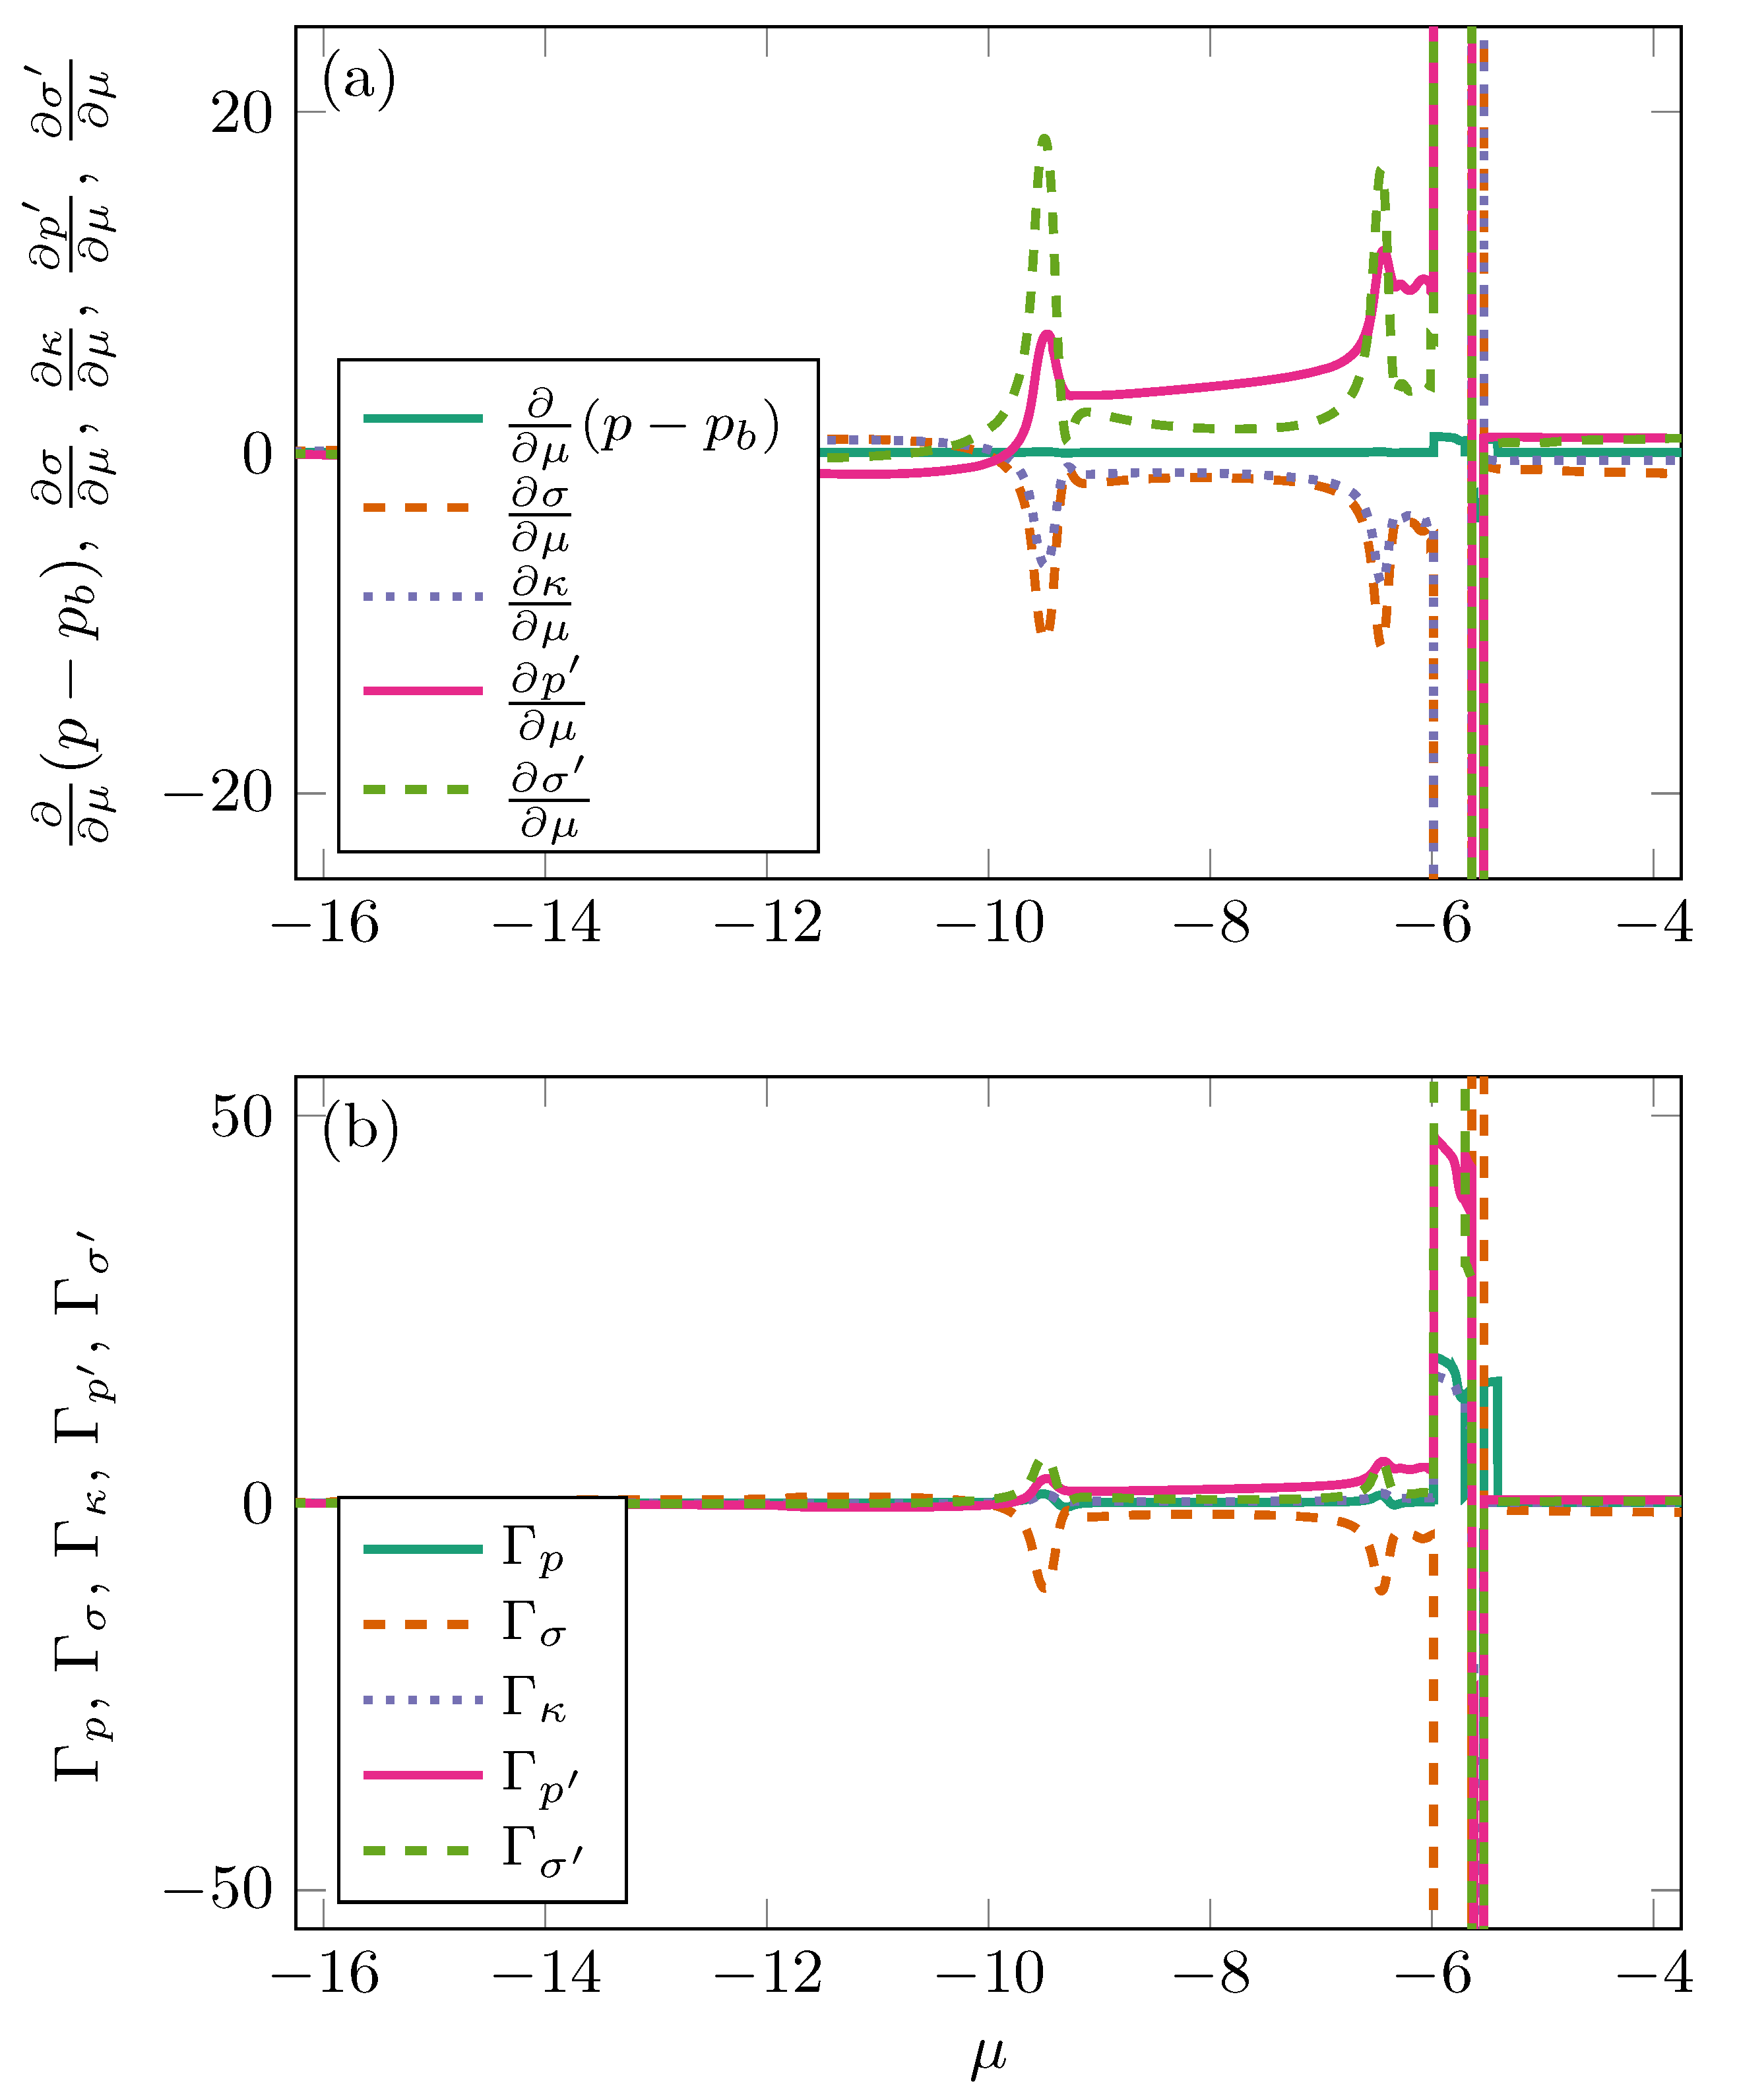
The derivatives of the Minkowski functional coefficient with respect to the chemical potential, , used to reconstruct the excess adsorption, can be observed in Figure 12a. This plot confirms that the pressure term is very similar to the bulk pressure. The peaks at about (≈) and (≈) are the locations of the continuous phase transitions associated with layers of gas molecules adsorbing onto the pore wall. To be able to analyze how the different terms contribute to the excess adsorption, in Figure 12b the value of the Minkowski functional coefficients times their corresponding Minkowski functionals is shown for a pore with radius (≈) and Euler characteristic of . Since these coefficients are derivatives of the coefficients used to reconstruct the grand potential, they can be both positive and negative. The amount of gas adsorbed onto the wall is dominated by the pseudo pressure and a negative contribution from the surface tension. The pseudo surface tension only contributes during the continuous phase transitions at about (≈) and (≈). Capillary condensation is characterized by a much larger contribution of the pseudo surface tension and many discontinuities in all the different terms to accommodate the discontinuity of a first-order phase transition. At this value of the Euler characteristic, topology does not seem to contribute significantly to the excess adsorption.
Figure 13 shows the average absolute relative error as a function of the minimal characteristic length scale of the system, . Because excess adsorption is a derivative of the grand potential, the observed error is larger than in Figure 10. For pores without rods, it can be observed that scales almost linearly with . Again, this scaling does not hold for pores with rods. This is similar to what was observed in Figure 10 which is probably at least partly caused by the limited contribution of topology to the excess adsorption.
5. Discussion & Conclusions
The effect of morphology and topology on capillary condensation is studied in a systematic manner using a Minkowski functional framework. Compared to a hard-sphere fluid, a Lennard-Jones fluid has a much longer interaction length and phase behavior becomes much more complex. This results in larger errors in both the grand potential and the excess adsorption, which can be partly overcome by introducing additional terms in the expansion of the grand potential. Analyzing the contributions of the various Minkowski functional coefficients to the grand potential shows that wall adsorption is dominated by a surface-tension and a pseudo-pressure term, which is proportional to . During capillary condensation, a pseudo surface tension term proportional to also gains in importance and this regime is characterized by large discontinuities in the coefficients which match the discontinuities caused by capillary condensation. A similar analysis of the coefficients contributing to the excess adsorption shows the pseudo pressure as a positively contributing term to the wall adsorption and the surface tension as a negatively contributing term. During capillary condensation, the pseudo surface tension term becomes significantly more important. For both the grand potential and the excess adsorption the effect of topology is modest.
Last but not least, the effect of confinement on phase behavior is investigated. It is found that pressure shift in the continuous phase transition describing adsorption on the pore wall is proportional to and , which is close to what is predicted based on Hadwiger’s theorem. However, the pressure for the discrete first-order phase transition describing capillary condensation is proportional to , and , which is a deviation from theory. In addition, the discrete first-order phase transition and the continuous phase transition have the opposite dependence on topology. In the case of gas adsorbing onto the pore wall, adding rods to the system decreases the pressure shift in the phase envelope. In the case of the discrete capillary condensation phase transition adding rods to a pore increases the pressure shift. Whether this is a finding which holds in general for continuous and discrete phase transitions has to be investigated further.
The Minkowski functionals provide a useful framework to study capillary condensation. The separation of geometry and thermodynamics allows for a method to systematically study the effect of surface area, circumference, and the Euler characteristic on phase behavior. This provides many opportunities for future research. One of the many open questions is whether the different effect that topology has on continuous versus discrete phase transitions is also found for Lennard-Jones fluids in 3D instead of 2D systems, or even for phase transitions in general. Another question is whether it is possible to use the Minkowski functionals for upscaling. The usage of higher order terms breaks the additivity assumption. However, it might be possible to overcome this limitation by using the Minkowski functions, the Minkowski functionals as a function of a threshold value, e.g., the pore size [29]. The idea is to perform a number of simulations on different small geometries with known Minkowski functions and to compute the Minkowski function coefficients for the excess adsorption. These coefficients are then used to predict the excess adsorption for a much larger experimental disordered porous medium with known Minkowski functions. Other questions that remain to be answered are whether sorption hysteresis can be described using the Minkowski functionals [65], and to study whether the Minkowski functionals can be used for higher molecular weight molecules.
Author Contributions
Conceptualization, A.M.P.B. and H.A.T.; Data curation, A.M.P.B.; Formal analysis, A.M.P.B.; Funding acquisition, H.A.T.; Investigation, A.M.P.B.; Methodology, A.M.P.B.; Project administration, A.M.P.B. and H.A.T.; Resources, H.A.T.; Software, A.M.P.B.; Validation, A.M.P.B. and H.A.T.; Visualization, A.M.P.B.; Writing—original draft, A.M.P.B.; Writing—review & editing, A.M.P.B. and H.A.T. Both authors have read and agreed to the published version of the manuscript.
Funding
This work was supported as part of the Center for Mechanistic Control of Water-Hydrocarbon-Rock Interactions in Unconventional and Tight Oil Formations (CMC-UF), an Energy Frontier Research Center funded by the U.S. Department of Energy, Office of Science under DOE (BES) Award DE-SC0019165.
Acknowledgments
The majority of the computing for this project was performed on the Mazama cluster of the Center for Computational Earth & Environmental Science (CEES) at Stanford University. The authors thank Stanford University and the Stanford Research Computing Center for providing computational resources and support that contributed to these research results. Lastly, the authors thank Steffen Berg, Martin Blunt, Jian Qin and Filip Simeski for many stimulating discussions and feedback.
Conflicts of Interest
The authors declare no conflict of interest. The funders had no role in the design of the study; in the collection, analyses, or interpretation of data; in the writing of the manuscript, or in the decision to publish the results.
References
- Berube, V.; Radtke, G.; Dresselhaus, M.; Chen, G. Size effects on the hydrogen storage properties of nanostructured metal hydrides: A review. Int. J. Energy Res. 2007, 31, 637–663. [Google Scholar] [CrossRef]
- He, L.; Melnichenko, Y.B.; Gallego, N.C.; Contescu, C.I.; Guo, J.; Bahadur, J. Investigation of morphology and hydrogen adsorption capacity of disordered carbons. Carbon 2014, 80, 82–90. [Google Scholar] [CrossRef] [Green Version]
- He, T.; Pachfule, P.; Wu, H.; Xu, Q.; Chen, P. Hydrogen carriers. Nat. Rev. Mater. 2016, 1, 16059. [Google Scholar] [CrossRef]
- Li, M.; Carter, R.; Douglas, A.; Oakes, L.; Pint, C.L. Sulfur vapor-infiltrated 3D carbon nanotube foam for binder-free high areal capacity lithium–sulfur battery composite cathodes. ACS Nano 2017, 11, 4877–4884. [Google Scholar] [CrossRef]
- Barsotti, E.; Tan, S.P.; Saraji, S.; Piri, M.; Chen, J.H. A review on capillary condensation in nanoporous media: Implications for hydrocarbon recovery from tight reservoirs. Fuel 2016, 184, 344–361. [Google Scholar] [CrossRef]
- Belmabkhout, Y.; Serna-Guerrero, R.; Sayari, A. Adsorption of CO2 from dry gases on MCM-41 silica at ambient temperature and high pressure. 1: Pure CO2 adsorption. Chem. Eng. Sci. 2009, 64, 3721–3728. [Google Scholar] [CrossRef]
- Yoshimoto, Y.; Hori, T.; Kinefuchi, I.; Takagi, S. Effect of capillary condensation on gas transport properties in porous media. Phys. Rev. E 2017, 96, 043112. [Google Scholar] [CrossRef] [PubMed]
- Vincent, O.; Marguet, B.; Stroock, A.D. Imbibition triggered by capillary condensation in nanopores. Langmuir 2017, 33, 1655–1661. [Google Scholar] [CrossRef] [PubMed] [Green Version]
- Bui, B.T.; Liu, H.H.; Chen, J.; Tutuncu, A.N. Effect of capillary condensation on gas transport in shale: A pore-scale model study. SPE J. 2016, 21, 601–612. [Google Scholar] [CrossRef]
- Melnichenko, Y.B. Supercritical Fluids in Confined Geometries. In Small-Angle Scattering from Confined and Interfacial Fluids; Springer: Berlin/Heidelberg, Germany; New York, NY, USA, 2016; pp. 251–309. [Google Scholar] [CrossRef]
- Ghosh, K.; Krishnamurthy, C. Structural behavior of supercritical fluids under confinement. Phys. Rev. E 2018, 97, 012131. [Google Scholar] [CrossRef] [PubMed] [Green Version]
- Barrett, E.P.; Joyner, L.G.; Halenda, P.P. The determination of pore volume and area distributions in porous substances. I. Computations from nitrogen isotherms. J. Am. Chem. Soc. 1951, 73, 373–380. [Google Scholar] [CrossRef]
- Douglas Frink, L.J.; Salinger, A.G. Rapid analysis of phase behavior with density functional theory. II. Capillary condensation in disordered porous media. J. Chem. Phys. 2003, 118, 7466–7476. [Google Scholar] [CrossRef]
- Coasne, B.; Galarneau, A.; Di Renzo, F.; Pellenq, R.J. Effect of morphological defects on gas adsorption in nanoporous silicas. J. Phys. Chem. C 2007, 111, 15759–15770. [Google Scholar] [CrossRef]
- Mason, G. The effect of pore space connectivity on the hysteresis of capillary condensation in adsorption—Desorption isotherms. J. Colloid Interface Sci. 1982, 88, 36–46. [Google Scholar] [CrossRef]
- Mason, G. Determination of the pore-size distributions and pore-space interconnectivity of Vycor porous glass from adsorption-desorption hysteresis capillary condensation isotherms. Proc. R. Soc. Lond. A Math. Phys. Sci. 1988, 415, 453–486. [Google Scholar] [CrossRef]
- Sarkisov, L.; Monson, P. Modeling of adsorption and desorption in pores of simple geometry using molecular dynamics. Langmuir 2001, 17, 7600–7604. [Google Scholar] [CrossRef]
- Libby, B.; Monson, P. Adsorption/desorption hysteresis in inkbottle pores: A density functional theory and Monte Carlo simulation study. Langmuir 2004, 20, 4289–4294. [Google Scholar] [CrossRef]
- Coasne, B.; Galarneau, A.; Pellenq, R.J.; Di Renzo, F. Adsorption, intrusion and freezing in porous silica: The view from the nanoscale. Chem. Soc. Rev. 2013, 42, 4141–4171. [Google Scholar] [CrossRef] [PubMed]
- Mecke, K.R. Integral geometry in statistical physics. Int. J. Mod. Phys. B 1998, 12, 861–899. [Google Scholar] [CrossRef]
- Bañados, M.; Teitelboim, C.; Zanelli, J. Black hole entropy and the dimensional continuation of the Gauss-Bonnet theorem. Phys. Rev. Lett. 1994, 72, 957. [Google Scholar] [CrossRef] [PubMed] [Green Version]
- Schmalzing, J.; Górski, K.M. Minkowski functionals used in the morphological analysis of cosmic microwave background anisotropy maps. Mon. Not. R. Astron. Soc. 1998, 297, 355–365. [Google Scholar] [CrossRef] [Green Version]
- Mecke, K.; Wagner, H. Euler characteristic and related measures for random geometric sets. J. Stat. Phys. 1991, 64, 843–850. [Google Scholar] [CrossRef]
- Mecke, K.R.; Sofonea, V. Morphology of spinodal decomposition. Phys. Rev. E 1997, 56, R3761. [Google Scholar] [CrossRef] [Green Version]
- Scheel, M.; Seemann, R.; Brinkmann, M.; Di Michiel, M.; Sheppard, A.; Breidenbach, B.; Herminghaus, S. Morphological clues to wet granular pile stability. Nat. Mater. 2008, 7, 189. [Google Scholar] [CrossRef]
- Saadatfar, M.; Takeuchi, H.; Robins, V.; Francois, N.; Hiraoka, Y. Pore configuration landscape of granular crystallization. Nat. Commun. 2017, 8, 15082. [Google Scholar] [CrossRef]
- Vogel, H.J. Topological characterization of porous media. In Morphology of Condensed Matter; Springer: Berlin/Heidelberg, Germany, 2002; pp. 75–92. [Google Scholar] [CrossRef]
- Schlüter, S.; Berg, S.; Rücker, M.; Armstrong, R.; Vogel, H.J.; Hilfer, R.; Wildenschild, D. Pore-scale displacement mechanisms as a source of hysteresis for two-phase flow in porous media. Water Resour. Res. 2016, 52, 2194–2205. [Google Scholar] [CrossRef] [Green Version]
- Mecke, K.R. Additivity, convexity, and beyond: Applications of Minkowski Functionals in statistical physics. In Statistical Physics and Spatial Statistics; Springer: Berlin/Heidelberg, Germany; New York, NY, USA, 2000; pp. 111–184. [Google Scholar] [CrossRef]
- Hadwiger, H. Vorlesungen über Inhalt, Oberfläche und Isoperimetrie; Springer: Berlin, Germany, 1957; Volume 93. [Google Scholar] [CrossRef]
- König, P.M.; Roth, R.; Mecke, K. Morphological thermodynamics of fluids: Shape dependence of free energies. Phys. Rev. Lett. 2004, 93, 160601. [Google Scholar] [CrossRef] [PubMed] [Green Version]
- Simeski, F.; Boelens, A.M.; Ihme, M. Modeling Adsorption in Silica Pores via Minkowski Functionals and Molecular Electrostatic Moments. Energies 2020, 13, 5976. [Google Scholar] [CrossRef]
- Evans, R. The nature of the liquid-vapour interface and other topics in the statistical mechanics of non-uniform, classical fluids. Adv. Phys. 1979, 28, 143–200. [Google Scholar] [CrossRef]
- Kierlik, E.; Monson, P.; Rosinberg, M.; Tarjus, G. Adsorption hysteresis and capillary condensation in disordered porous solids: A density functional study. J. Phys. Condens. Matter 2002, 14, 9295. [Google Scholar] [CrossRef]
- Ustinov, E.; Do, D.; Jaroniec, M. Adsorption of argon and nitrogen in cylindrical pores of MCM-41 materials: Application of density functional theory. Appl. Surf. Sci. 2005, 252, 1013–1028. [Google Scholar] [CrossRef]
- Neimark, A.V.; Lin, Y.; Ravikovitch, P.I.; Thommes, M. Quenched solid density functional theory and pore size analysis of micro-mesoporous carbons. Carbon 2009, 47, 1617–1628. [Google Scholar] [CrossRef]
- Yatsyshin, P.; Durán-Olivencia, M.; Kalliadasis, S. Microscopic aspects of wetting using classical density functional theory. J. Phys. Condens. Matter 2018, 30, 274003. [Google Scholar] [CrossRef] [Green Version]
- Minkowski, H. Volumen und Oberfläche. Math. Ann. 1903, 57, 447–495. [Google Scholar] [CrossRef] [Green Version]
- Schneider, R. Convex Bodies: The Brunn–Minkowski Theory; Cambridge University Press: Cambridge, UK, 2013; Volume 151. [Google Scholar] [CrossRef]
- Legland, D.; Kiêu, K.; Devaux, M.F. Computation of Minkowski measures on 2D and 3D binary images. Image Anal. Stereol. 2011, 26, 83–92. [Google Scholar] [CrossRef] [Green Version]
- Kierlik, E.; Monson, P.; Rosinberg, M.; Sarkisov, L.; Tarjus, G. Capillary condensation in disordered porous materials: Hysteresis versus equilibrium behavior. Phys. Rev. Lett. 2001, 87, 055701. [Google Scholar] [CrossRef] [Green Version]
- Ravikovitch, P.I.; Neimark, A.V. Density functional theory model of adsorption on amorphous and microporous silica materials. Langmuir 2006, 22, 11171–11179. [Google Scholar] [CrossRef]
- Mecke, K.; Arns, C. Fluids in porous media: A morphometric approach. J. Phys. Condens. Matter 2005, 17, S503. [Google Scholar] [CrossRef]
- Salinger, A.G.; Douglas Frink, L.J. Rapid analysis of phase behavior with density functional theory. I. Novel numerical methods. J. Chem. Phys. 2003, 118, 7457–7465. [Google Scholar] [CrossRef]
- Evans, R.; Marini Bettolo Marconi, U. Phase equilibria and solvation forces for fluids confined between parallel walls. J. Chem. Phys. 1987, 86, 7138–7148. [Google Scholar] [CrossRef]
- Evans, R. Fluids adsorbed in narrow pores: Phase equilibria and structure. J. Phys. Condens. Matter 1990, 2, 8989. [Google Scholar] [CrossRef]
- Hohenberg, P.; Kohn, W. Inhomogeneous electron gas. Phys. Rev. 1964, 136, B864. [Google Scholar] [CrossRef] [Green Version]
- Heroux, M.A.; Salinger, A.G.; Frink, L.J. Parallel segregated Schur complement methods for fluid density functional theories. SIAM J. Sci. Comput. 2007, 29, 2059–2077. [Google Scholar] [CrossRef] [Green Version]
- Frink, L.J.D.; Salinger, A.G. Two-and three-dimensional nonlocal density functional theory for inhomogeneous fluids: I. Algorithms and parallelization. J. Comput. Phys. 2000, 159, 407–424. [Google Scholar] [CrossRef]
- Frink, L.J.D.; Salinger, A.G. Two-and three-dimensional nonlocal density functional theory for inhomogeneous fluids: II. Solvated polymers as a benchmark problem. J. Comput. Phys. 2000, 159, 425–439. [Google Scholar] [CrossRef]
- Weeks, J.D.; Chandler, D.; Andersen, H.C. Role of repulsive forces in determining the equilibrium structure of simple liquids. J. Chem. Phys. 1971, 54, 5237–5247. [Google Scholar] [CrossRef]
- Hansen-Goos, H.; Roth, R. Density functional theory for hard-sphere mixtures: The White Bear version mark II. J. Phys. Condens. Matter 2006, 18, 8413. [Google Scholar] [CrossRef]
- Keller, H.B. Numerical solution of bifurcation and nonlinear eigenvalue problems. In Applications of Bifurcation Theory; Rabinowitz, P., Ed.; Academic Press: New York, NY, USA, 1977; pp. 359–384. [Google Scholar]
- Salinger, A.G.; Bou-Rabee, N.M.; Pawlowski, R.P.; Wilkes, E.D.; Burroughs, E.A.; Lehoucq, R.B.; Romero, L.A. LOCA 1.0 Library of Continuation Algorithms: Theory and Implementation Manual; SAND2002-0396; Sandia National Laboratories: Albuquerque, NM, USA, 2002.
- Mecke, K.R.; Stoyan, D. Morphology of Condensed Matter: Physics and Geometry of Spatially Complex Systems; Lecture Notes in Physics; Springer: Berlin/Heidelberg, Germany; New York, NY, USA, 2008; Volume 600. [Google Scholar] [CrossRef]
- Scholz, C.; Wirner, F.; Götz, J.; Rüde, U.; Schröder-Turk, G.E.; Mecke, K.; Bechinger, C. Permeability of porous materials determined from the Euler characteristic. Phys. Rev. Lett. 2012, 109, 264504. [Google Scholar] [CrossRef] [Green Version]
- Brewer, D.; Champeney, D. Sorption of helium and nitrogen on Vycor porous glass. Proc. Phys. Soc. 1962, 79, 855. [Google Scholar] [CrossRef]
- Levitz, P.; Ehret, G.; Sinha, S.; Drake, J. Porous Vycor glass: The microstructure as probed by electron microscopy, direct energy transfer, small-angle scattering, and molecular adsorption. J. Chem. Phys. 1991, 95, 6151–6161. [Google Scholar] [CrossRef]
- Boher, C.; Martin, I.; Lorente, S.; Frizon, F. Experimental investigation of gas diffusion through monomodal materials. Application to geopolymers and Vycor® glasses. Microporous Mesoporous Mater. 2014, 184, 28–36. [Google Scholar] [CrossRef]
- Ravikovitch, P.I.; Haller, G.L.; Neimark, A.V. Density functional theory model for calculating pore size distributions: Pore structure of nanoporous catalysts. Adv. Colloid Interface Sci. 1998, 76, 203–226. [Google Scholar] [CrossRef]
- Gelb, L.D.; Gubbins, K. Characterization of porous glasses: Simulation models, adsorption isotherms, and the Brunauer-Emmett-Teller analysis method. Langmuir 1998, 14, 2097–2111. [Google Scholar] [CrossRef]
- Jaroniec, M.; Kruk, M.; Olivier, J.P. Standard nitrogen adsorption data for characterization of nanoporous silicas. Langmuir 1999, 15, 5410–5413. [Google Scholar] [CrossRef]
- Hamada, Y.; Koga, K.; Tanaka, H. Phase equilibria and interfacial tension of fluids confined in narrow pores. J. Chem. Phys. 2007, 127, 084908. [Google Scholar] [CrossRef] [Green Version]
- Neimark, A.V.; Ravikovitch, P.I.; Vishnyakov, A. Bridging scales from molecular simulations to classical thermodynamics: Density functional theory of capillary condensation in nanopores. J. Phys. Condens. Matter 2003, 15, 347. [Google Scholar] [CrossRef]
- McClure, J.E.; Armstrong, R.T.; Berrill, M.A.; Schlüter, S.; Berg, S.; Gray, W.G.; Miller, C.T. Geometric state function for two-fluid flow in porous media. Phys. Rev. Fluids 2018, 3, 084306. [Google Scholar] [CrossRef]
Figure 1.
The various 2D geometries and topologies used in the simulations. Along the vertical axis, the various shapes show the cross-section of pores (i.e., disks) with different radii, . Along the horizontal axis, rods (i.e., small disks) with radius (≈) are placed inside the pores to modify the Euler characteristic, . The open-pore space is colored white and gray. The pores in gray are simulation cases where the distance between walls of either the pores or the rods are smaller than ≈, which is the distance at which Hadwiger’s theorem starts to break down [31].

Figure 2.
Comparison between experiments [62] and the cDFT simulations for the adsorption isotherm of N2 in a SiO2 slit pore with a width of . The chosen wall potential does not fully capture the interactions between N2 and SiO2, but the results show a good match. This confirms that the used parameters shown in Table 1 are a reasonable choice.

Figure 3.
Dimensionless 2D grand potential, , as a function of the dimensionless chemical potential, , for a Lennard-Jones fluid. Only the cDFT simulation results when are shown. Inset (a) shows the continuous phase transition which marks the onset of gas adsorption onto the wall. Panel (d) shows the corresponding diverging derivative of the excess adsorption. Inset (b) shows the discrete (first-order) capillary condensation phase transition. Panel (c) shows the matching jump in the dimensionless excess adsorption.

Figure 4.
Dimensionless pressure difference between the continuous phase transition associated with adsorption of gas onto a wall in the bulk and inside a pore times the surface area Minkowski functional, , as function of circumference Minkowski functional, . The Minkowski functional for topology is zero in all the shown simulations, . The curve fit is equal to: , where the Minkowski functional only depends on . The coefficients are: and . In dimensional form, from left to right the pressure differences are , , , , and .

Figure 5.
Dimensionless pressure difference between the continuous phase transition associated with adsorption of gas onto a wall in the bulk and inside a pore times the surface area Minkowski functional minus the function from Figure 4, , as function of the Minkowski functional, . The graph shows a collapse of the data and a linear fit with: , where .

Figure 6.
Dimensionless pressure difference between the capillary condensation pressure and bulk phase transition pressure times the surface area Minkowski functional, , as a function of pore radius, . The Minkowski functional for topology is zero in all the shown simulations, . The curve fit is equal to: , where the Minkowski functionals and only depend on . The coefficients are , , and . In dimensional form, from left to right the pressure differences are , , , , and .

Figure 7.
Dimensionless pressure difference between capillary condensation pressure and bulk phase transition pressure times the surface area Minkowski functional minus the function from Figure 6, , as a function of the Minkowski functional, . The graph shows a collapse of the data and a linear fit with: , where .

Figure 8.
Dimensionless 2D grand potential, , as a function of the dimensionless chemical potential, , for a Lennard-Jones fluid. Only the simulation results when are shown. The different lines show the results of the cDFT simulations while the symbols show the grand potential as reconstructed from the Minkowski functionals and one set of Minkowski functional coefficients: pressure, , surface tension, , bending rigidity, , and the pseudo pressure and surface tension terms and .

Figure 9.
(a) Dimensionless Minkowski functional coefficients: pressure, , surface tension, , bending rigidity, , and the pseudo pressure and surface tension terms and , as a function of the dimensionless chemical potential, . These are the values of the coefficients that are used in Figure 8 to reconstruct the grand potential as a function of the chemical potential. The pressure coefficient is very similar to the bulk pressure, . (b) Contribution of the Minkowski functional coefficients to the grand potential as a function of the dimensionless chemical potential for a pore size of (≈) and an Euler characteristic of .

Figure 10.
Average absolute relative error as a function of the minimal characteristic length scale of the system, . In the case of a pore without rods, this distance is twice the radius. When rods are present within the pore this is the smallest distance between the pore wall and a rod or between two different rods.

Figure 11.
Dimensionless 2D excess adsorption, , as a function of the dimensionless chemical potential, , for a Lennard-Jones fluid. Only the simulation results from Figure 1 when are shown. The different lines show the results of the cDFT simulations while the symbols show the grand potential as reconstructed from the Minkowski functionals and one set of Minkowski functional coefficients: the derivatives of pressure, , pressure per surface area, , surface tension, , bending rigidity, , and the pseudo pressure and surface tension terms and with respect to the chemical potential.

Figure 12.
(a) Dimensionless Minkowski functional coefficients: the derivatives of pressure, , pressure per surface area, , surface tension, , bending rigidity, , and the pseudo pressure and surface tension terms and , with respect to the chemical potential. These are the values of the coefficients that are used in Figure 11 to reconstruct the excess adsorption as a function of the chemical potential. (b) Contribution of the Minkowski functional coefficients to the excess adsorption for a pore with a radius of (≈) and an Euler characteristic of .

Figure 13.
Average absolute relative error as a function of the minimal characteristic length scale of the system, . In the case of a pore without rods, this distance is twice the radius. When rods are present within the pore this is the smallest distance between the pore wall and a rod or between two different rods. Because the excess adsorption is a derivative of the grand potential, the observed error is larger than Figure 10.


Table 1.
cDFT parameters of N2 and SiO2 [60]. The number density for SiO2 is [35]. Fluid-fluid interactions are truncated at . The simulations are performed at .
| N2 | 94.45 | 0.3575 | 0.3575 | 147.3 | 0.317 |
Table 2.
An overview of the dimensionless variables used in the results section. “” denotes the dimensional equivalent of a dimensionless variable. In addition, is the Boltzmann constant, , , and L is one dimensionless unit length.
Table 2.
An overview of the dimensionless variables used in the results section. “” denotes the dimensional equivalent of a dimensionless variable. In addition, is the Boltzmann constant, , , and L is one dimensionless unit length.
| Description | Symbol | Dimensionless Definition |
|---|---|---|
| Distance | ||
| Density | ||
| Grand potential | ||
| Excess adsorption | ||
| Chemical potential | ||
| Pressure | p | |
| Surface tension | ||
| Bending rigidity | ||
| Pseudo pressure | ||
| Pseudo surface tension |
Publisher’s Note: MDPI stays neutral with regard to jurisdictional claims in published maps and institutional affiliations. |
© 2021 by the authors. Licensee MDPI, Basel, Switzerland. This article is an open access article distributed under the terms and conditions of the Creative Commons Attribution (CC BY) license (https://creativecommons.org/licenses/by/4.0/).
Share and Cite
MDPI and ACS Style
Boelens, A.M.P.; Tchelepi, H.A. The Effect of Topology on Phase Behavior under Confinement. Processes 2021, 9, 1220. https://doi.org/10.3390/pr9071220
AMA Style
Boelens AMP, Tchelepi HA. The Effect of Topology on Phase Behavior under Confinement. Processes. 2021; 9(7):1220. https://doi.org/10.3390/pr9071220
Chicago/Turabian StyleBoelens, Arnout M. P., and Hamdi A. Tchelepi. 2021. "The Effect of Topology on Phase Behavior under Confinement" Processes 9, no. 7: 1220. https://doi.org/10.3390/pr9071220
Note that from the first issue of 2016, this journal uses article numbers instead of page numbers. See further details here.