An Experimental Investigation of Flow Regimes in Imbibition and Drainage Using a Microfluidic Platform


Department of Chemical Engineering, University of Wyoming, Laramie, WY 82071, USA
*
Author to whom correspondence should be addressed.
Energies 2019, 12(7), 1390; https://doi.org/10.3390/en12071390
Submission received: 13 March 2019
/
Revised: 5 April 2019
/
Accepted: 6 April 2019
/
Published: 11 April 2019
(This article belongs to the Special Issue Enhanced Oil Recovery 2019)
Abstract
:Instabilities in immiscible displacement along fluid−fluid displacement fronts in porous media are undesirable in many natural and engineered displacement processes such as geological carbon sequestration and enhanced oil recovery. In this study, a series of immiscible displacement experiments are conducted using a microfluidic platform across a wide range of capillary numbers and viscosity ratios. The microfluidic device features a water-wet porous medium, which is a two-dimensional representation of a Berea sandstone. Data is captured using a high-resolution camera, enabling visualization of the entire domain, while being able to resolve features as small as 10 µm. The study reports a correlation between fractal dimensions of displacement fronts and displacement front patterns in the medium. Results are mapped on a two-dimensional parameter space of log M and log Ca, and stability diagrams proposed in literature for drainage processes are superimposed for comparison. Compared to recent reports in the literature, the results in this work suggest that transition regimes may constitute a slightly larger portion of the overall flow regime diagram. This two-phase immiscible displacement study helps elucidate macroscopic processes at the continuum scale and provides insights relevant to enhanced oil recovery processes and the design of engineered porous media such as exchange columns and membranes.
1. Introduction
Study of multiphase-fluid distribution and flow in porous media is essential to several fields, including petroleum engineering, hydrogeology, bioengineering and geoengineering [1]. Specific examples include soil remediation, enhanced oil recovery (EOR), hydrogen fuel cells and liquid transport through cellulose [2]. Thus, distribution and flow behavior of immiscible fluids in porous media are active areas of both experimental and theoretical research [3]. Physical mechanisms at pore scale for immiscible fluids appear to be well understood and are easier to model than miscible fluids; however, predictions of transport and accurate descriptions of displacement processes remain elusive due to a large number of factors impacting flow in porous media and lack of comprehensive experimental data [4,5]. Using quasi-two-dimensional transparent porous media, i.e., microfluidic devices, fluid flow can be directly controlled and monitored. Such an approach allows virtual observation of flow distribution, displacement, interfaces between immiscible fluids and quantitative evaluation of evolution of saturation, thereby providing significant insight into the physical mechanisms and flow patterns at pore scale [6,7].
Two-phase displacement behavior in porous media, in the absence of gravitational forces, can be characterized by two dimensionless numbers: capillary number, Ca, which is the ratio of viscous forces to capillary forces; and viscosity ratio, M, which is the ratio of the two viscosities [8]. The capillary number is defined as Ca = vµ1/γ, where v is Darcy velocity of the invading fluid, µ is its viscosity, and γ is the interfacial tension. M is defined as the ratio of the viscosity of the invading fluid, µ1, to that of the displaced fluid, µ2. Depending on these two parameters, either capillary or viscous forces dominate, which leads to three basic displacement regimes: (1) viscous fingering, (2) capillary fingering, or (3) stable displacement [9]. These flow regimes have been studied and delineated using displacement experiments and pore-scale numerical simulations [10].
Lenormand et al. [11] proposed a phase diagram based on log Ca and log M to describe two-phase immiscible displacement behavior in porous media. Schiwille et al. [12] conducted visualized dispersion and entrapment in immiscible displacement experiments in two-dimensional packed glass beads. Zhang et al. [13] demonstrated unstable liquid CO2 displacement of water in a porous medium in capillary-dominated and viscous fingering regimes in microfluidic-based experiments. Chomsurin et al. [14] and Werth et al. [15] demonstrated fluid saturation and analyzed interfacial areas using quantitative image analysis techniques in microfluidic displacement experiments.
Due to the large ranges of imposed Ca and M values, a limited number of comprehensive immiscible displacement experiments are conducted to observe flow behavior and fundamental interfacial processes at the pore scale [13,16,17]. Immiscible displacement experiments conducted by Lenormand et al. [4,9] are some of the few reported microfluidic studies so far where a large number of fluids with a considerably high range of viscosity ratios are investigated for a variety of flow conditions. However, issues related to microfluidic device fabrication and image analysis techniques, such as inconsistency in pore networks across experiments and lack of quantitative phase distribution analysis, may constrain the results. Liu et al. [18] simulated a gas-displacing-liquid drainage displacement process using the Lattice Boltzmann method. A homogenous two-dimensional pore network consisting of uniformly spaced square obstructions were used for the model. Based on their simulation data, three flow regimes were identified and a different boundary line was proposed for the viscous fingering regime compared to work by Lenormand et al. [4] and Zhang et al. [5].
Ferer et al. [19] used air to displace water in a glass microfluidic device to experiments across a wide range of viscosities and demonstrated a crossover from capillary fingering to viscous fingering. Furthermore, Wang et al. [10] conducted a series of experiments using supercritical CO2 to displace water to study the crossover zone. However, the viscosity ratio between invading and residence fluids were limited in those studies due to the choice of nonwetting and wetting fluids and their study only focused on either drainage or imbibition [5,20].
In this effort, a series of drainage and imbibition displacement experiments covering a relatively large range of capillary numbers and viscosity ratios are conducted. Fluid displacement and migration behavior in a porous medium are investigated using a transparent glass microfluidic device. Unlike most of previous studies that use porous media comprising of rectangular pore bodies and throats [4,19,21], the pore network used in this work is a representation of a Berea sandstone, which results in a porous medium with a complex network of channels with rigid walls in multi-fluid displacement experiments [22]. A high-resolution camera is used to capture images of the entire porous medium at prescribed time intervals during displacement experiments [23]. The direct use of the camera without optical zoom provides for imaging of the medium in its entirety while providing the resolution needed to discern features as small as 10 µm. The images enable quantitative analysis of fractal dimensions of displacement fronts in displacement experiments. Observed flow behaviors and fractal dimensions in displacement experiments are used to map three flow regimes with boundaries using their respective values of log Ca and log M. This research not only extends works of previous studies with a larger range of Ca and M using a glass microfluidic device, but also presents improvements in visualization and analysis of phase distribution information.
2. Materials and Methods
2.1. Fluids Preparation
Deionized (DI) water (Nanopure II, Barnstead, Dubuque) and glycerol (ACS-reagent-grade, Sigma Aldrich, Saint Louis, MO, USA) mixtures are used as the wetting phase, with viscosities ranging from 1 cp to 250 cp. The nonwetting fluid, consisting of mineral oil mixtures including Pentane (0.24 cp, HPLC grade, Fisher Chemical, Colorado Springs, CO, USA), Hydrobrite 550PO (270 cp, Sonneborn, Petrolia, PA, USA) and Carnation (120 cp, Sonneborn, PA, USA), is used in the displacement experiments. A food dye (black, Amazon) is added to the wetting fluid to increase its contrast compared to the nonwetting phase. Methanol (HPLC grade, Sigma Aldrich, Saint Louis, MO, USA), acetone (ACS-reagent-grade, Fisher Chemical, Colorado Springs, CO, USA) and toluene (HPLC grade, Fisher Chemical, Colorado Springs, CO, USA) are used to clean the organic residue in the porous medium and syringe.
In the drainage experiments, seven wetting–nonwetting fluid pairs are prepared with viscosity ratios ranging from 0.1 to 300 (Table 1). In imbibition experiments, six wetting–nonwetting fluid pairs are prepared with viscosity ratios ranging from 0.1 to 200 (Table 2). Viscosity is measured using a spindle viscometer (DV2T, Brookfield, Middleboro, MA, USA). Interfacial tension values are measured using the pendant drop method and a drop shape analysis system (Kruss DSA100). The collected data includes three measurements for each data point; average values are reported in Table 1 and Table 2. All measurements are carried out at atmospheric pressure and room temperature (approximately 20 °C). Each fluid is degassed (Ultrasonic bath, Fisher Scientific, Colorado Springs, CO, USA) for 10 min and filtered by a syringe filter (0.2 μm, Sterlitech, Kent, WA, USA) prior to injection in microfluidic device.
2.2. Micromodels and Experimental Setup
The total chip dimension is 100 mm × 40 mm with a pore network region of 70 mm × 20 mm and a porosity of approximately 40%. The average depth of the etched pore network is 10 μm. The permeability of the microfluidic device is approximately 74 mD. The map of the complex channel network is based on work reported by Alaskar [24]. The network represents the distribution of pores and throats observed in a thin section of a Berea sandstone [24,25].
All displacement experiments are performed in the same microfluidic device. In drainage experiments, the microfluidic device is flushed using methanol and DI water, in that sequence, to facilitate subsequent saturation by the wetting fluids, followed by the injection of a of dyed wetting fluids. Nonwetting fluids are injected through one side of microfluidic device using a syringe pump (PHD Ultra, Harvard Apparatus) at various volumetric flowrates (q); the flowrates ranged from 0.03 to 6 μL/min. The other side of the microfluidic device is open to the atmosphere. At each flowrate, the nonwetting fluid is injected to displace wetting fluid until the nonwetting fluid crossed the entire porous medium and saturation reached a quasi-steady state. The microfluidic device is cleaned after each displacement experiment according to the following cleaning protocol: isopropanol/ethanol/water (1:1:1), 2 M HCl solution, DI water, a basic solution (DI water/NH4OH/H2O2 at 5:1:1) and DI water. Likewise, in imbibition experiments, the same experimental setup is used. The microfluidic device is flushed by methanol and toluene followed by injection of nonwetting fluids. Dyed wetting fluids are injected through the microfluidic device using the syringe pump at various volumetric flowrates ranging from 0.06 to 6 μL/min.
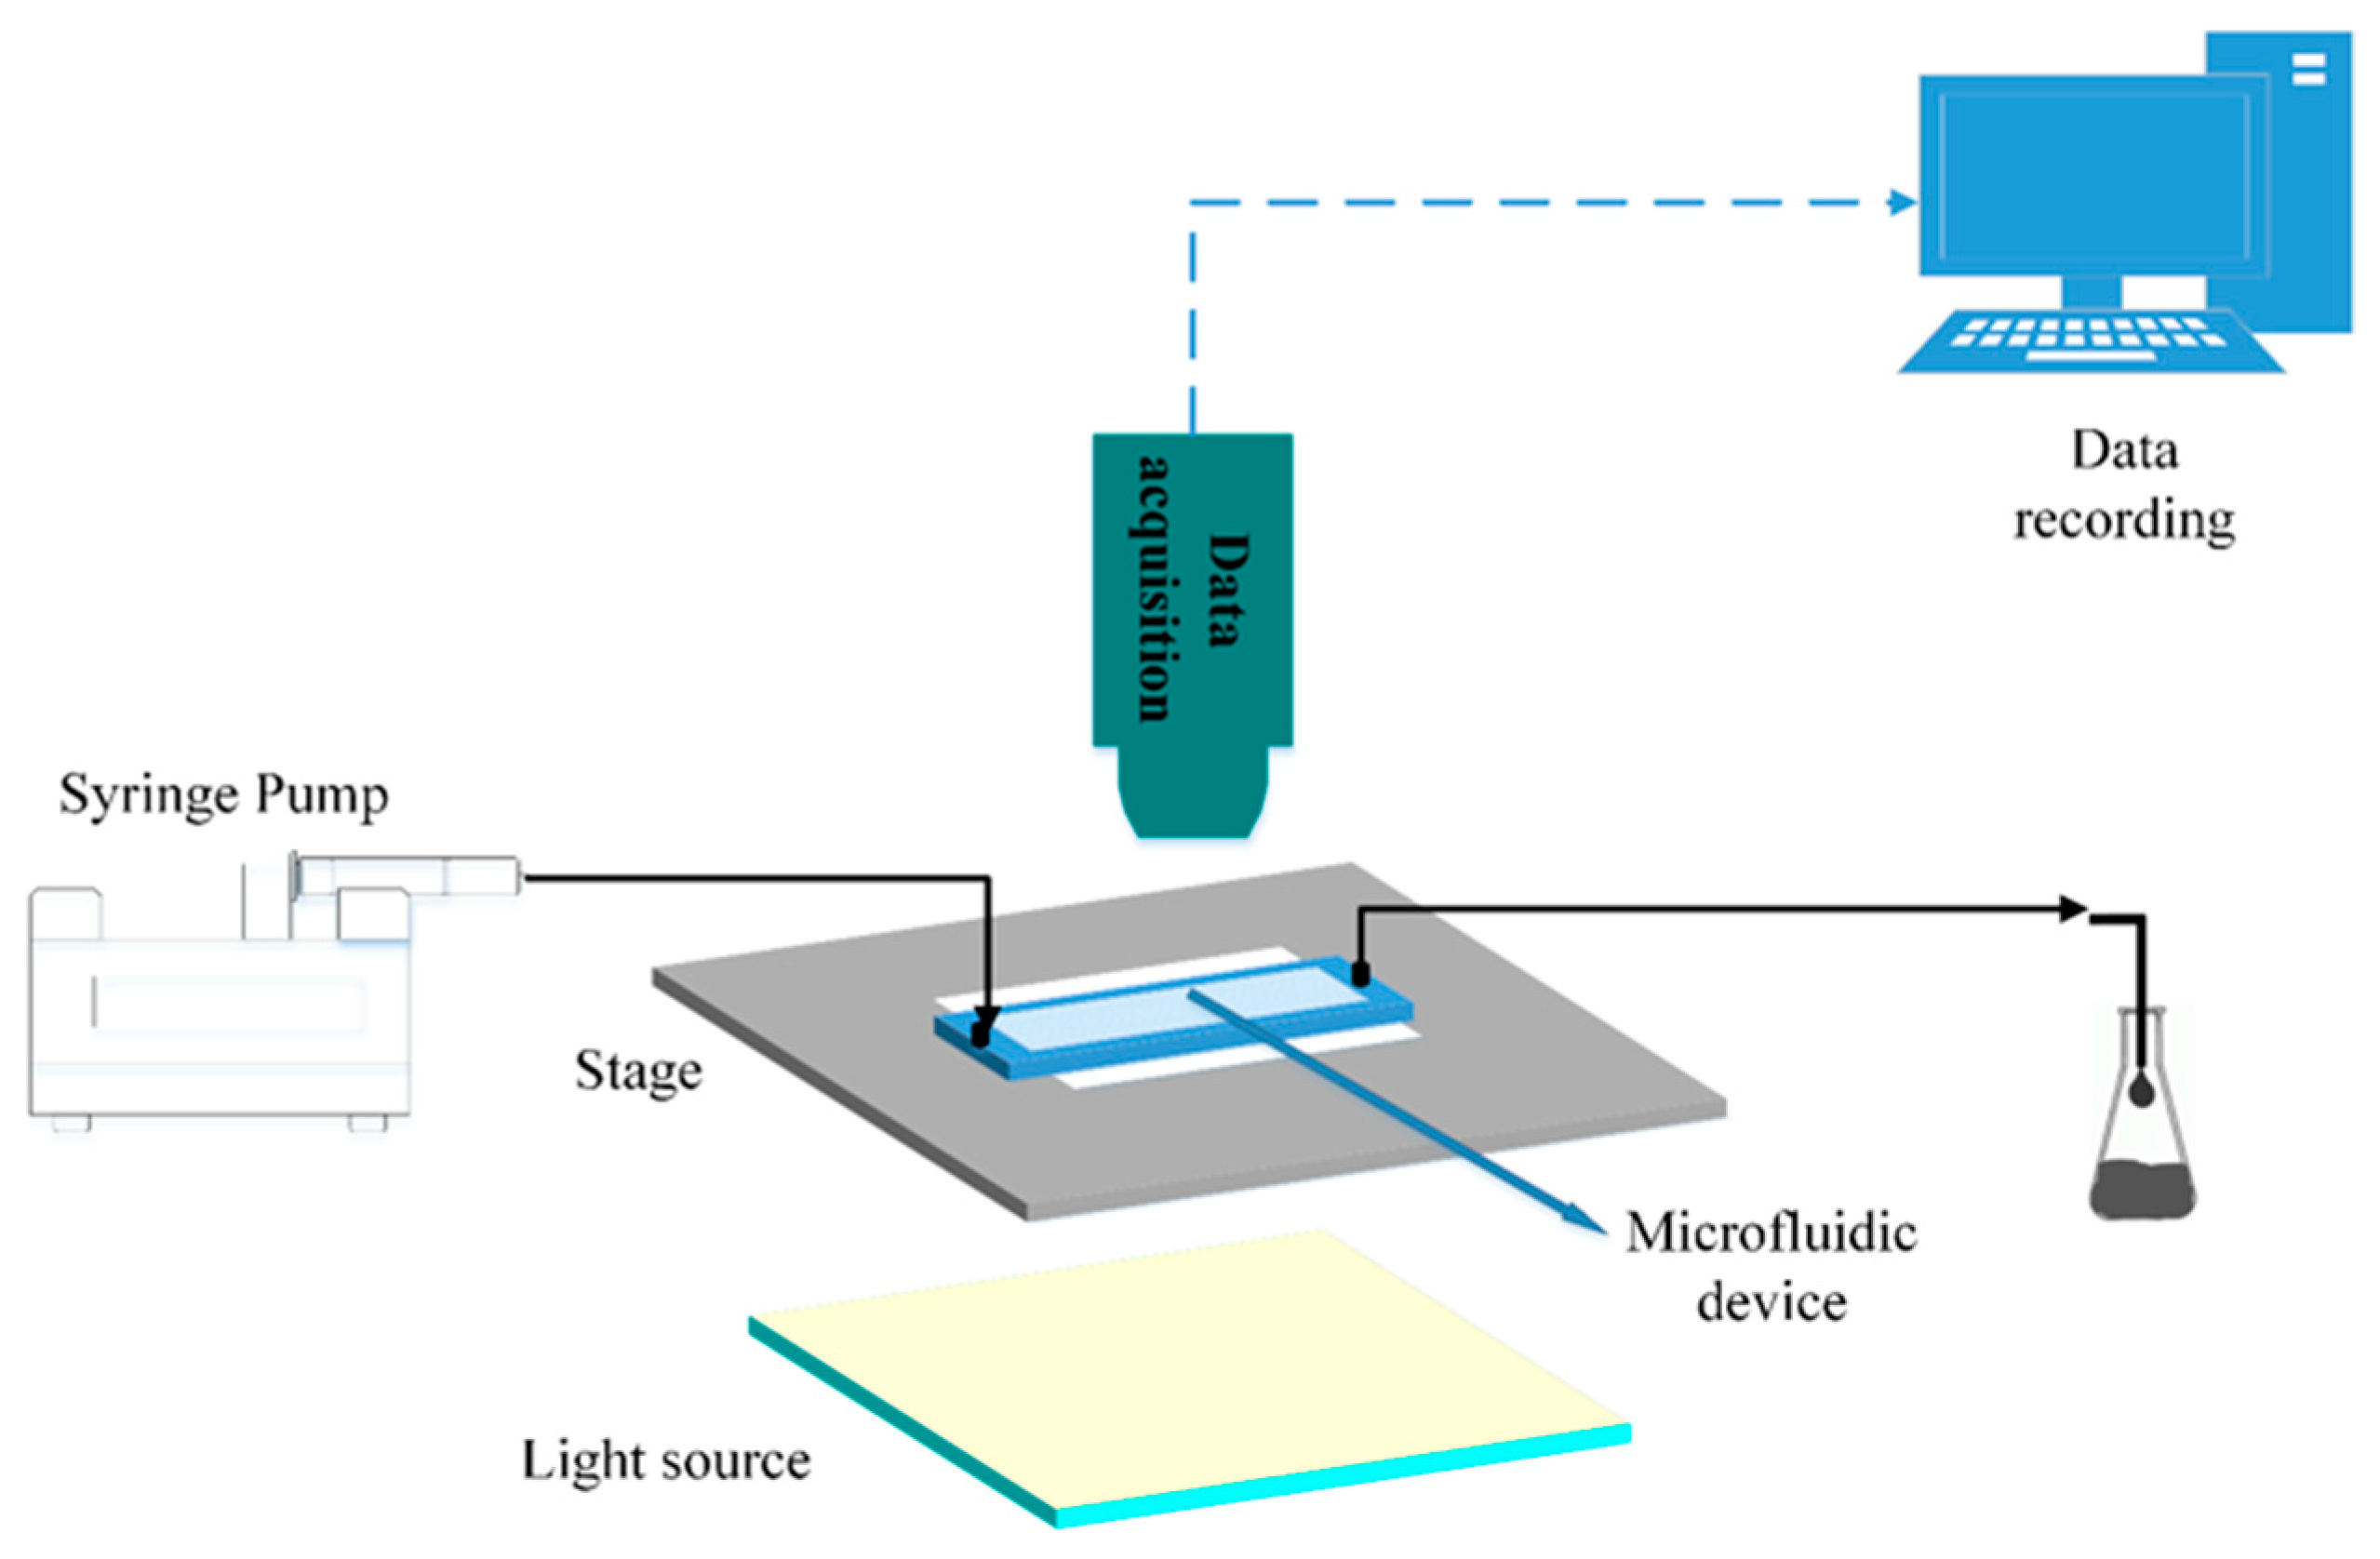
The microfluidic device is placed horizontally on a flat stage above a homogeneous light source which allows the light to penetrate the microfluidic device. Displacement images are acquired with a Phase One IQ3 digital camera with a monochromatic 60 MP sensor. The entire experimental setup is shown in Figure 1.
3. Results and Discussion
High-resolution images of the medium under continuous flow conditions are captured during dynamic displacement experiments at prescribed time intervals until the saturation of the invading fluid reaches a quasi-steady state for each of the flow rates. Fractal dimensions, Df, of displacement fronts are computed using the box counting method following Aryana et al. [26], which serves as a measure of the interface roughness for drainage and imbibition experiments. In the case of drainage experiments, the relation between the inverse of flow rate and the width of stabilized zone, a quasi-steady region around the water-oil displacement front exhibiting sharp variations of the displacing phase saturation, is investigated and the results are compared with the findings by Leas and Rapoport [27] and Barenblatt et al. [28]. Flow regimes are important in the design and operation of improved oil recovery and EOR processes; flow regimes affect displacement efficiency, overall recovery and surface injection recycling capacity needs. A stable viscous displacement often results in less bypassed resident fluid compared to unstable regimes. If a displacement falls within the stable regime, one can expect a reasonably high recovery and displacement efficiency. On the other hand, unstable flow regimes may lead to significant losses of economically recoverable resources from petroleum assets [29], or losses in storage capacity in geologic storage of CO2, due to bypassing of resident fluids [30]. Flow instabilities are caused by heterogeneities in the media and nonlinearities in the flow equations [26,31,32,33,34]. Bypassing of resident fluids promoted in unstable flow regimes often leads to early breakthrough of the injectant in producers, which may put unanticipated stress on surface facilities needed to handle, recycle and reinject the fluids [35,36,37].
3.1. Drainage
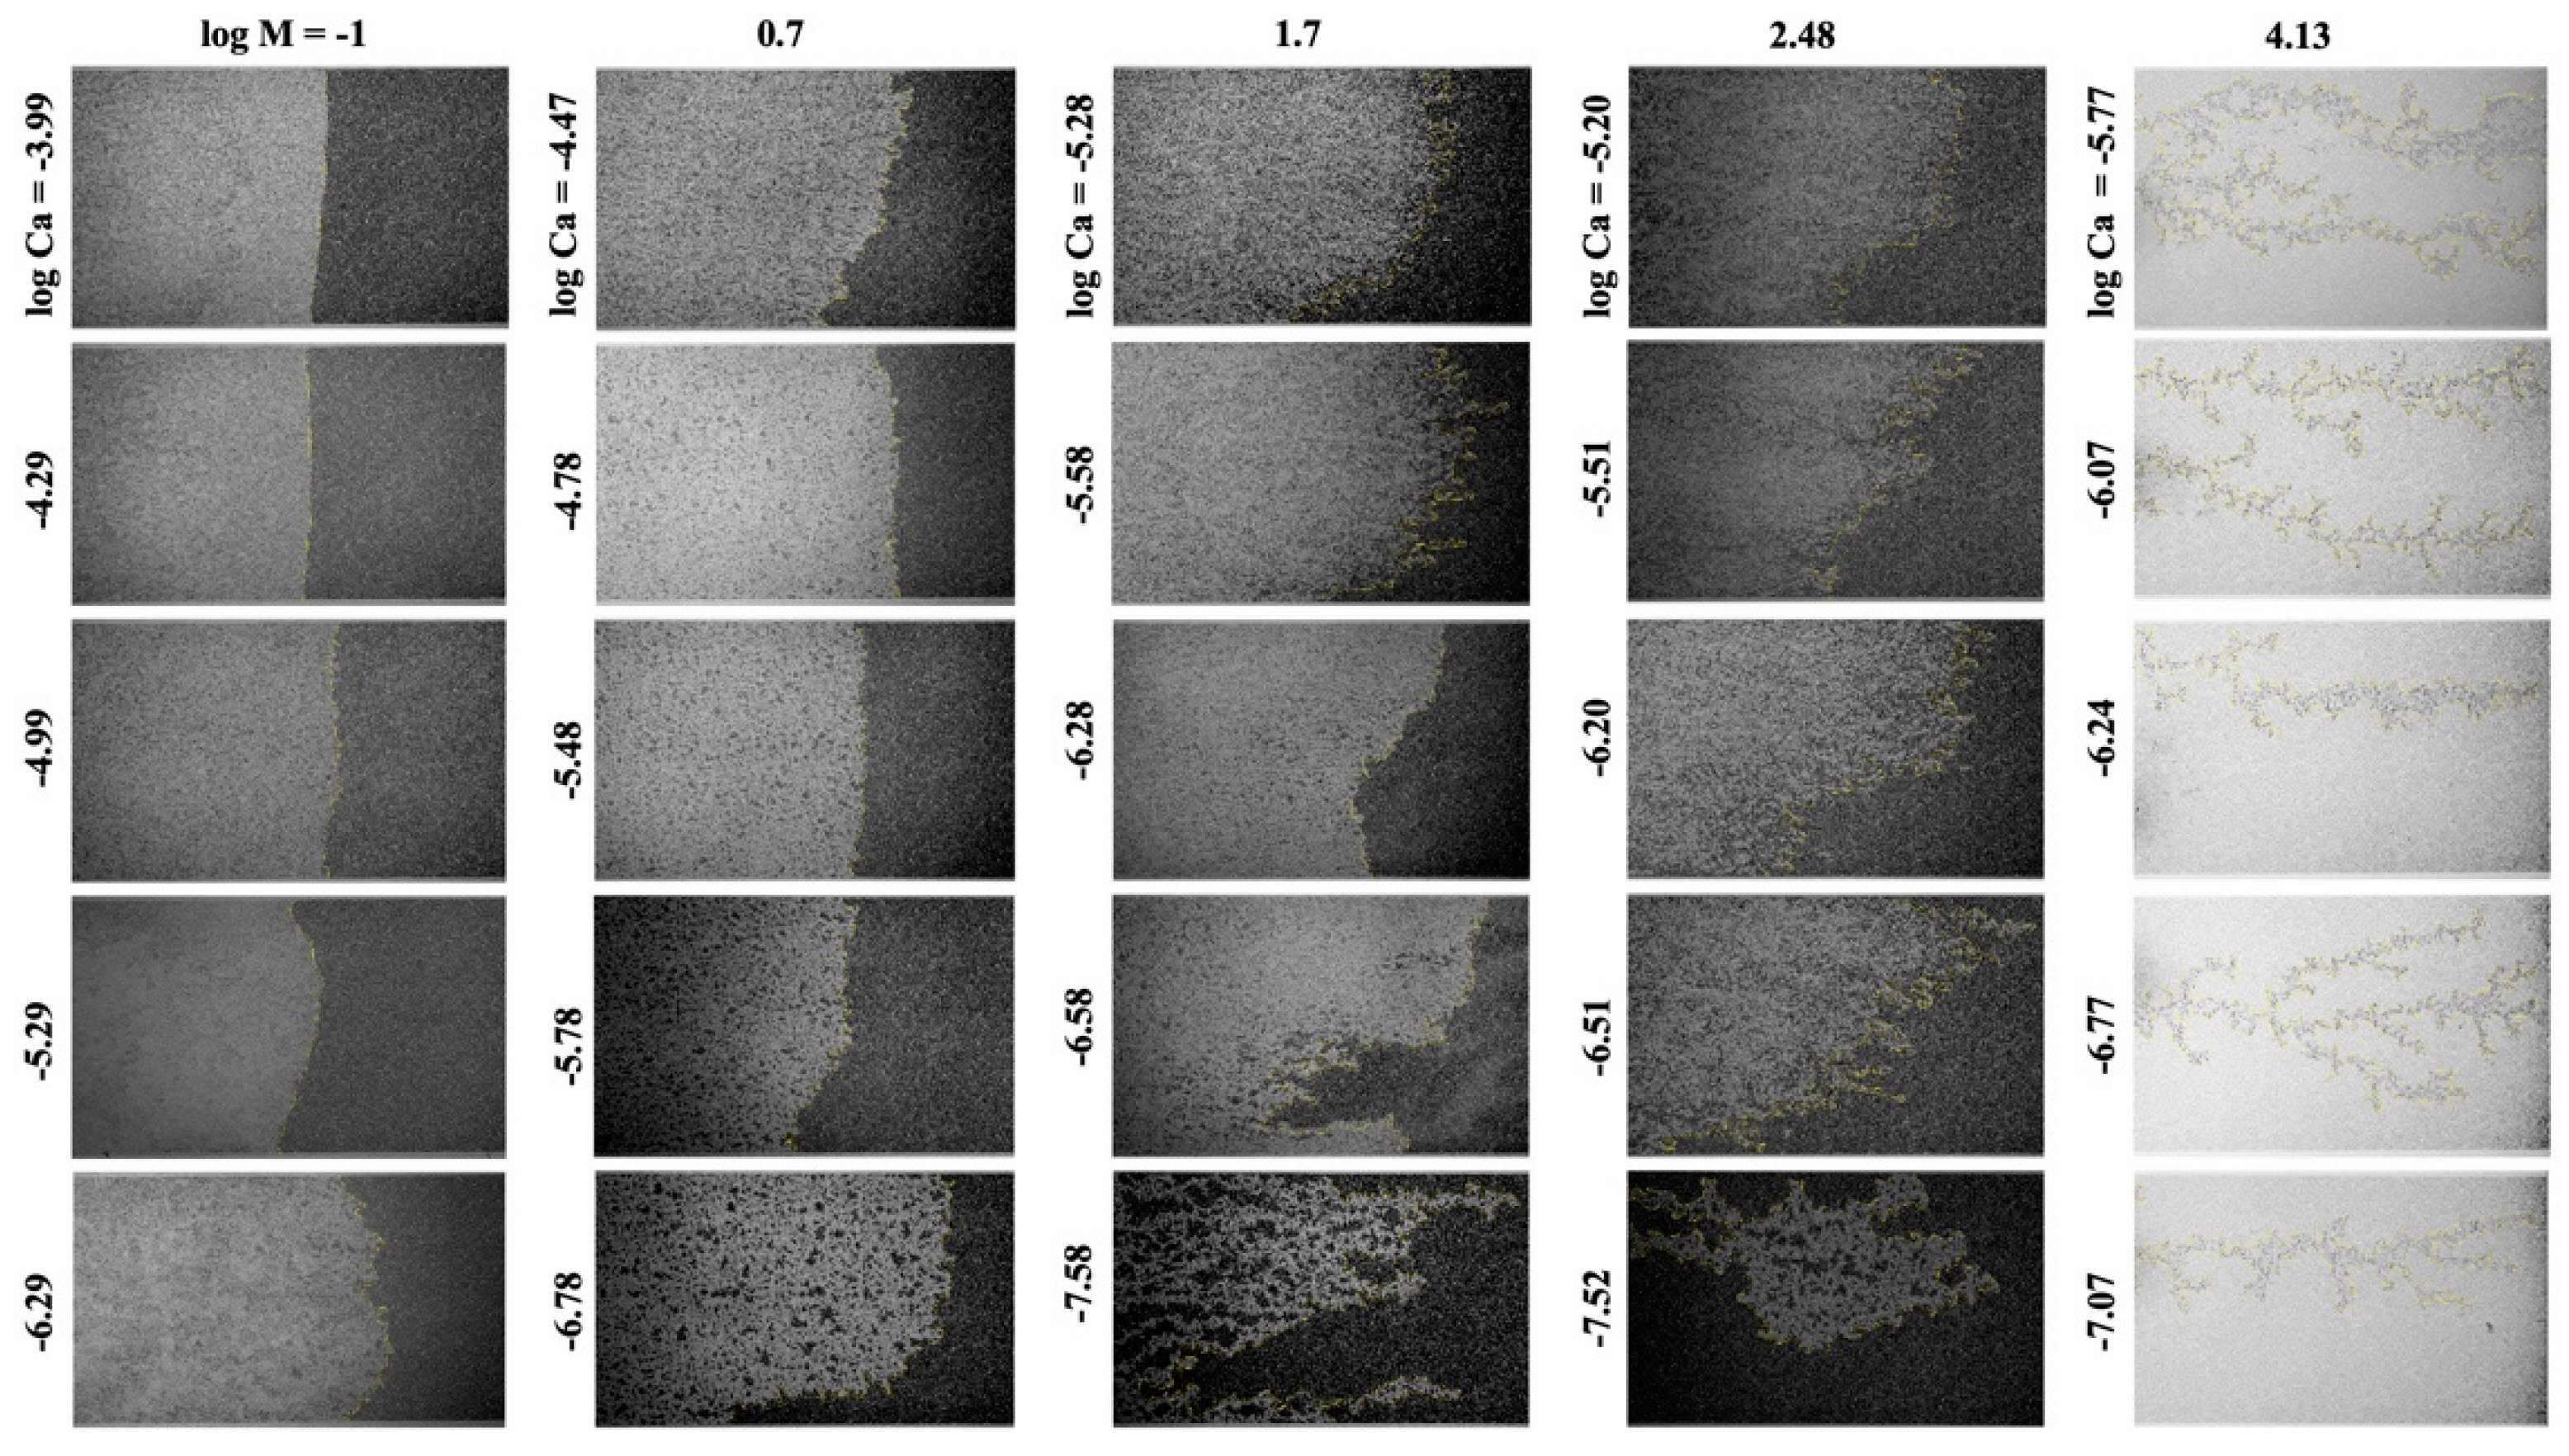
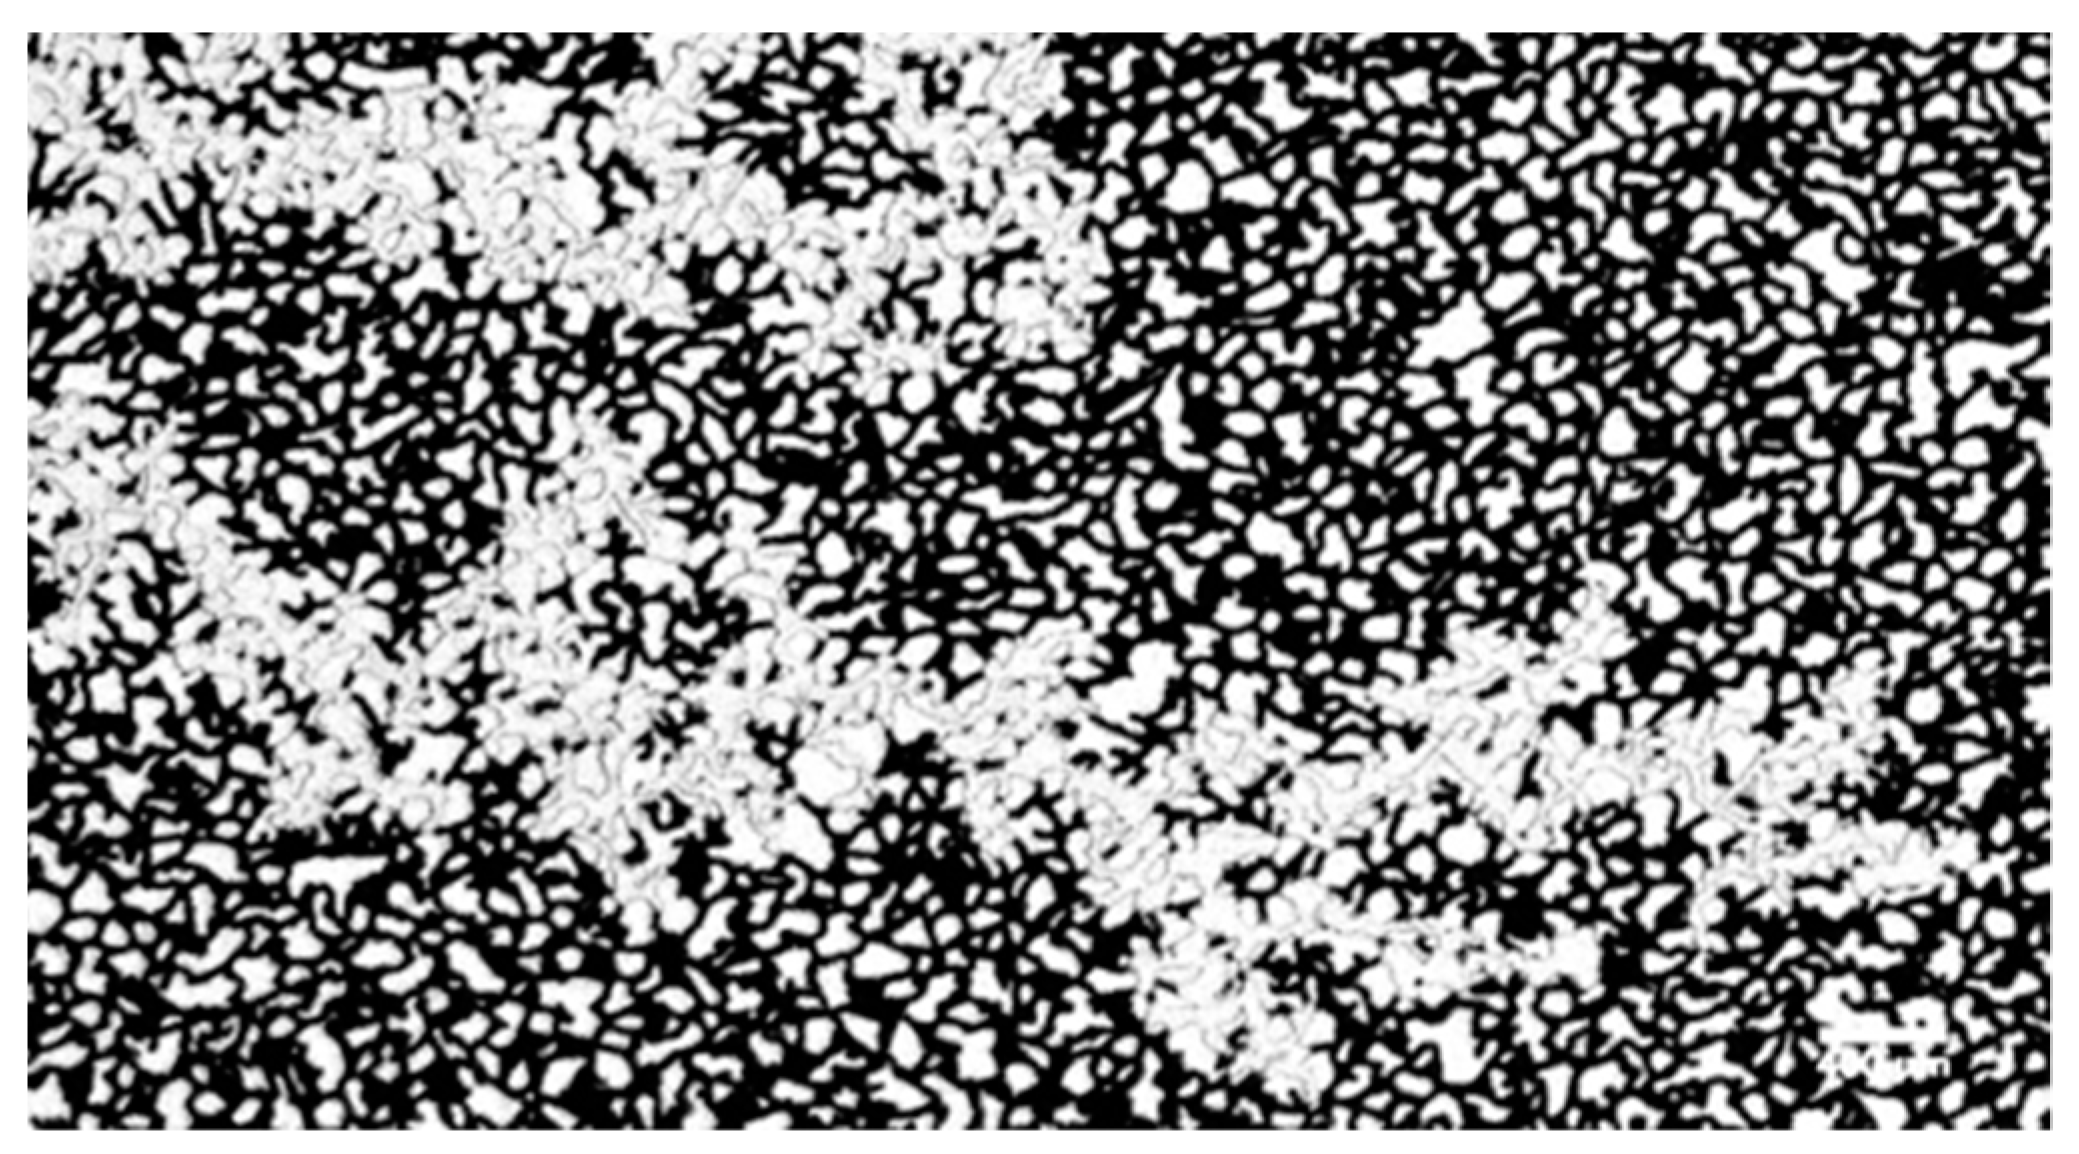
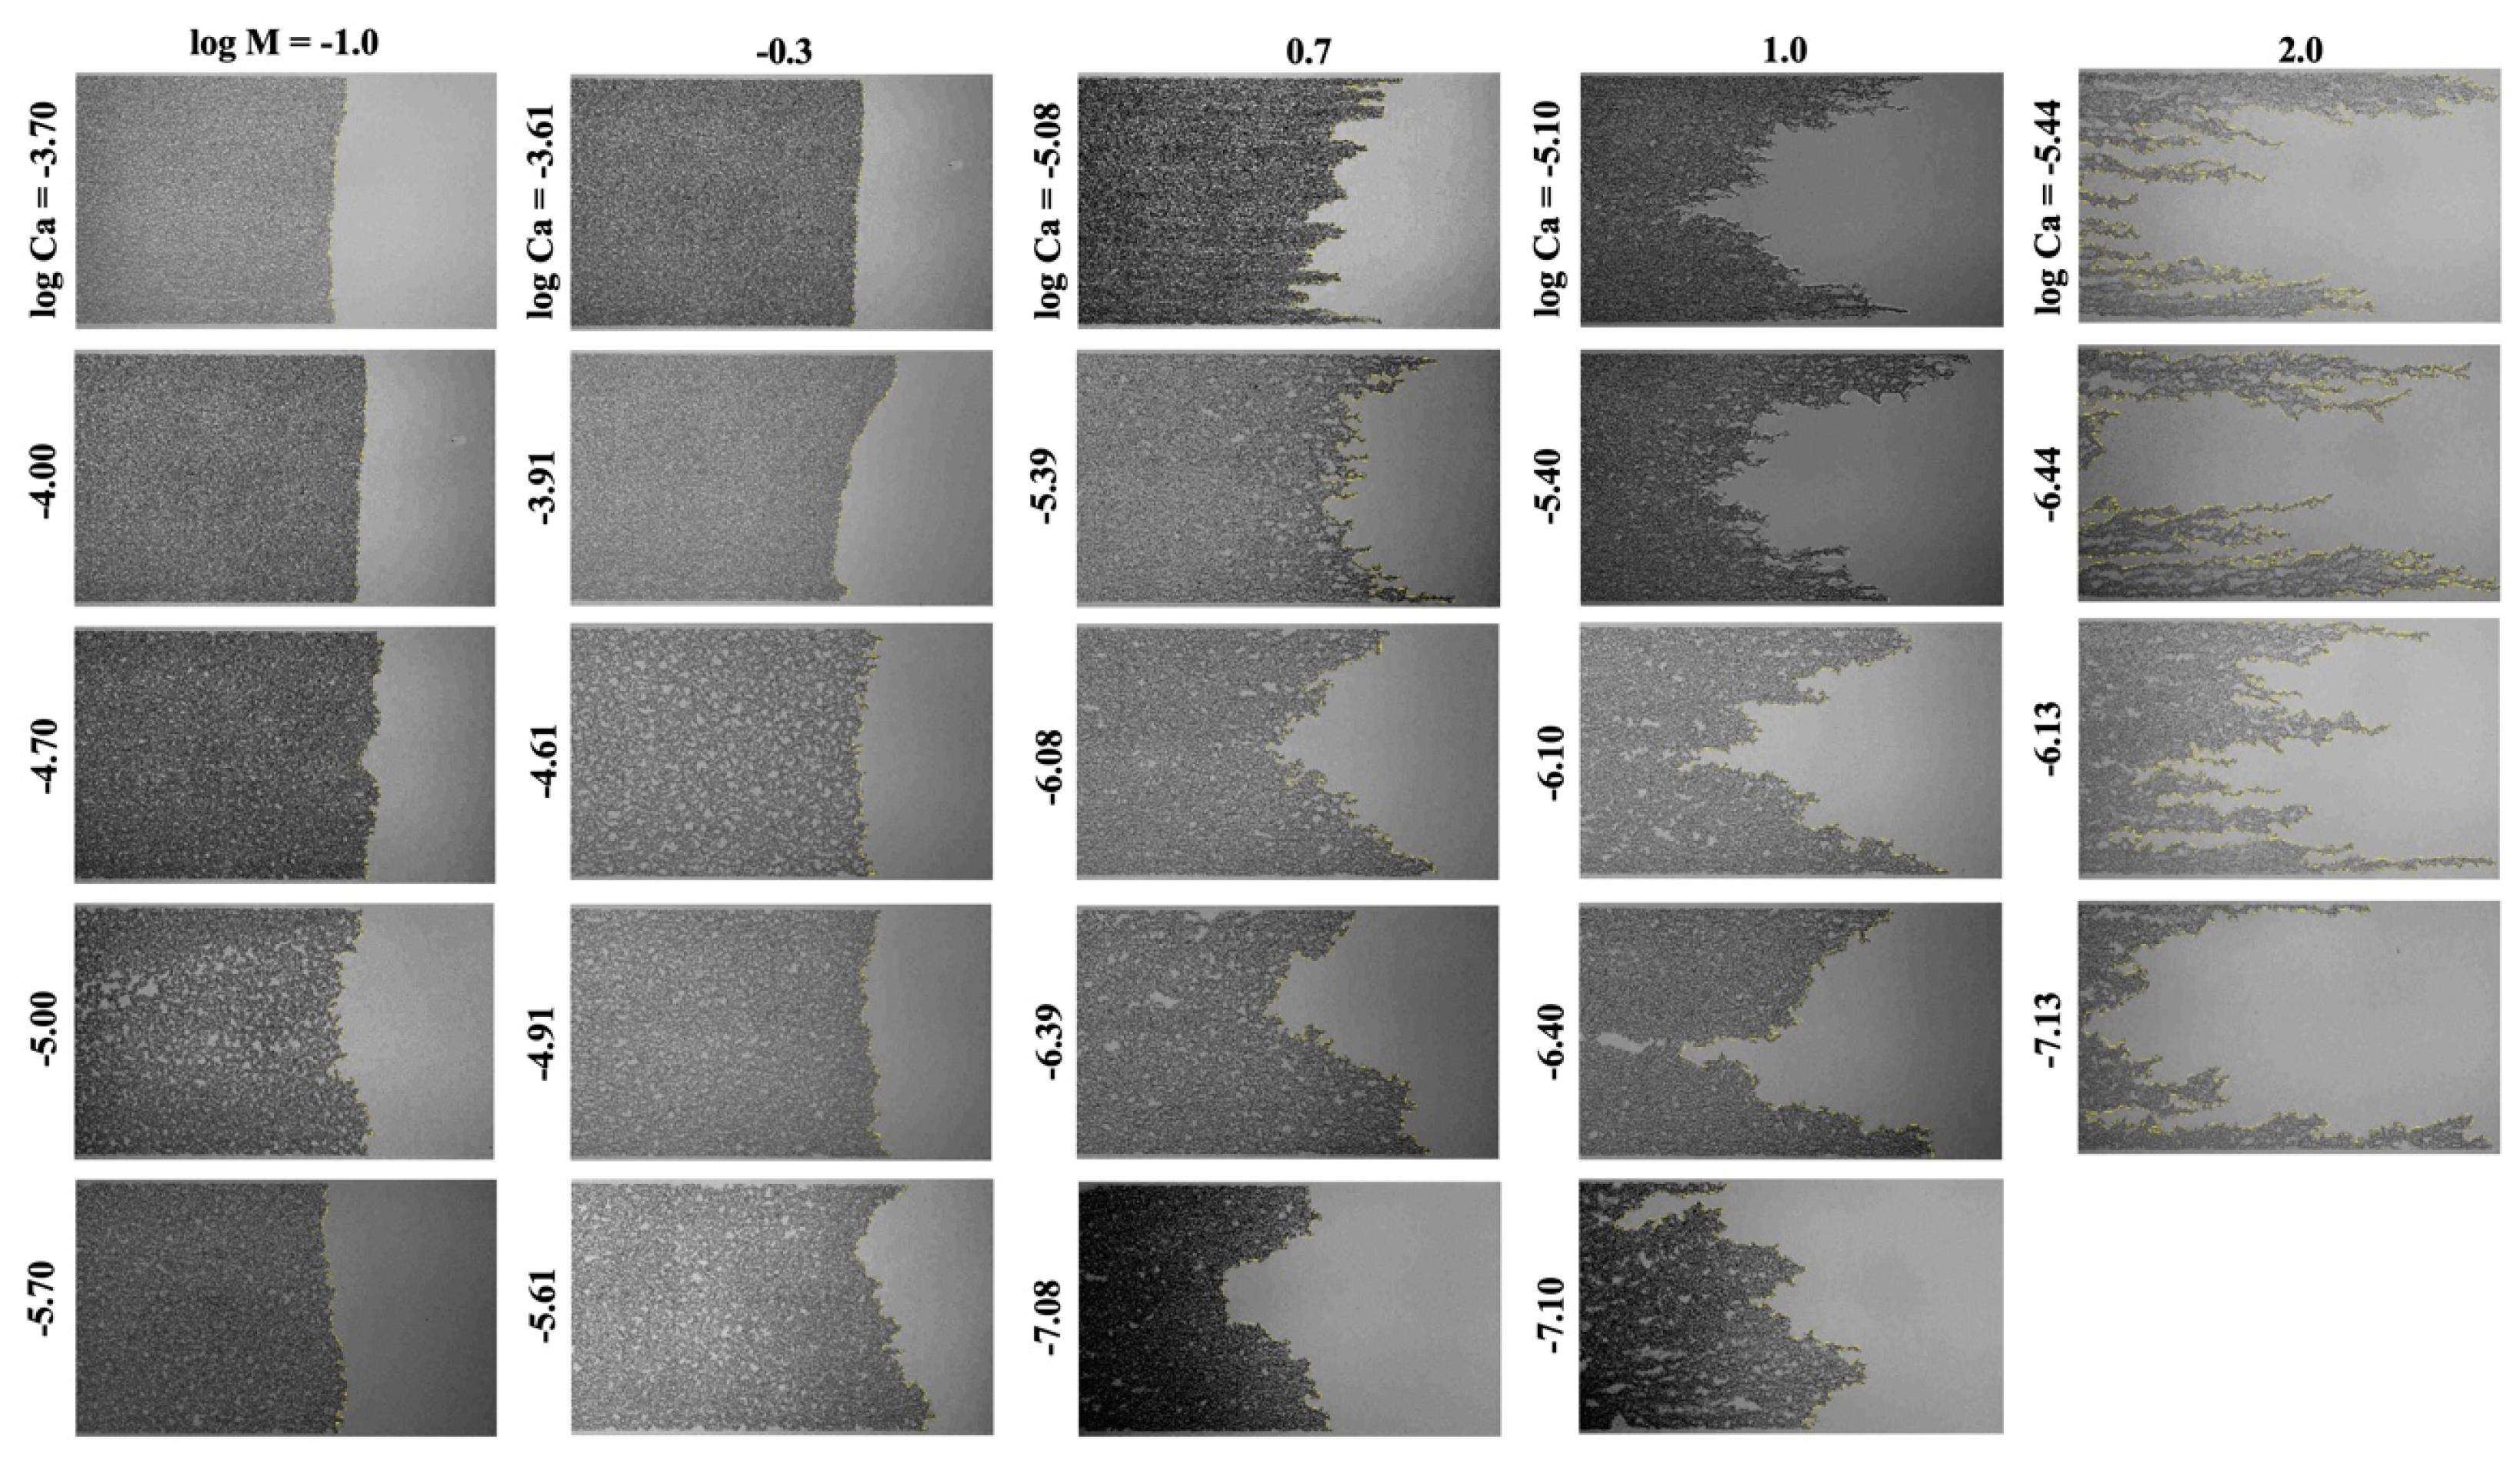
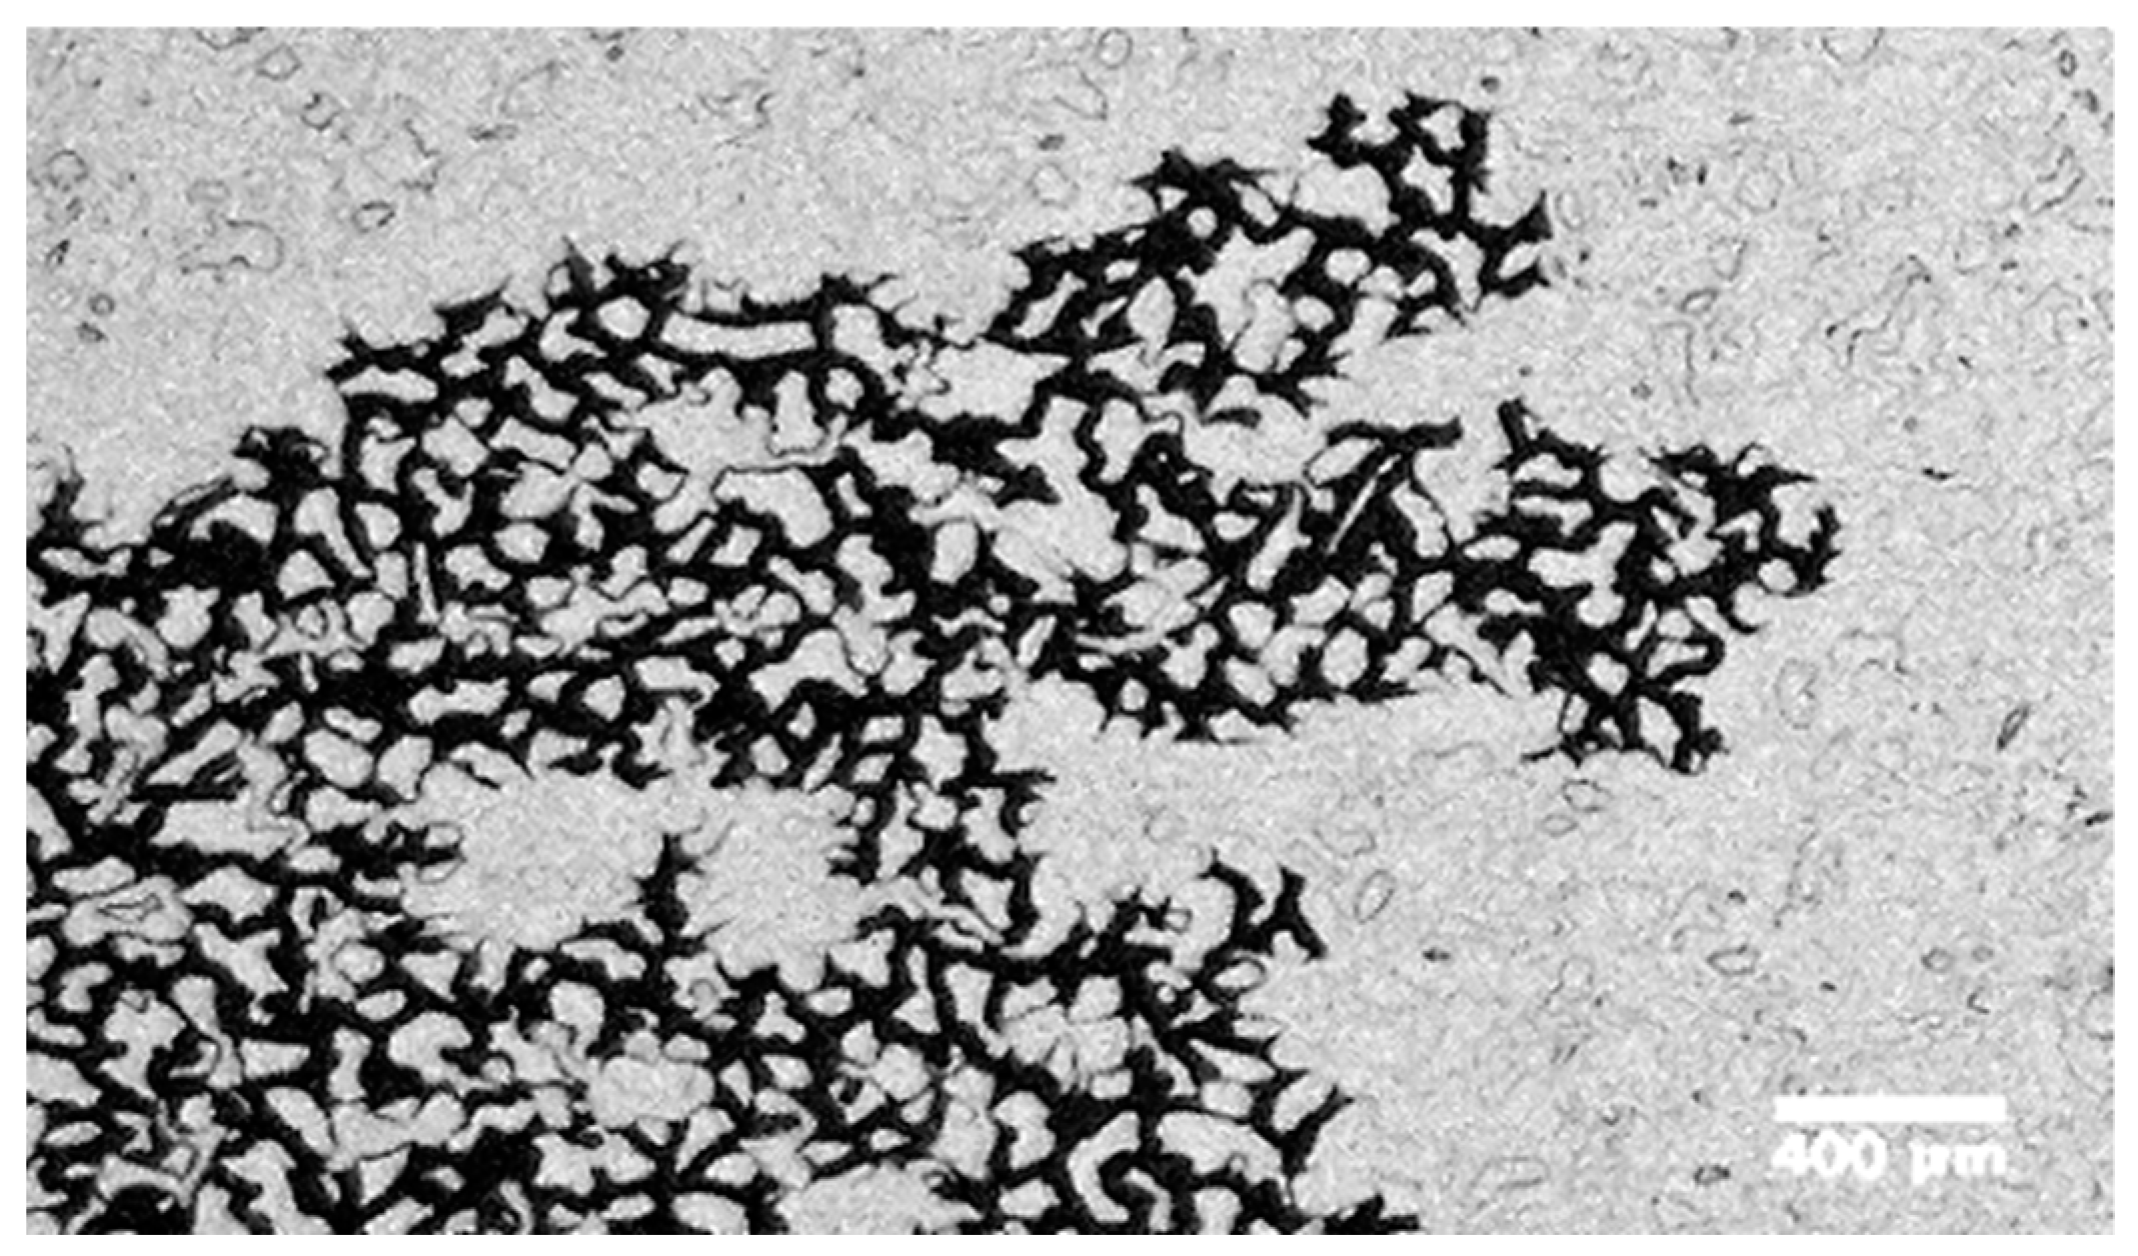
Based on drainage displacement images, shown in Figure 2, it is observed that at small values of Ca (log Ca < −6.3) and small values of M (log M < 2), patterns in displacement interfaces form an interconnected flow path with randomly distributed forward and lateral fingers. This trend in displacement interface patterns indicates a capillary fingering pattern in which capillary forces dominate the displacement [21]. In capillary fingering, the nonwetting fluid in a pore progresses preferentially through the largest pore throat due to a relatively lower entry pressure; hence, the nonwetting fluid may progress in any direction, even perpendicular to the main direction of flow or in the backward direction [38]. At large values of M (log M > 2.5), flow paths with multiple loosely connected or narrow-disconnected fingering are also observed. In such cases, viscous forces appear to dominate the flow, and viscous fingers are important features of the interface affecting the overall flow behavior. In cases where log Ca > −4.9, log M < −0.3, the flow path shows a uniform interface front, distributed over the entire width of the microfluidic device. This displacing front results in a high final saturation and would be considered a near-stable displacement, where low viscosity wetting fluids are displaced by a relatively viscous nonwetting fluid at a high injection rate [4]. For capillary numbers ranging between log Ca = −5.0 and log Ca = −6.3, both capillary and viscous fingers are observed. Nonwetting fluid distribution is related to physical mechanisms responsible for the displacement and the stability of the interface [39]. Based on work by Lenormand et al. [4,9] and our observations (Figure 3), in the drainage process, the nonwetting fluid is stopped at the entrance of a channel until the pressure exceeds the capillary entry pressure. After passing this throat, the nonwetting fluid spontaneously invades the adjacent larger intersections.
3.1.1. Phase Diagram
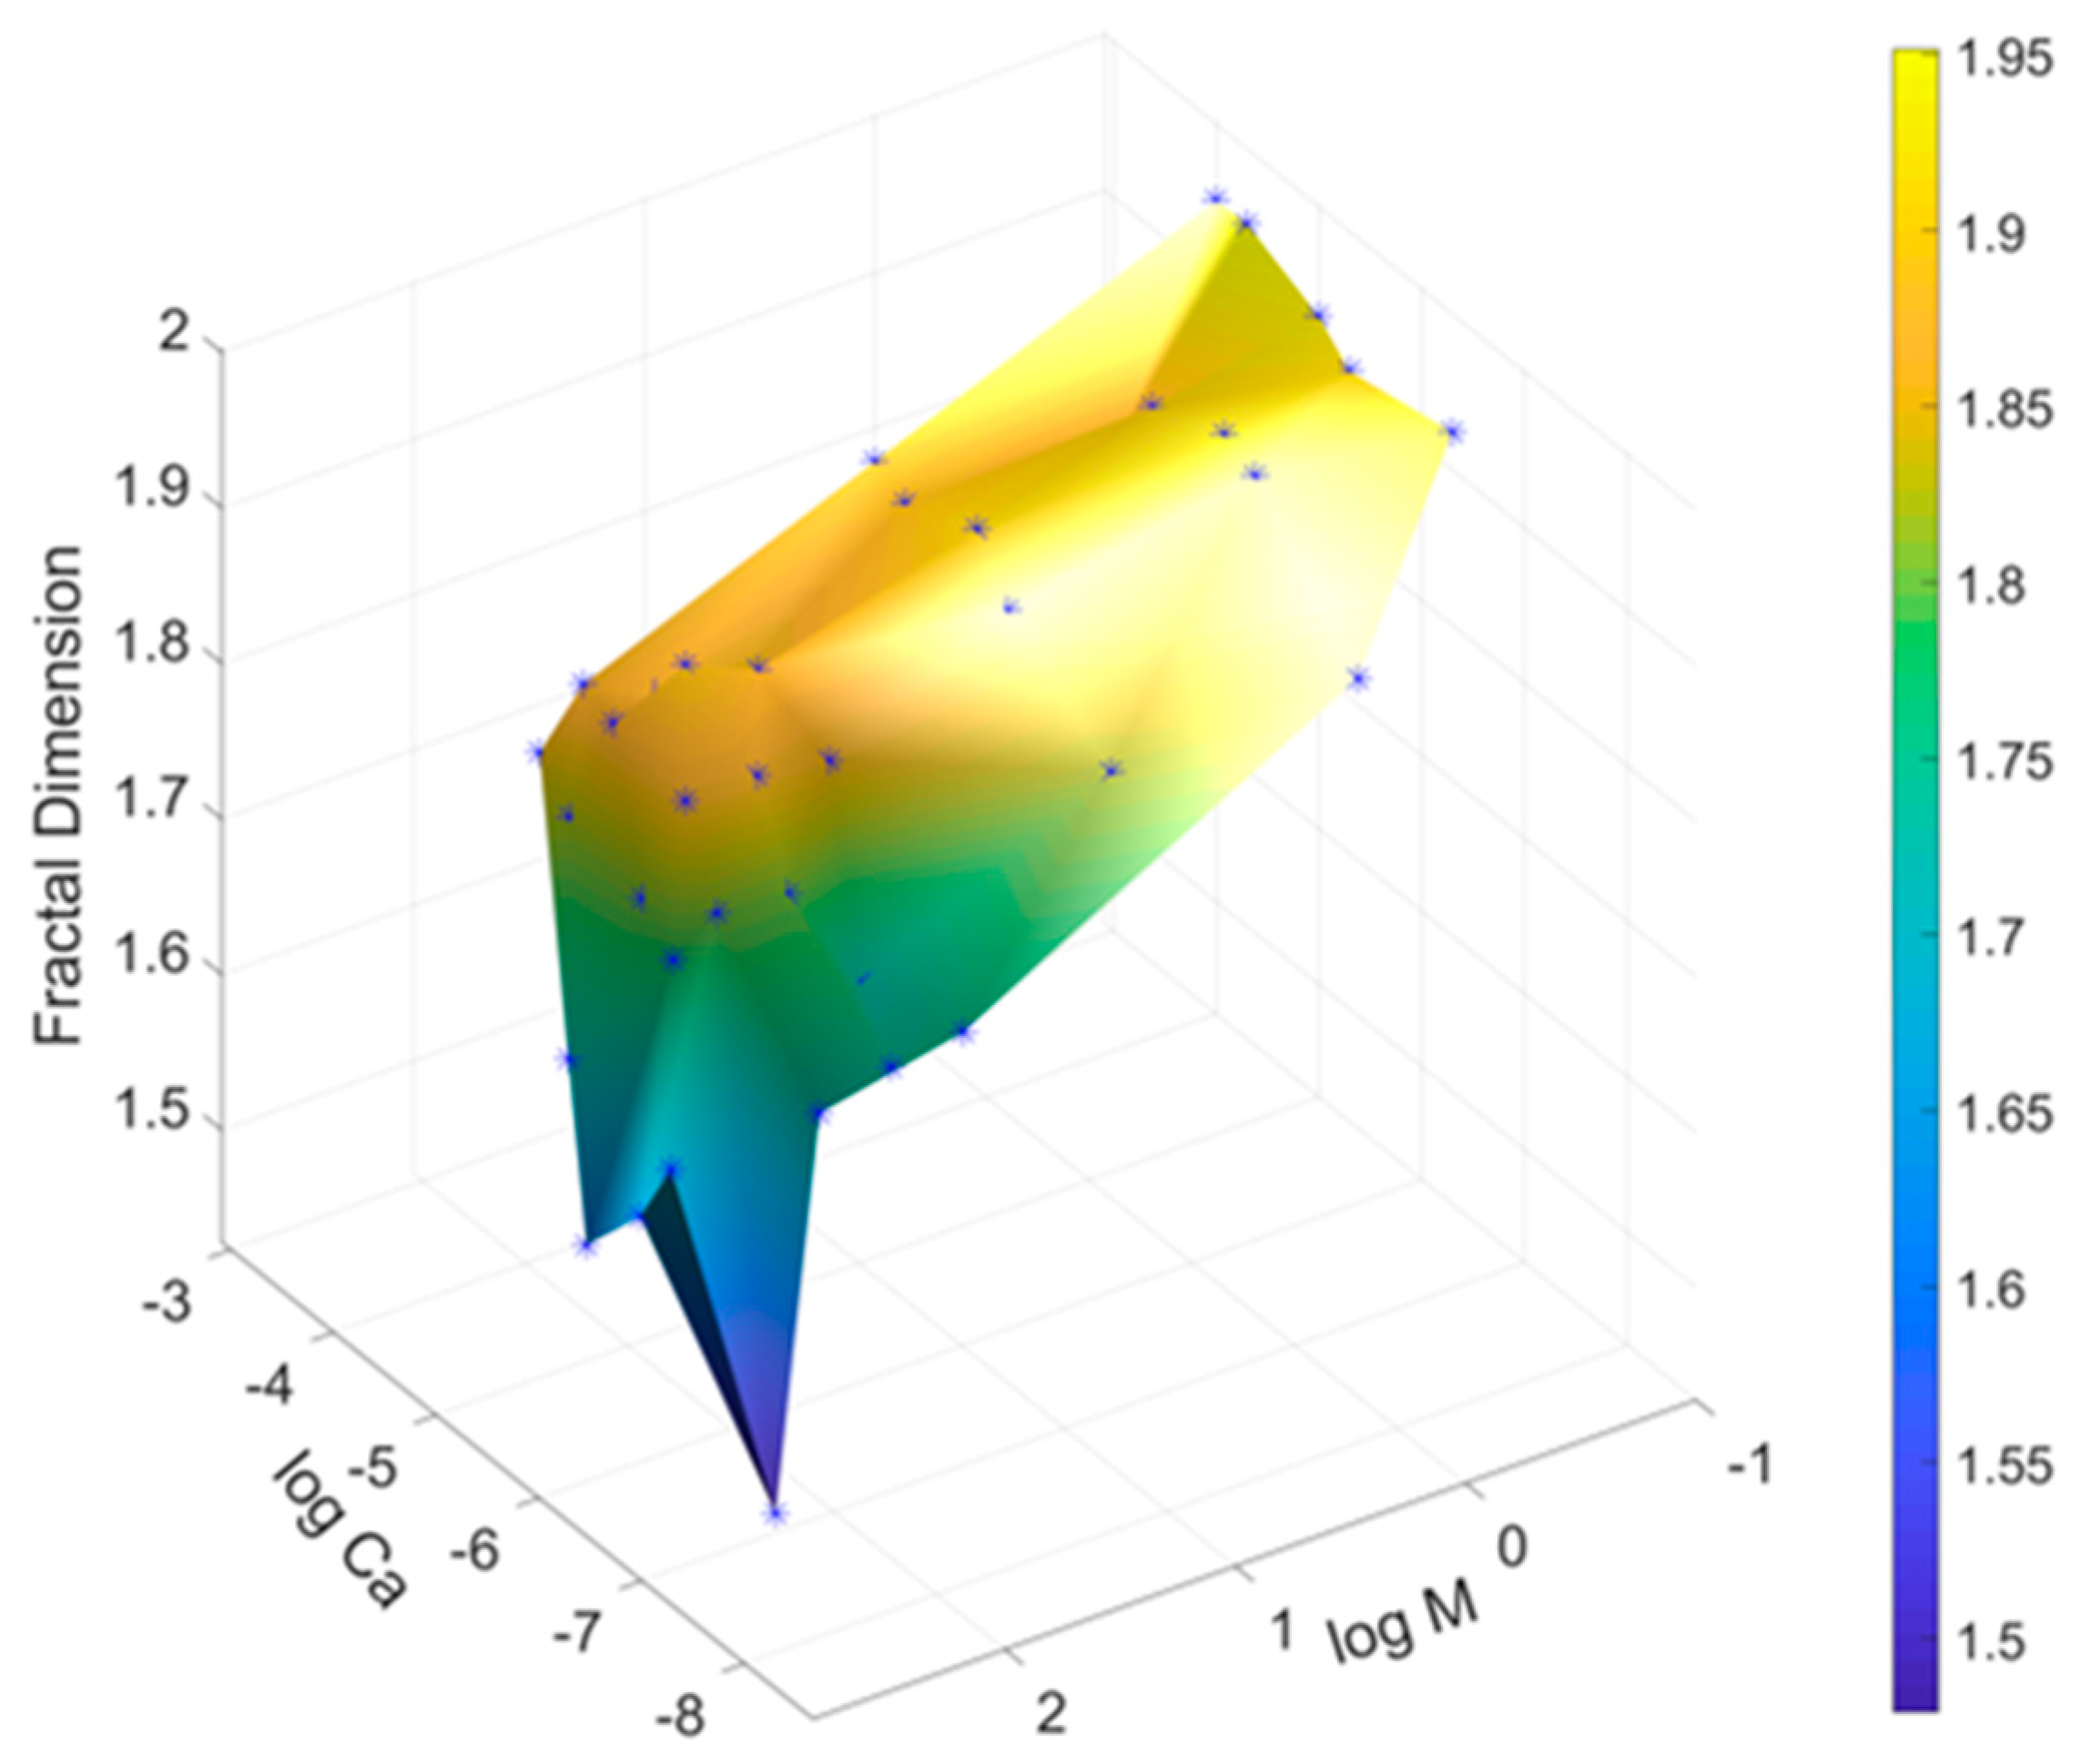
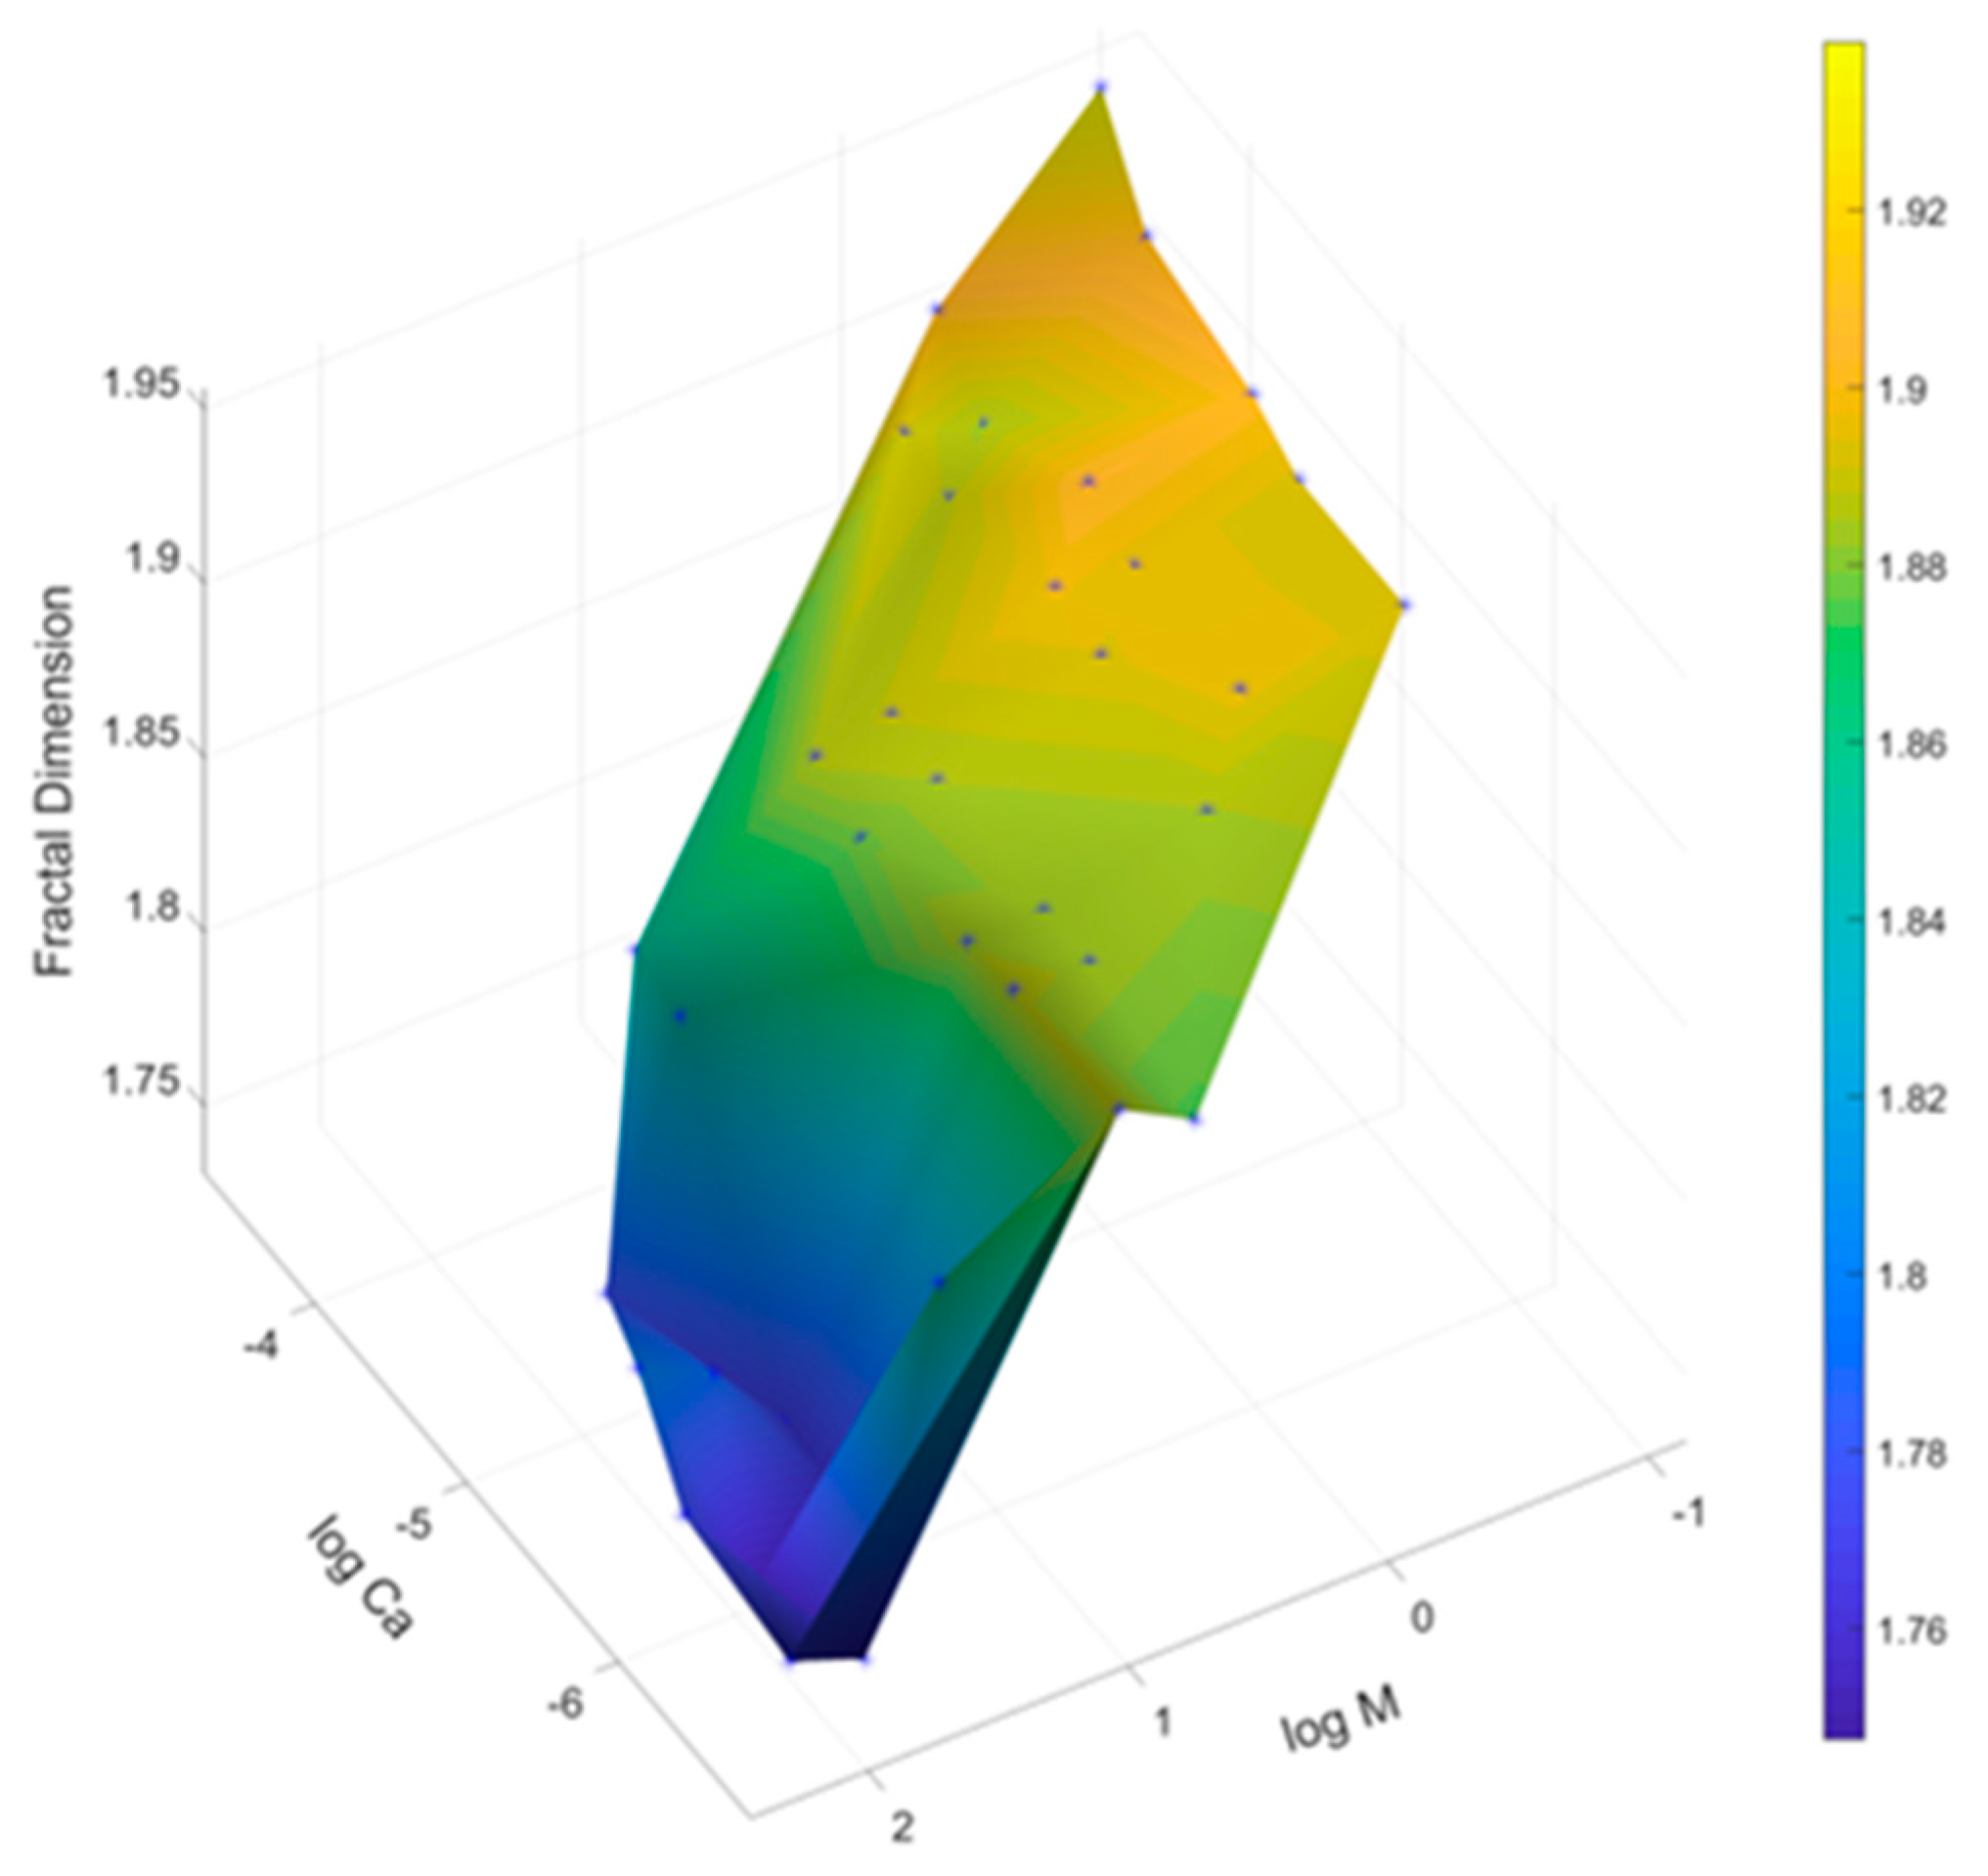
The fractal dimensions (Df) of the fronts prior to reaching the outlet are plotted as a function of log M and log Ca in Figure 4. The characteristic of Df that is of significance to flow regimes is its gradient; a sharp change in the gradient of Df corresponds to a transition between flow regimes. In this work, values of Df, along with images of phase saturation, are used to estimate the boundary locations for various flow regimes.
A phase diagram including boundaries for drainage displacement are shown on a log Ca − log M plot in Figure 5. These boundaries may be affected by pore size distribution and domain size [5,9,18]. In Figure 4, the low region corresponding to log M > 2.3, log Ca < −5.3 on the Df surface reflects the transition from capillary fingering regime to viscous fingering regime. The slope at approximately log M < −0.5 and log Ca > −4.3 appears to indicate the transition from stable displacement to transition regime. The low region at 0.7 < log M < 2 and log Ca > −6.6 on the Df surface corresponds to the change from capillary fingering to transition regime. The boundaries (red solid boxes) of various flow regimes for drainage displacement based on our microfluidic experiment study are shown in Figure 5.
3.1.2. Width of Stabilized Zone
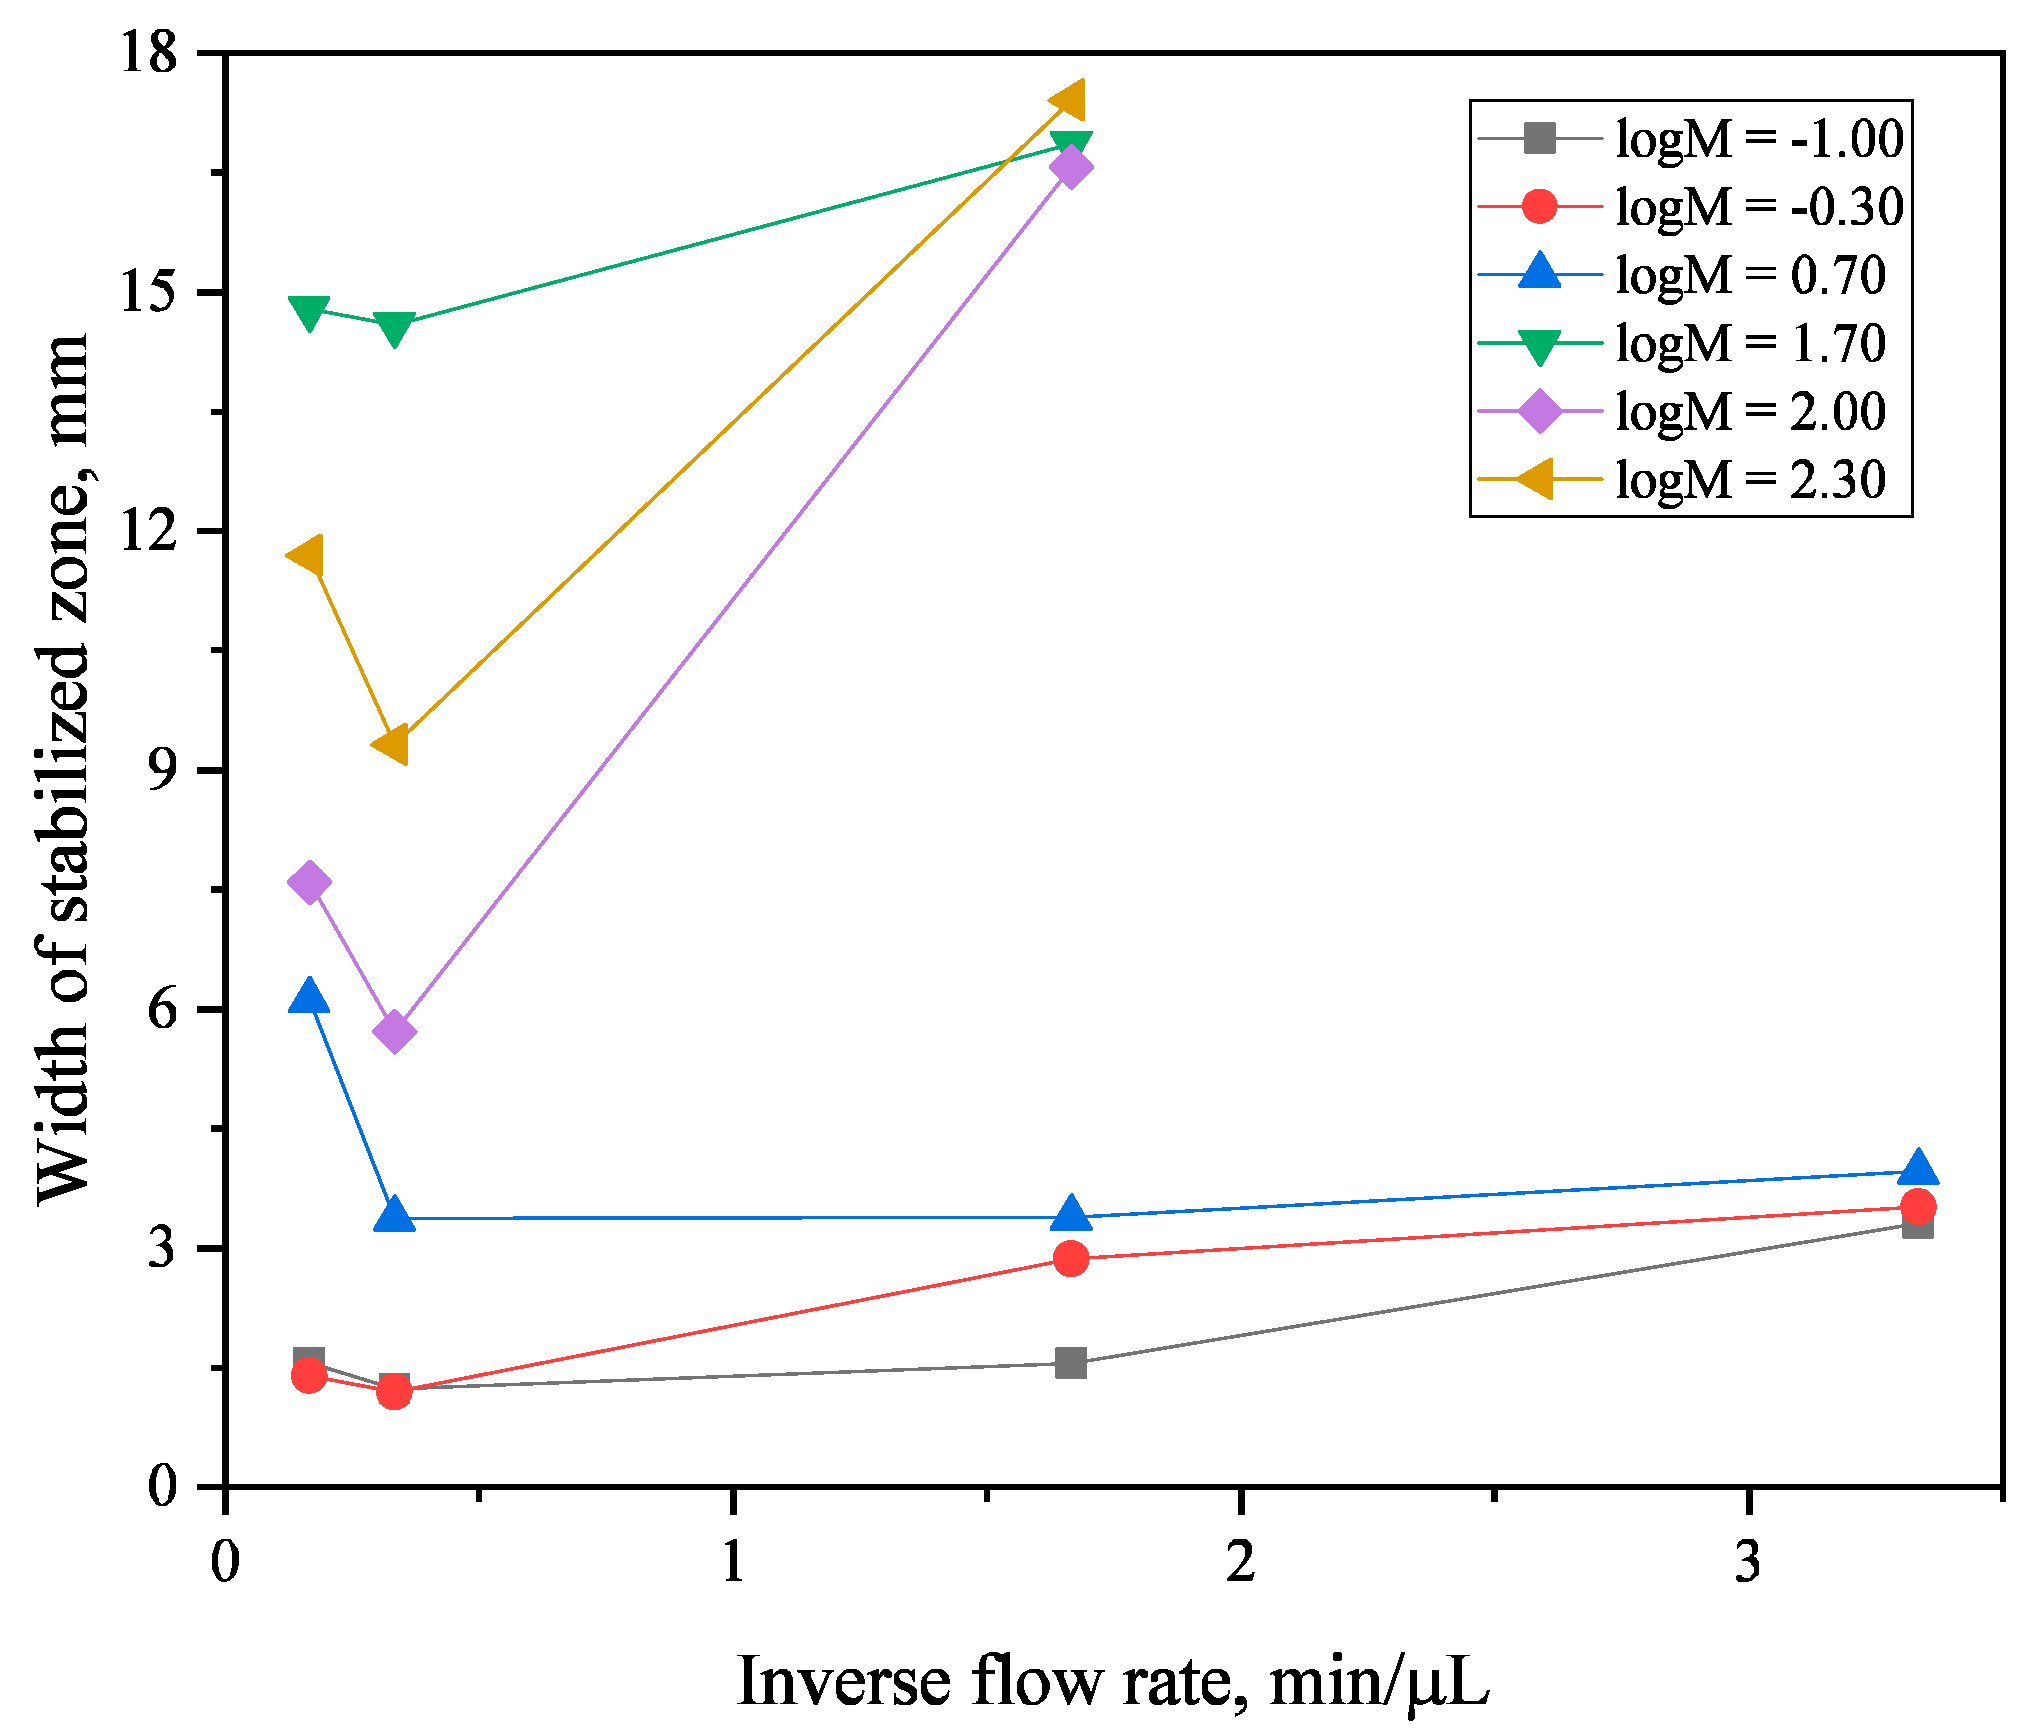
Rapoport et al. [28] proposed the concept of the stabilized zone, which is a quasi-steady region around the nonwetting/wetting displacement front that determines the transition between nonwetting and wetting fluids. Results from this study imply a linear relationship between the width of the stabilized zone and the injection rate in which the width appears to be decreasing inversely proportionally with the displacement velocity [27]. In our study, the width of the stabilized zone around the displacement front decreases when the injection rate is less than approximately 3 µL/min. After increasing the injection rate beyond 3 µL/min, the width of the stabilized zone begins to increase, see Figure 6. This observation is in agreement with results reported by Barenblatt et al. [27].
3.2. Imbibition
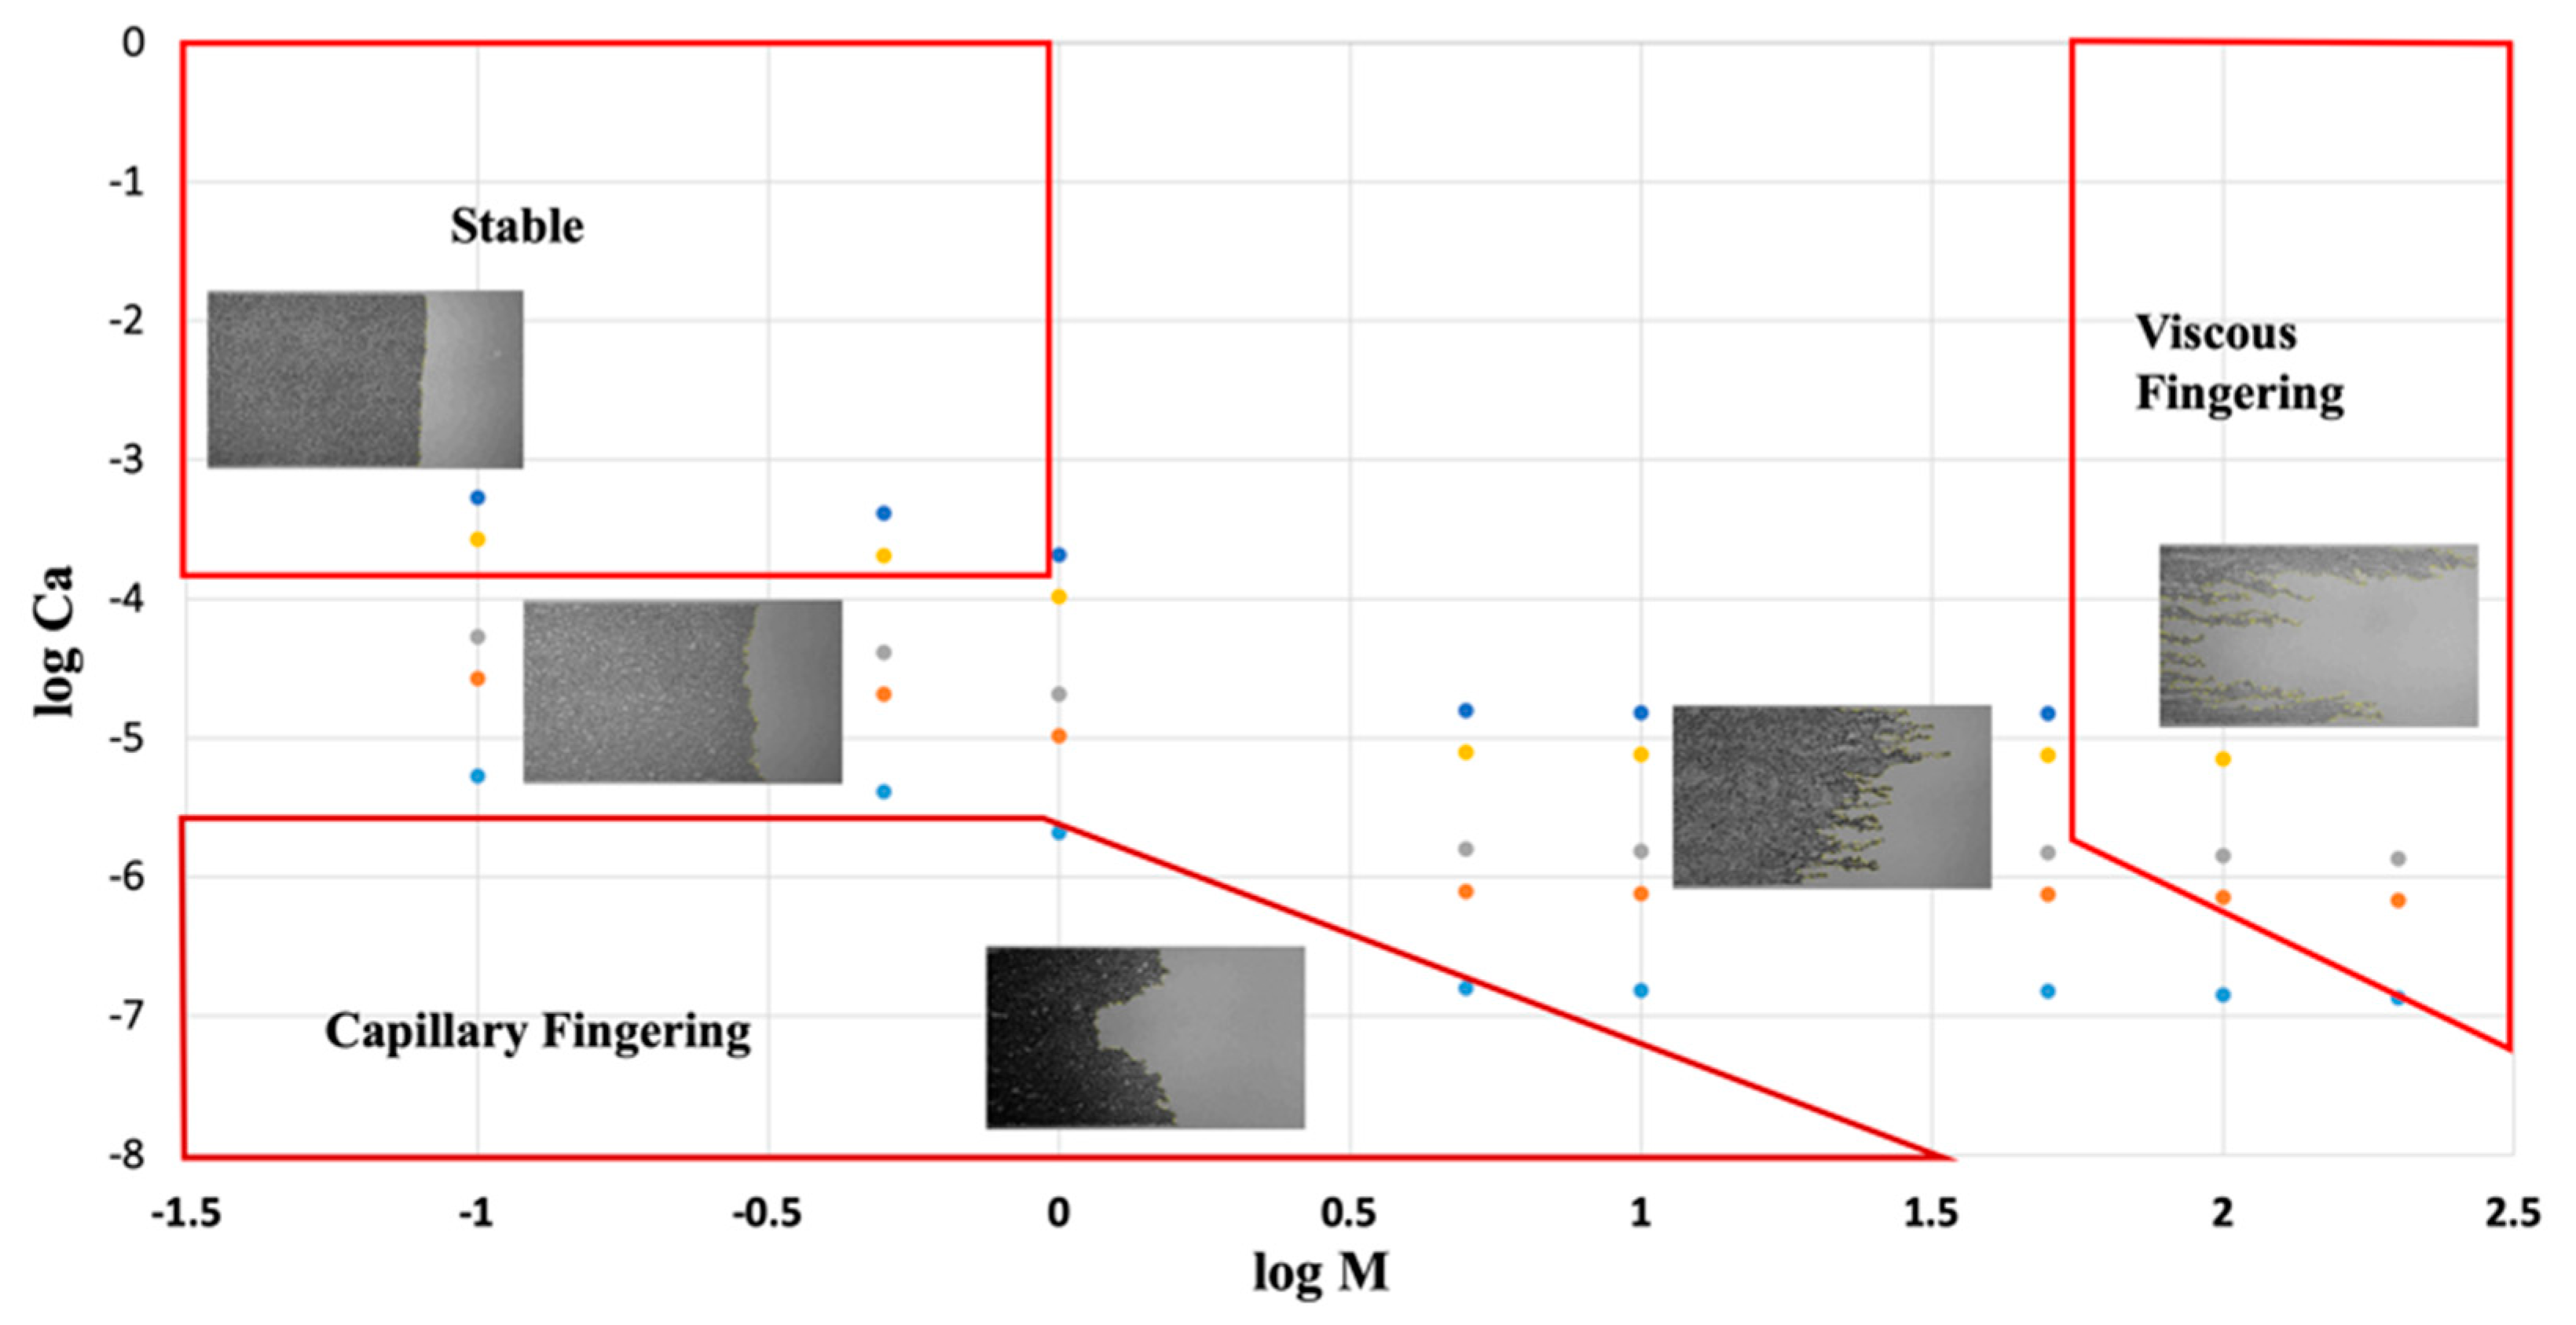
Recorded images of imbibition displacement fronts, Figure 7, show that when log M > 0, displacement fronts exhibit both viscous and capillary fingering patterns; viscous fingers appear to dominate at high Ca and capillary fingers seem to dominate low values of Ca [40]. At log Ca < −5.5 and log M < 1.5, capillary forces are significant, and the interconnected large capillary fingers appear to dominate the observed flow pattern. After breakthrough, these capillary fingers grow laterally and coalesce resulting in relatively large amounts of nonwetting fluid being entrapped in the pore network. At log Ca > −5.5 and log M > 1.5, viscous forces become comparable to capillary forces and several narrow-disconnected viscous fingers appear in the flow pattern. When log M < 0.0 log Ca > −4.0, the displacing front is relatively flat and little to no trapping of the wetting fluid is observed inside the porous medium; this behavior indicates a stable flow regime.
Displacement is affected by the geometry of the medium such as its aspect ratio. In imbibition, this may lead to the wetting phase flowing along corners when the pore centers are occupied with the nonwetting phase, along the wall roughness for strongly water-wet systems, or in the bulk of the channels, making the flow of the wetting phase potentially more complicated than that of the nonwetting phase [4,41]. This effect is observed by comparing imbibition and drainage phase distribution images, see Figure 3 and Figure 8.
Based on Lenormand’s study [42], there are three synergistic mechanisms that govern the flow behavior in imbibition: meniscus (interface) displacement, movement of the nonwetting fluid due to the displacement of the meniscus, and flow of the wetting fluid (injectant) from the inlet boundary to the meniscus. In this study, since the pore network is a representation of a thin section of a Berea sandstone, the aspect ratio between pores and channels vary, and thus, both pore invasion and collapse in a channel mechanism occur during the displacement.
Phase Diagram
The fractal dimension values for imbibition experiments are shown in Figure 9. Large gradient change of Df values correspond to transition of flow between different regimes. For instance, the slope on the surface between log M = −1.0 and log M = −0.3, and between log Ca = −3.3 and log Ca = −3.7, suggests that flow is transitioning away from the stable regime. A low region appears between log M = 0.0 and log M = 1.0 when log Ca is between −6.8 and −5.3, which may correspond to flow transitioning away from capillary fingering. There is a deep region on the surface when 1.7 < log M < 2, which may indicate flow transitioning to viscous fingering. Flow regime boundaries (red solid boxes, shown in Figure 10) for imbibition displacement are estimated based on values of Df (Figure 9) and images of fronts (Figure 8).
4. Conclusions
This study reports observation from a series of two-phase immiscible displacement experiments across a wide range of injection rates using a microfluidic device featuring a quasi-2D complex network of channels. The experiments were conducted across a relatively large range of a parameter space defined by viscosity ratio, M, and capillary number, Ca: log M = −1.0 to 4.2 and log Ca = −7.6 to −4.0 for drainage, and M = −1.0 to 2.3 and log Ca = −6.9 to −3.3 for imbibition.
Quantitative analysis, such as calculation of fractal dimension values of the displacement fronts, are made possible by the high-resolution images. In the absence of gravity effects, the interplay between capillary and viscous forces determine the character of flow patterns. The insights provided by the quantitative analysis provides a measure to approximate and delineate various flow regimes. Boundaries of various flow regimes are estimated for both drainage and imbibition based on phase distribution images and the fractal dimension values of the displacement fronts. The Df-log M-log Ca plots reveal that relatively large gradient changes of Df may correspond to a transition between different flow regimes. The observations from drainage displacement experiments are in relatively close agreement with flow regime boundaries suggested by Lenormand et al. [4]. In the drainage flow regime diagram, the regions that correspond with transitions between distinct flow regimes appear to constitute a slightly larger area of the overall diagram than inferred in literature from observations in homogenous media strictly consisting of uniformly spaced cylindrical pillars [5]. As is evident by the fractal dimension values, which is a measurement of the space filling capacity of a shape [43], stable flow regime fills the two-dimensional space of the medium more fully than regimes exhibiting fingering behavior; stable regimes displace the resident fluids uniformly and result in more efficient recovery of the resident fluids. On the other hand, both capillary and viscous fingering regimes develop fronts that bypass some of the resident fluid. The fingers in capillary dominated regime are dispersed and fill the two-dimensional space more fully; hence their fractal dimension values are higher compared to viscous dominated instabilities where few prominent fingers emerge and overtake all the smaller ones. As a result, displacement fronts in the viscous fingering regime have lower factual dimension values. Transition out of and into a flow regime is signified by a change in the character of the displacement front, i.e., a relatively uniform front in the stable viscous, a multitude of interconnected small fingers in capillary dominated, and few prominent ones in viscous fingering regime. The change is reflected in the gradient of the fractal dimension values in the two-dimensional parameter space of log Ca and log M: as a displacement transitions from one flow regime to another, there is a sharp change in the aforementioned gradient of fractal dimension values.
This study extends the available experimental data on two-phase immiscible displacement behavior using a water-wet microfluidic device, and the analysis and quantification of the space filling capacity of the displacement fronts help estimate the boundaries of various flow regimes in both imbibition and drainage. Flow regimes have significant implications in various multiphase flow in porous media applications, such as geologic storage of CO2 and recovery operations of petroleum reservoirs. In CO2 storage applications, flow regime affects storage capacity of the target formation. In subsurface petroleum systems, flow regimes affect recovery efficiency and recycling operational needs related to EOR processes.
Author Contributions
Conceptualization, S.A.A.; methodology, S.A.A.; formal analysis, S.A.A. and F.G.; investigation, F.G.; data curation, F.G.; writing—original draft preparation, F.G.; writing—review and editing, S.A.A.; visualization, F.G. and S.A.A.; supervision, S.A.A.; funding acquisition, S.A.A.
Funding
The corresponding author gratefully acknowledges the Donors of the American Chemical Society Petroleum Research Fund (55795-DNI9) for partial support of this research. The analysis and writing stages of this research were supported as part of the Center for Mechanistic Control of Water-Hydrocarbon-Rock Interactions in Unconventional and Tight oil Formations (CMC-UF), an Energy Frontier Research Center funded by the U.S. Department of Energy, Office of Science under DOE (BES) Award DE-SC0019165.
Acknowledgments
The corresponding author is grateful to Roland Horne and Cynthia Ross; the base image of the sandstone was created by Cynthia Ross for Roland Horne, who graciously shared it with the corresponding author.
Conflicts of Interest
The authors declare no conflict of interest. The funders had no role in the design of the study; in the collection, analyses, or interpretation of data; in the writing of the manuscript, or in the decision to publish the results.
Nomenclature
| Non-Dimensional Numbers: | |
| Ca | capillary number; vµ1/γ |
| M | viscosity ratio; µ2/µ1 |
| Df | fractal dimension |
| Acronyms and abbreviations: | |
| EOR | Enhanced oil recovery |
| Deionized | DI |
| Greek Letters: | |
| μ | dynamic viscosity, cp |
| γ | the interfacial tension, mN/m |
References
- Kenneth, C.C.; McDonald, K.; Marble, J.; Russo, A.E.; Brusseau, M.L. The Impact of Transitions between Two-Fluid and Three-Fluid Phases on Fluid Configuration and Fluid-Fluid Interfacial Area in Porous Media. Water Resour. Res. 2015, 51, 7189–7201. [Google Scholar]
- Isha, S.; Bedeaux, D.; Kjelstrup, S.; Vassvik, M.; Sinha, S.; Hansen, A. Ensemble Distribution for Immiscible Two-Phase Flow in Porous Media. Phys. Rev. 2017, 95, 023116. [Google Scholar]
- Lincoln, P. Diffusion-Limited Aggregation and Two-Fluid Displacements in Porous Media. Phys. Rev. Lett. 1984, 52, 1621–1624. [Google Scholar]
- Roland, L. Liquids in Porous Media. J. Phys. Condens. Matter 1990, 2, 79–88. [Google Scholar]
- Changyong, Z.; Oostrom, M.; Wietsma, T.W.; Grate, J.W.; Warner, M.G. Influence of Viscous and Capillary Forces on Immiscible Fluid Displacement: Pore-Scale Experimental Study in a Water-Wet Micromodel Demonstrating Viscous and Capillary Fingering. Energy Fuels 2011, 25, 3493–3505. [Google Scholar]
- Gvirtzman, H.; Roberts, P.V. Pore Scale Spatial Analysis of Two Immiscible Fluids in Porous Media. Water Resour. Res. 1991, 27, 1165–1176. [Google Scholar] [CrossRef]
- Grate, J.W.; Changyong, Z.; Wietsma, T.W.; Warner, M.G.; Anheier, N.C.; Bernacki, B.E.; Orr, G.; Oostrom, M. A Note on the Visualization of Wetting Film Structures and a Nonwetting Immiscible Fluid in a Pore Network Micromodel Using a Solvatochromic Dye. Water Resour. Res. 2010, 46, 11602–11608. [Google Scholar] [CrossRef]
- Lenormand, R.; Zarcone, C.; Sarr, A. Mechanisms of the Displacement of One Fluid by Another in a Network of Capillary Ducts. J. Fluid Mech. 1983, 135, 337–353. [Google Scholar] [CrossRef]
- Lenormand, R.; Touboul, E. Numerical Models and Experiments on Immiscible Displacements in Porous Media. J. Fluid Mech. 1988, 189, 165–187. [Google Scholar] [CrossRef]
- Wang, Y.; Changyong, Z.; Ning, W.; Oostrom, M.; Wietsma, T.W.; Li, X.; Bonneville, A. Experimental Study of Crossover from Capillary to Viscous Fingering for Supercritical CO2–Water Displacement in a Homogeneous Pore Network. Environ. Sci. Technol. 2012, 47, 212–218. [Google Scholar] [CrossRef]
- Lenormand, R. Differents Mecanismes de Deplacements Visqueux et Cspillaires en Milieu Poreux: Diagramme De Phase; Gauthier-Villars: Paris, France, 1985; Volume 301. [Google Scholar]
- Schwille, F.; Pankow, J.F. Dense Chlorinated Solvents in Porous and Fractured Media-Model Experiments; Lewis Publishers: Chelsea, MI, USA, 1988. [Google Scholar]
- Changyong, Z.; Oostrom, M.; Grate, J.W.; Wietsma, T.W.; Warner, M.G. Liquid CO2 Displacement of Water in a Dual-Permeability Pore Network Micromodel. Environ. Sci. Technol. 2011, 45, 7581–7588. [Google Scholar]
- Chomsurin, C.; Werth, C.J. Analysis of Pore-Scale Nonaqueous Phase Liquid Dissolution in Etched Silicon Pore Networks. Water Resour. Res. 2003, 39, 1265–1276. [Google Scholar] [CrossRef]
- Werth, C.J.; Changyong, Z.; Brusseau, M.L.; Oostrom, M.; Baumann, T. A Review of Non-Invasive Imaging Methods and Applications in Contaminant Hydrogeology Research. J. Contam. Hydrol. 2010, 113, 1–24. [Google Scholar] [CrossRef]
- Riazi, M.; Sohrabi, M.; Bernstone, C.; Jamiolahmady, M.; Ireland, S. Visualisation of Mechanisms Involved in CO2 Injection and Storage in Hydrocarbon Reservoirsand Water-Bearing Aquifers. Chem. Eng. Res. Des. 2011, 89, 1827–1840. [Google Scholar] [CrossRef]
- Kim, Y.; Wan, J.; Kneafsey, T.J.; Tokunaga, T.K. Dewetting of Silica Surfaces Upon Reactions with Supercritical CO2 and Brine: Pore-Scale Studies in Micromodels. Environ. Sci. Technol. 2012, 46, 4228–4235. [Google Scholar] [CrossRef]
- Liu, H.; Valocchi, A.J.; Kang, Q.; Werth, C. Pore-Scale Simulations of Gas Displacing Liquid in a Homogeneous Pore Network Using the Lattice Boltzmann Method. Trans. Porous Media 2013, 99, 555–580. [Google Scholar] [CrossRef]
- Ferer, M.; Ji, C.; Bromhal, G.S.; Cook, J.; Ahmadi, G.; Smith, D.H. Crossover from Capillary Fingering to Viscous Fingering for Immiscible Unstable Flow: Experiment and Modeling. Phys. Rev. 2004, 70, 016303. [Google Scholar] [CrossRef]
- Rabbani, H.S.; Or, D.; Liu, Y.; Lai, C.-Y.; Lu, N.B.; Datta, S.S.; Stone, H.A.; Shokri, N. Suppressing Viscous Fingering in Structured Porous Media. Proc. Natl. Acad. Sci. USA 2018, 115, 4833–4838. [Google Scholar] [CrossRef]
- Cottin, C.; Bodiguel, H.; Colin, A. Drainage in Two-Dimensional Porous Media: From Capillary Fingering to Viscous Flow. Phys. Rev. 2010, 82, 046315. [Google Scholar] [CrossRef]
- Feng, G.; He, J.; Johnson, P.A.; Aryana, S.A. Stabilization of CO2 Foam Using by-Product Fly Ash and Recyclable Iron Oxide Nanoparticles to Improve Carbon Utilization in Eor Processes. Sustain. Energy Fuels 2017, 1, 814–822. [Google Scholar]
- Guo, F.; Aryana, S.A. An Experimental Investigation of Nanoparticle-Stabilized CO2 Foam Used in Enhanced Oil Recovery. Fuel 2016, 186, 430–442. [Google Scholar] [CrossRef]
- Alaskar, M. In-Situ Multifunctional Nanosensors for Fractured Reservoir Characterization. Ph.D. Thesis, Stanford University, Stanford, CA, USA, 2013. [Google Scholar]
- Alaskar, M.; Li, K.; Horne, R. Influence of Particle Size on Its Transport in Discrete Fractures: Pore-Scale Visualization Using Micromodels. In Proceedings of the Thirty-Eighth Workshop on Geothermal Reservoir Engineering, Stanford, CA, USA, 11–13 February 2013. [Google Scholar]
- Aryana, S.A.; Kovscek, A.R. Experiments and Analysis of Drainage Displacement Processes Relevant to Carbon Dioxide Injection. Phys. Rev. 2012, 86, 066310. [Google Scholar] [CrossRef]
- Barenblatt, G.I.; Patzek, T.W.; Silin, D.B. The Mathematical Model of Nonequilibrium Effects in Water-Oil Displacement. SPE J. 2003, 8, 409–416. [Google Scholar] [CrossRef]
- Rapoport, L.A.; Leas, W.J. Properties of Linear Waterfloods. J. Pet. Technol. 1953, 5, 139–148. [Google Scholar] [CrossRef]
- U.S. Energy Information Administration. Oil and Natural Gas Resource Categories Reflect Varying Degrees of Certainty. Available online: www.eia.gov/todayinenergy/detail.php?id=17151. (accessed on 14 March 2019).
- Liu, Y.; Pengfei, L.v.; Yao, L.; Lanlan, J.; Tetsuya, S.; Song, Y.; Wu, B.; Liu, S. CO2/Water Two-Phase Flow in a Two-Dimensional Micromodel of Heterogeneous Pores and Throats. RSC Adv. 2016, 6, 73897–73905. [Google Scholar] [CrossRef]
- Wang, Y.; Aryana, S.A.; Furtado, F.; Ginting, V. Analysis of Nonequilibrium Effects and Flow Instability in Immiscible Two-Phase Flow in Porous Media. Adv. Water Resour. 2018, 122, 291–303. [Google Scholar] [CrossRef]
- Aryana, S.A.; Kovscek, A.R. Nonequilibrium Effects and Multiphase Flow in Porous Media. Trans. Porous Media 2013, 97, 373–394. [Google Scholar] [CrossRef]
- Guo, F.; Aryana, S.A. Improved Sweep Efficiency Due to Foam Flooding in a Heterogeneous Microfluidic Device. J. Pet. Sci. Eng. 2018, 164, 155–163. [Google Scholar] [CrossRef]
- Ren, G.; Rafiee, J.; Aryana, S.A.; Younis, R.M. A Bayesian Model Selection Analysis of Equilibrium and Nonequilibrium Models for Multiphase Flow in Porous Media. Int. J. Multiph. Flow 2017, 89, 313–320. [Google Scholar] [CrossRef]
- Majhi, S.; Al-Otaibi, B.; Al-Omair, S.; Abdullah, M.B. Mitigating Water Recycling in a Heterogeneous Carbonate Reservoir. In SPE Kuwait Oil and Gas Show and Conference; Society of Petroleum Engineers: Mishref, Kuwait, 2015. [Google Scholar]
- Lv, W.; Siyu, Y.; Yongzhi, Y.; Shenglai, Y.; Xiaohong, M.; Li, S.; Wu, C.; Hao, M. Produced Gas Utilisation Strategy Study on Low Permeability Reservoir CO2 Eor Process. In SPE Asia Pacific Oil & Gas Conference and Exhibition; Society of Petroleum Engineers: Perth, Australia, 2016. [Google Scholar]
- Belhaj, H. Management of Injected Nitrogen into a Gas Condensate Reservoir. Ngeniería Investig. 2016, 36, 52–61. [Google Scholar] [CrossRef]
- Liu, H.; Yonghao, Z.; Valocchi, A.J. Lattice Boltzmann Simulation of Immiscible Fluid Displacement in Porous Media: Homogeneous Versus Heterogeneous Pore Network. Phys. Fluids 2015, 27, 052103. [Google Scholar] [CrossRef]
- Yamabe, H.; Takeshi, T.; Liang, Y.; Matsuoka, T. Influence of Fluid Displacement Patterns on Seismic Velocity During Supercritical CO2 Injection: Simulation Study for Evaluation of the Relationship between Seismic Velocity and CO2 Saturation. Int. J. Greenh. Gas Control 2016, 46, 197–204. [Google Scholar] [CrossRef]
- Tsakiroglou, C.D.; Theodoropoulou, M.; Karoutsos, V.; Papanicolaou, D.; Sygouni, V. Experimental Study of the Immiscible Displacement of Shear-Thinning Fluids in Pore Networks. J. Coll. Interf. Sci. 2003, 267, 217–232. [Google Scholar] [CrossRef]
- Chang, L.-C.; Tsai, J.-P.; Shan, H.-Y.; Chen, H.-H. Experimental Study on Imbibition Displacement Mechanisms of Two-Phase Fluid Using Micro Model. Environ. Earth Sci. 2009, 59, 901. [Google Scholar] [CrossRef]
- Lenormand, R.; Zarcone, C. Role of Roughness and Edges During Imbibition in Square Capillaries. In SPE Annual Technical Conference and Exhibition; Society of Petroleum Engineers: Houston, TX, USA, 1984. [Google Scholar]
- Falconer, K. Fractal Geometry: Mathematical Foundations and Applications; John Wiley & Sons: West Sussex, UK, 2004. [Google Scholar]
Figure 1.
Microfluidic displacement experimental setup.

Figure 2.
Image of displacement fronts in drainage experiments.

Figure 3.
An image of nonwetting fluids (white) displacing wetting fluids (black) in the microfluidic device.
Figure 3.
An image of nonwetting fluids (white) displacing wetting fluids (black) in the microfluidic device.

Figure 4.
Drainage fractal dimension versus log M and log Ca.

Figure 5.
Drainage flow phase diagram. The solid (red) boxes are based on our results; the shaded areas are based on work by Zhang et al. [5]; the dot-dash line is based on the study by Liu et al. [38]; and regimes delineated with dashed lines are based on work by Lenormand et al. [9].

Figure 6.
Relation between the width of the stabilized zone of the interfaces and the inverse flow rates in drainage displacement.
Figure 6.
Relation between the width of the stabilized zone of the interfaces and the inverse flow rates in drainage displacement.

Figure 7.
Image of displacement fronts in imbibition experiments.

Figure 8.
An image of wetting fluids (black) displacing nonwetting fluids (white) in the microfluidic device.
Figure 8.
An image of wetting fluids (black) displacing nonwetting fluids (white) in the microfluidic device.

Figure 9.
Imbibition fractal dimension with respect to log M and log Ca.

Figure 10.
Imbibition flow phase diagram with boundaries of three flow regimes (red boxes).


Table 1.
Drainage experiments fluids.
| µ1, cp | Nonwetting Fluids | µ2, cp | Wetting Fluids | M | Interfacial Tension γ, mN/m |
|---|---|---|---|---|---|
| 10 | Pentane + Hydrobrite 550PO | 1 | Water | 0.1 | 49.26 |
| 2 | Pentane + Carnation | 1 | Water | 0.5 | 43.79 |
| 2 | Pentane + Carnation | 10 | Water + Glycerol | 5 | 30.10 |
| 0.24 | Pentane | 12 | Water + Glycerol | 50 | 22.99 |
| 0.24 | Pentane | 24 | Water + Glycerol | 100 | 21.56 |
| 0.24 | Pentane | 48 | Water + Glycerol | 200 | 20.55 |
| 0.24 | Pentane | 72 | Water + Glycerol | 300 | 19.22 |
| 0.015 | CO2 | 10 | Water + Glycerol | 680.3 | 70.60 |
| 0.015 | CO2 | 200 | Water + Glycerol | 13,605.4 | 42.90 |
Table 2.
Imbibition experiments fluids.
| µ1, cp | Wetting Fluids | µ2, cp | Nonwetting Fluids | M | Interfacial Tension γ, mN/m |
|---|---|---|---|---|---|
| 2.4 | Pentane + Carnation | 24 | Water + Glycerol | 0.1 | 22.48 |
| 12 | Pentane + Carnation | 24 | Water + Glycerol | 0.5 | 29.20 |
| 12 | Pentane + Carnation | 12 | Water + Glycerol | 1 | 28.90 |
| 5 | Pentane + Carnation | 1 | Water | 5 | 31.63 |
| 10 | Pentane + Carnation | 1 | Water | 10 | 32.84 |
| 50 | Pentane + Hydrobrite 550PO | 1 | Water | 50 | 33.27 |
| 100 | Pentane + Hydrobrite 550PO | 1 | Water | 100 | 35.25 |
| 200 | Pentane + Hydrobrite 550PO | 1 | Water | 200 | 37.01 |
© 2019 by the authors. Licensee MDPI, Basel, Switzerland. This article is an open access article distributed under the terms and conditions of the Creative Commons Attribution (CC BY) license (http://creativecommons.org/licenses/by/4.0/).
Share and Cite
MDPI and ACS Style
Guo, F.; Aryana, S.A. An Experimental Investigation of Flow Regimes in Imbibition and Drainage Using a Microfluidic Platform. Energies 2019, 12, 1390. https://doi.org/10.3390/en12071390
AMA Style
Guo F, Aryana SA. An Experimental Investigation of Flow Regimes in Imbibition and Drainage Using a Microfluidic Platform. Energies. 2019; 12(7):1390. https://doi.org/10.3390/en12071390
Chicago/Turabian StyleGuo, Feng, and Saman A. Aryana. 2019. "An Experimental Investigation of Flow Regimes in Imbibition and Drainage Using a Microfluidic Platform" Energies 12, no. 7: 1390. https://doi.org/10.3390/en12071390
Note that from the first issue of 2016, this journal uses article numbers instead of page numbers. See further details here.