
Use of Gas Adsorption and Inversion Methods for Shale Pore Structure Characterization


Department of Chemical Engineering, University of Wyoming, Laramie, WY 82071, USA
*
Author to whom correspondence should be addressed.
Energies 2021, 14(10), 2880; https://doi.org/10.3390/en14102880
Submission received: 4 April 2021
/
Revised: 6 May 2021
/
Accepted: 10 May 2021
/
Published: 17 May 2021
(This article belongs to the Special Issue Multiscale and Multiphysics Processes in Unconventional Formations 2021)
Abstract
:The analysis of porosity and pore structure of shale rocks has received special attention in the last decades as unconventional reservoir hydrocarbons have become a larger parcel of the oil and gas market. A variety of techniques are available to provide a satisfactory description of these porous media. Some techniques are based on saturating the porous rock with a fluid to probe the pore structure. In this sense, gases have played an important role in porosity and pore structure characterization, particularly for the analysis of pore size and shapes and storage or intake capacity. In this review, we discuss the use of various gases, with emphasis on N2 and CO2, for characterization of shale pore architecture. We describe the state of the art on the related inversion methods for processing the corresponding isotherms and the procedure to obtain surface area and pore-size distribution. The state of the art is based on the collation of publications in the last 10 years. Limitations of the gas adsorption technique and the associated inversion methods as well as the most suitable scenario for its application are presented in this review. Finally, we discuss the future of gas adsorption for shale characterization, which we believe will rely on hybridization with other techniques to overcome some of the limitations.
1. Introduction
Shale rocks have received special attention since they arose as an important source of hydrocarbons as well as for their potential for decades ahead [1,2,3]. Although characterizing shale is not new, the most significant efforts were originally devoted to the understanding of their characteristics in conventional basins, where they play a role in wellbore stability or as sealing rocks [4,5,6]. For shale reservoirs, the need for a deeper understanding of the rock properties and their economic viability have become the most important research targets. Different factors can determine if a shale reservoir is economically viable. Among them, the quality and quantity of the organic matter (OM), mineralogy, brittleness, and petrophysical properties such as porosity, including pore structure, and permeability are the most relevant [7,8]. Therefore, laboratory analysis methods to estimate and evaluate these properties are in demand. Several techniques have been borrowed from those used for characterization of conventional reservoirs. However, the complexity of shales requires adaptation of these techniques, the incorporation of analysis methods from other fields as well as the implementation of new technologies [7,9]. It is worth noticing that even though all properties/characteristics of shale relate to one another, there is no established protocol that would allow their combined analysis.
Organic matter plays an important role in the evaluation of a shale reservoir, as it relates to the kerogen and the hydrocarbons in the rock. Generally, thermal maturity, related to vitrinite reflectance, the type of kerogen and the mass percentage also known as Total Organic Carbon (TOC), are key features that can determine the quality of a reservoir [2,7,8,10]. Productive reservoirs have been observed to have kerogen types I, II and II, with a TOC (%) greater than 2% and a vitrinite reflectance greater than 1.2. The analysis of these properties is not new, since these rocks were originally studied as source rocks [11,12,13,14]. To analyze the organic component of the reservoir, several techniques are used, e.g., the type of kerogen commonly classified through Rock-Eval pyrolysis analysis and the hydrogen index/oxygen index, combustion infrared detection used for TOC determination and microscopy used for the determination of vitrinite reflectance [9,10,15,16].
In quite a few cases, the inorganic component of the rock in shale reservoirs frequently differs from that in conventional reservoir. However, its relative high content of clay minerals has been the reason to classify them as “mudstones” [17]. The rock mineral analysis often relies on X-Ray Diffraction (XRD) and X-Ray Fluorescence (XRF) [7,9,18,19,20,21,22,23]. These two techniques can provide a detailed description of the minerals in the rock, though they are typically semi-quantitative techniques regarding their ability to determine mass percentages, depending on the processing method used. There are also physical or mechanical properties related to the inorganic component of the rock, a list that includes strength, elasticity, and extensional and compressive strength among others [24,25].
Although many properties of shale reservoirs are relevant and cross-correlated, the growing literature on shales in the last decade shows that petrophysical properties remain of special interest and play a determinant role in understanding unconventional systems [26,27,28,29,30,31,32,33,34,35]. It is fair to say that petrophysics is responsible for differentiating a shale from a conventional reservoir, e.g., permeabilities are often in the nano or millidarcies regime and the porosity often has a significant representation in the micro and mesopore regions. Most studies in the literature also provide information regarding the dependence of the petrophysical properties on shale characteristics as inorganic and organic phases. The term petrophysical properties can include different rock characteristics, but its analysis mainly focuses on permeability and porosity, and several methods are available to study them. The analysis of shale permeability remains, to an extent, like the analysis of conventional rocks such as sandstones and carbonates. Some of the most used techniques include Mercury Intrusion Porosimetry (MIP) and the use of different gases and differential pressure, while most of the techniques to estimate permeability rely on the use of Darcy’s law. Although permeability has been widely studied, it still represents a challenge as shown by several works in the literature [36,37,38,39,40,41,42].
Porosity and pore architecture [43] are as important for a shale reservoir as permeability is. The study of shales pore structure has received special attention due to the complexity observed in this type of rock matrix. Even though shale reservoirs can contain fractures, microfractures, and large pores, a significant fraction of the porosity in shale is in the nanometer range and often gets expressed through heterogeneities throughout the reservoir. The nanopores in shales have been classified in different ways. According to the IUPAC [44], pores in the nanometer regime can be divided into micropores (<2 nm), mesopores (between 2 and 50 nm), and macropores (>50 nm). Due to the significant fraction of nanoporosity in shale, the search for techniques that allow the analysis of the pore structure at this scale has become prevalent. According to Anovitz et al., 2015 [45], there are several methods available, often classified as radiation methods such as optical microscopy, SEM, AFM, TEM, FID-SEM, and SANS/USANS SAX. In contrast, the so-called saturation, or fluid-based methods, such as Mercury Intrusion Porosimetry and Helium Pycnometry, are also available. The saturation methods list includes the gas adsorption category, which implies the use of a variety of gases, e.g., N2 and CO2, CH4, Ar.
Gas adsorption includes the execution of static and dynamic experiments. The dynamic experiments are often used for the analysis of flow properties (permeability). On the other hand, the static experiments are related to the determination of storage capacity and pore architecture characterizations. Significant efforts related to gas adsorption has been made to understand the behavior of gases such as, CO2 and CH4, in the complex shale porous media [46,47]. The analysis of these of these gases is related to the fact that CO2 is an environmental solution for formation stimulation and CH4 is the most produced gas from unconventional reservoirs. However, the use this technique for pore architecture characterization reflects some problems and less progress. Therefore, this is the main scope for this review. Gas adsorption has been widely used for shale pore structure characterization over the last decade. Some work on the use of this technique can be traced back to the late 1960s and 1970s [48,49,50]. However, this method was not originally designed for the analysis of shale but for the analysis of mesoporous materials widely used in the chemical engineering field (e.g., zeolites and carbons). The advantage of the use of gas adsorption relies on its relatively low cost and its ability to provide useful information regarding pore architecture and a description of the pore structure (pore-size distribution). However, the fidelity of this method to describe a porous medium relies on the selected inversion methods. Whereas classical methods include the use of BET (Brunauer–Emmett–Teller) for surface area and BJH (Barrett–Joyner–Halenda) for pore-size distribution methods or FFH (Frenkel–Halsey–Hill) for fractal dimension analysis, more advanced interpretation techniques involve the use of DFT (Density Functional Theory), NLDFT (Non-Local Density Functional Theory), Molecular Dynamics and Montecarlo simulations. Although gas adsorption and the associated inversion methods have been widely used and accepted, the available literature does not reflect efforts to improve the performance on the technique or an agreement regarding the selection of an adsorbate or an inversion method, specifically for shale pore architecture characterization. We collated a significant fraction of the available literature (200+ published works) in the past 10 years to draw the main directions on shale characterization. The search of the available literature was performed mainly through Web of Science database, using keywords such as: shale, unconventional, gas adsorption, physisorption, pore structure, pore structure characterization, pore size distribution, nitrogen (N2), carbon dioxide (CO2), argon (Ar), krypton (Kr). The obtained list of references was sorted out to fit the scope of this review. Some additional works from other databases were considered due to the importance for the review.
The main purpose is to guide the selection of gas adsorption toward pore structure characterization of shale systems and the available inversion methods and the objective of this review is threefold. First, we summarize the state of the art and the theory behind gas adsorption in the context of shale rock. This serves to highlight advantages of these techniques in contrast with other characterization methods used for this type of rock. We also describe drawbacks that derive either from the technique itself or the interpretation methods. Second, we provide a potential workflow to assist users of the technique to select combinations of gases that offer the best potential to draw information on the rock system, in our opinion. Thirdly and finally, we speculate on potential improvements that could potentially resolve some of the issues associated with the use of these techniques, including hybridization with other techniques. In this sense, the article is organized the following way. We start by providing a brief description of the adsorption mechanism on a solid surface and summarize the theory behind physisorption. Then, we include a description of the most used gases for shale characterization, followed by the most used inversion method to describe the pore architecture. Finally, we include a discussion regarding the advantages and drawbacks of gas adsorption with respect to other techniques and posit our ideas of where the future of the technique could be.
2. Adsorption Mechanisms
The determination of the pore volume or the pore-size distribution through gas-adsorption isotherm methods relies on mechanisms driving the adsorption of a gas. In the case of shales, this method is dominated by physisorption or physical adsorption of the commonly used gases, e.g., CO2, N2, Ar [51,52,53,54]. The adsorption process consists of the accumulation of gas molecules on a surface (usually a solid) through weak van der Waals and electrostatic interactions, giving gas molecules the ability to form a single layer or multiple ones on the surface. The density of one or multiple layers will commonly differ from the bulk phase (Figure 1). The physisorption process can be connected to condensation in some cases [55,56,57,58,59].
Results from a physisorption experiment are commonly represented in terms of the amount of gas adsorbed by one gram of solid at a certain pressure at constant temperature, reason why it is consequently denominated an isotherm. Several techniques allow the measurement of adsorbed gas, but the most common methods are either the volumetric (or manometric) or gravimetric methods [51,58,60]. The volumetric method is based on the measurement of the gas pressure in a calibrated, constant volume at a known temperature. Meanwhile, the gravimetric approach relies on different devices to estimate changes in the mass of the samples at different pressures. Simplified schematics of these two devices are shown in Figure 2. Rouquerol et al., 2014, provide a detailed description and the math behind each method. However, additional works in the available literature discuss the techniques to build the isotherms [61]. Although gas adsorption has been used for decades and a standard for the analysis of certain material exists [62], in the world of shales there is no agreement on the use of one between the two methods (volumetric and gravimetric).
The literature shows that volumetric methods are the most common for low-pressure adsorption and therefore used for porosity and pore structure analysis. Proof of that is that the most used instruments are from Micromeritics and Quantachrome, which rely on volumetric expansion for determining the volume of gas adsorbed. On the other hand, gravimetric methods are more commonly used for high-pressure adsorption experiments, which for shales commonly relate to storage capacity. However, some publications report the use of both methods for shale characterization [63,64]. It is important to consider that both techniques rely on a corrected version of the gas law to determine changes in gas volume related to changes in pressure.
The result of the physisorption experiment is the isotherm, which provides preliminary information on the adsorbent, e.g., surface area and porosity. The shape of the isotherm depends on the interaction of the gas molecules and the solid surface as well as on their physical characteristics. The International Union of Pure and Applied Chemistry (IUPAC) [65] provides a classification of different types of isotherms as well as an interpretation to relate them with characteristics of the porous system. The classification shows six different types of isotherms. Type I isotherms can be represented by the Langmuir equation, meaning that the solid reaches maximum monolayer adsorption. This type of isotherms is often related to microporous solids with a small surface area. Type I isotherms often exhibit a linear relationship at low pressure and reach a plateau as pressure increases [56]. Type II represents systems where more than one layer of the absorbed gas is formed on the solid surface. Type III has the peculiarity of exhibiting a concave shape over the entire range of relative pressure that indicates a weak adsorbent-adsorbate interaction. Type IV is commonly observed on mesoporous material, being Type II-like, showing an inflection point as well, which suggests the formation of multi-layers. The main characteristic of the Type IV isotherm is the presence of a hysteresis loop that is indicative of capillary condensation. Type V is similar to Type III, but it also exhibits a hysteresis loop. Type VI shows as stepwise multilayer adsorption and is the less common of all. Several works in the literature provide a more detail description of each type of isotherm in addition to the information provided by the IUPAC [51,58,66]. In addition to the classification of the isotherms, the IUPAC provides an additional classification for isotherms with the presence of a hysteresis loop. The classification goes from type H1 to type H4, where H1 is related to porous material formed by agglomerates of approximately uniform spheres. H2 is commonly related to a system with not well-defined pore structures, but in the past, it has been related to ink-bottle shaped pores. Type H3 and H4 have been shown to relate to solid formed by aggregates with plate-like shapes that derive into slit-like pores.
In the case of shales, which is the focus of this work, different gases have been used for characterization purposes, e.g., CH4, CO2, N2, Ar. CH4 and CO2 are often used for the determination of storage capacity, through high pressure adsorption experiments. These experiments usually do not include desorption analysis and do not imply any condensation process. The most used gas for the acquisition of total pore volume and pore-size distribution is N2. From the classification presented by Rouquerol, 2014 [58], it is possible to say that the most observed isotherm corresponds to a type IV (due to the presence of the hysteresis loop), with a hysteresis loop of the types H3 or H4 (Figure 3).
As was previously described, isotherms in Figure 3 correspond to pore structures formed by aggregates with plate-like shapes giving some slit-like pores. Shales have pores of different types and shapes, but the significant amount of clays, crystals and other plate-like minerals provide a significant amount of slit pores [26]. There are additional classifications of types of hysteresis loops that relate the final isotherm with a specific pore shape [67,68]. In the case of shales, some works in the literature have used the classification reported by Boer 1958 [67], where five different types of hysteresis loop are shown (Figure 4). Type A loop is represented mainly by pore shaped as cylinders, Type B by slit pores, Types C and D by wedge pores, and Type E bottle neck [69,70].
From this last classification, the most common isotherms observed for shale systems are of type A and B. However, the complexity of shale pore structure complicates the proposal of a specific isotherm that can be related to a specific geometry, and it is possible to say that the porosity of these systems is a combination of multiple pore shapes. Despite the complication involved with the complexities of shales, similarities to existing isotherms allow researchers to select an adequate inversion method to obtain information as pore volume and pore-size distribution. Inversion methods will be covered later in this review.
3. Adsorptive Capabilities and Selection
As described in the previous section, different gases can be used for shale characterization. However, choosing an appropriate gas is critical to obtain the correct information. Table 1 shows a list of gases that have been used for material characterization as well as some examples of how those gases have been used for shale characterization purposes.
Methane is one of the most important gases used for characterization and is closely related to shale, since over 60% of natural gas is produced from unconventional reservoirs [71], where CH4 is the main component. Most measurements are addressed to understand the behavior of this gas in the reservoir. Storage capacity and permeability measurements are the main properties of interest, meaning that performed experiments that involve the use of methane are related to the analysis of the behavior of this gas in porous media [34,68,69,70,71,72,73,74,75,76,77,78,79,80,81,82,83,84]. Although CH4 is not directly used for porosity or pore structure characterization, there is evidence that it can provide information regarding pore architecture alteration [43,85]. Furthermore, in Medina-Rodriguez et al. [43], we demonstrated that if complementary techniques are combined, namely, TD-NMR and gas adsorption, it is possible to analyze changes in the surface properties of the rock wettability.
Helium is probably the most used gas in the world for shale characterization. The ability of the He molecule to reach small pores and to interact insignificantly with the solid walls makes it the most appropriate gas for porosity analysis (pycnometry). Another reason why it is the most used gas relies on how it is used almost exclusively on every adsorption experiment to measure void volumes. For this reason, we are confident to say that Helium is present in all works considered for this review. Despite the importance of He for porosity analysis, it is not capable of providing a description of the pore structure.
Nitrogen has been accepted as a standard for surface area and pore structure analysis of mesoporous materials and the adsorption experiments are performed at 77 K. N2 also has shown to not be the most adequate adsorbate for the analysis of microporous structures. The quadrupolar moment of the nitrogen molecule is responsible for the problem associated with the adsorption of N2. If nitrogen is used to analyze polar materials in pores, the pore-filling pressure can be shifted to low relative pressure and will not correlate with micropore sizes, e.g., carbons and metal organic frameworks [86,87,88]. For shales, nitrogen adsorption has shown to be significantly impacted by the presence of organic matter and clays, where organic matter has shown to constrain accessibility of the gas molecules and the amount and type of clays will have a direct impact on the cation exchange capacity of the surface [89]. The constraints provided by the N2 quadrupolar moment can be overcome by using argon as an adsorbate. Ar adsorption is not affected by any specific interaction with any type of solid surface. This characteristic, in addition to the slightly smaller kinetic diameter, allows argon molecules to access the micropores better and provides a superior description. Although there have been attempts to use Argon for shale pore characterization [53], it is not the popular adsorbate. This is probably due to the temperature needed to perform the experiment (87 K). However, argon is present in shale characterization in other ways. It has been used for ion milling/polishing associated with imaging techniques as well as for permeability measurements [90,91,92,93,94,95]. Finally, if the purpose is to acquire a better description of the micropores, the most appropriate adsorbate is carbon dioxide. The smaller kinetic diameter and the use of higher pressures and temperature (273 K) for adsorption makes it capable to access micropores easily. For this reason, CO2 has been chosen as a standard adsorbate for microporous carbon characterization [87,96] and widely used for shales.
Considering the aforementioned statements, Figure 5 provides percentages of use of these gases in the world of shales. In order of importance, nitrogen shows the largest use at 64%. Carbon dioxide occupies the second place at 33%. However, it is worth noticing that CO2 has been increasingly used particularly for storage purposes. Additionally, literature shows that N2 and CO2 are often used together to obtain full coverage of accessible micro and mesopores. Figure 5 does not separate the individual use of any gas.
4. Inversion Methods
Once an isotherm has been collected, the next step is to select the inversion technique that will support the interpretation of the porous medium characteristics. Not all the available techniques widely used have been exclusively developed for shale pore structure description but have proven to provide an acceptable description of unconventional porous media. For a better organization of this section, we decided to divide the available inversion methods into two groups. The first group is identified as Classical Methods, while the second group is labelled as Advance Techniques. In the first group, we briefly describe the traditional BET (Brunauer–Emmett–Teller), BJH (Barrett–Joyner–Halenda) and Dubinin methods (D-R, D-A). In the second group, we include Molecular Dynamics Simulations, Monte Carlo Simulations, DFT (Density Functional Theory), NLDFT (Non-Local Density Functional Theory), and QSDFT (Quenched Solid Density Functional Theory). Finally, we provide information on other methods that despite their relationship with the aforementioned two groups, their application for shale characterization is not as significant.
Figure 6 shows the percentage of application to shale of each inversion method category, corresponding to the percentage of articles in the open literature. It turns out that Classical Methods dominate notoriously over the Advanced Methods.
In addition, this section aims at providing the most important equations as well as highlighting references to guide the reader in case additional details are required. A table in the Supplementary Materials contains the references, selected for preparation of Figure 5 and Figure 6.
4.1. Classical Methods
- ○
- Surface Area (BET)
The use of the BET theory for the determination of surface area is perhaps the most widely accepted and used method for shale characterization. At least 90% of published works in this field have reported its use. The method was originally developed by Bruanuer, Emmett, and Teller. It has been widely used to describe the multilayer adsorption of gas molecules on a surface. The method allows the determination of the surface area on the analyzed solid through the transformation of the isotherm to a linearized BET plot that allows the determination of the monolayer coverage. The traditional BET equation follows:
where is the adsorbed amount, po is the saturation pressure of the adsorbate, is the equilibrium pressure, is the monolater adsorbed gas, and is the BET constant that can be expressed as ; is the heat of the adsorption for the first layer, and is the heat of vaporization. Through the linear plot shown in Figure 7, we obtain the slope and the intercept.
Once linear-fit parameters are obtained, one can determine the total the volume of the monolayer and subsequently the total surface area, which if divided by the total mass of the samples will provide the BET surface area of the samples through Equation (2).
where is the total surface area, is monolayer absorbed gas volume, is the Avogadro’s number, is cross-sectional area of the gas molecule, is the molar volume of adsorbed gas, and m is the sample mass.
It has been reported that traditional BET does not accurately represent the total surface area of porous media containing a significant amount of micropores. Therefore, a modified BET has been proposed, leading to Equation (3).
where a new parameter is included, , which denotates the volume adsorbed by micropores. The BET constant C is not affected by micropores. The unknown parameters can be drawn using a non-linear fitting procedure that allows the determination of the total surface area. It is important to state that despite the error introduced by the traditional BET equation, it has been shown to be the first selection for the determination of surface area of shales.
- ○
- Pore Size Distribution (BJH)
After BET, BJH is the next most frequently used method for isotherm analysis. The method allows the determination of the pore-size distribution of a mesoporous solid [58,60]. The physical principle behind the method relies on Kelvin’s equation for the analysis of condensation in pores and is expressed as
where is the equilibrium pressure in the pore, is the equilibrium saturation pressure in a planar surface, is the pore radius, is the surface tension, is the molar volume of the liquid phase, and is the angle formed by the meniscus, traditionally denominate as the contact angle.
In general terms, the relationship between the gas adsorption and the pore structure of the solid develop by Barrett, Joyner, and Halenda can be summarized as follows:
where is the volume of adsorbate at a specific relative pressure, r represents the radius, is the pore volume, is the surface area, and is the thickness of the adjacent adsorbed layer formed on the pore wall. The expression can be divided into two parts. The first relates to the volume that condensates in all pores smaller than a specific size or radius (“”) that depends on the relative pressure. The second part corresponds to a volume related to the adsorbed film that is estimated by the sum of the relation between the surface area and the thickness of the film in the pore. Some of the terms, such as the surface area and volumes, can depend on the assumed geometry [97]. However, in most cases, the pore shape is assumed cylindrical. The surface area is often determined by BET, and the thickness of the film can be obtained from the available models and equations (Table 2). Regardless of whether the adsorption or desorption isotherms are used, the calculation remains similar and will always start from the point where all pores are assumed to be filled.
It is important to know that estimating the real thickness of the adsorbed layer may have several implications on the analysis of several points on the solid surface. However, to simplify the process, the use of an average thickness for the entire surface provides some efficiency in the determination of the pore structure of a solid. In some case, corrections can be applied to the listed equations to improve their performance. For shale analysis, the most used thickness equations are the Harkins and Jura equation and the Halsey equation. There are additional thickness equations available in the literature, but they are excluded from this work due to their minimal appearance in shale-related works. The thickness equations are used in the t-plot analysis of microporosity. However, other methods (D-A, D-R) are preferred since they provide a better description of the micropores.
- ○
- Dubinin equations.
Considering the restrictions and limitations that traditional BET and BJH have for describing the microporosity of a system, Dubinin equations represent a good alternative for an adequate description and are mostly used for CO2 adsorption. These group of equations is formed by the Dubinin–Radushkevich (D-R) and the Dubinin–Astakhov (D-A) [106]. The latter equation can be considered a generalization of the former. Both expressions are shown in Table 3.
In these equations, is the volume of adsorbed gas, is the micropore volume, β is the gas affinity coefficient, T is the temperature, is the gas constant, and is the characteristic pressure. and are the equilibrium and saturation pressures, respectively. The reason why D-A is considered a generalized version of the D-R equation is because the exponent of the equation can change and be optimized to improve accuracy. Some works show that these expressions can be used to obtain a micropore size distribution [107]. The theory and principles of these methods have been extensively discussed in the literature [58,60,87,108]. Therefore, additional details will not be discussed in this work.
For shale micropore description, the following references should be consulted [109,110,111,112,113]. These techniques have been used for the determination of micropore volume and to obtain a pore-size distribution of the micropores [114].
- ○
- Advantages and Disadvantages.
The main advantage provided by the classical inversion methods is their relative simplicity and the reduced computational work required, considering they are based on simpler thermodynamics, the law of gases and traditional concepts of phase transition and capillary condensation. However, the strength of these methods is related to their disadvantages. Although the methods are capable of describing different pore shapes, they can be highly affected by heterogeneities [115,116]. In addition, traditional methods do not provide an accurate description of the energetic interactions between the pore walls and the walls with the fluid [116].
4.2. Advanced Methods
Among the methods based on Statistical Thermodynamics, some stand out, such as Molecular Dynamic Simulation, Grand Canonical Monte Carlo Simulation, and Density Functional Theory in all its forms (DFT, NLDFT and QSDFT). These methods focus on determining the distribution of gas molecules in a pore or system that is at equilibrium. These methods are known for providing a better representation of a porous medium. It is important that most of the related works that imply the use of these methodologies are based on the Leonard–Jones 12–16 potential equation.
In this equation, and represent the collision diameter and the well depth of the interaction potential, respectively. The collision can be defined as the distance where the energy of interaction is zero and the well depth represent how strong is the attraction between the particles. Therefore, the expression can be divided is two parts where the first can be defined as the repulsion term and the second as the attraction term [117].
Molecular Dynamic simulations consist of tracking each gas molecule at different time intervals and calculating the velocity and the position of the gas molecules. The method considers the interaction not just between gas molecules but also with the simulated solid surface. The accumulation of gas molecules near the solid surface makes it possible to determine the amount of gas adsorbed. The calculations behind it are relatively simple as long as the force field and the interaction models are available for the system of interest. However, the computational work required to model a system containing a large number of gas molecules as well as long times makes the application of this method time-consuming and less efficient. Despite its disadvantages, the literature shows multiple examples of the application of Molecular Dynamics for shale pore structure characterization, e.g., [71]. The method has been used mainly to understand the behavior and the diffusion of different gasses in porous media that could impact the adsorption capacity or related flow properties [47,118,119,120,121,122].
The Monte Carlo method requires less computationally intensive work compared to MD simulation. It consists of assessing a random initial configuration, in this case to gas molecules or particles, and then calculating the equilibrium distribution after a random movement of a selected particle. The equilibrium of the system is analyzed through the calculation of the total energy of the system after the random movement. The process is repeated on each particle until the energy of the system is reduced to a minimum. In case a particle displacement results in an increment of the total energy, the probability of that event is calculated to penalize it, which serves as a baseline to avoid it during the next simulation step. Similarly to MD simulations, the literature contains evidence of the use of Monte Carlo Simulation for shale pore structure characterization [123]. However, in a similar way, the preferred use is to understand the adsorption mechanism of gases like methane and carbon dioxide in shales [81,119,124,125,126,127,128].
The most used advance inversion method for pore structure characterization of shales is DFT and its derived methods (NLDFT and QSDFT). Its popularity has increased in the last few years, due to the relatively low computational requirement and good accuracy in comparison with MD and MC methods. In relation to the use of traditional method as BJH, Figure 8 shows how the use of BJH and DFT has changed in the last 10 years. It is important to clarify that not every work presented in the literature has been accounted for. However, we expect that the selected work to be representative of the general trend. As can be noticed, the use of DFT has increased in popularity, without being able to completely replace the use of traditional BJH.
Perhaps the most widely used DFT model for pore structure characterization is that developed by Tarzona and Tarzona et al. back in 1985 and 1987 [129,130,131]. However, in shale related works, the most common references include the works of Lastoskie et al., 1993 [132], Oliver and Occelli 2001 [133], Do and Do 2003 [117], Ravikovitch and Neimark 2006 [134], Landers et al. 2013 [135], and Zhang 2013 [136]. All these works describe the theory and calculations behind the process used for the development of a DFT model.
The basis of a DFT model is the calculation of the Grand Potential energy that is described as a functional of the density distribution of a single particle. To provide a better description, it should be said that a pore of a specific geometry (cylindrical, slit, etc.) is introduced in a homogeneous fluid. Once immersed, the fluid interacts with the pore wall until the system can reach equilibrium at a given chemical potential. Equation (7) describes the energy of the system.
where the terms can be separated from left to right and presented as the Helmholtz free energy (), the contribution of the external force and the contribution of the chemical potential (). In addition, is the fluid density and is the position vector inside the pore [117,135]. Equation (7) is the basis as well for the NLDFT theory, which in contrast to the local DFT allows to analyze the short range correlations near the wall by the incorporation of smoothing approximation of the density of the fluid as well as the weighing functions [58]. One of the most significant drawbacks is the assumption of a smooth and homogeneous surface of the pores. To overcome these inconveniences, more complex models have been developed (QSDFT), where the grand potential of the fluid and the solid are considered. The solid density included in the QSDFT can consider heterogeneities of the pore wall. The change with respect to the previous mathematical expression is the inclusion of the potentials and densities of the solid. A complete description of the equation can be found in Landers et al., 2013 [135].
After the description of all these methods, we should say that any of them can be applied to obtain the pore size distribution of a porous media directly. In other words, all these methods are addressed to elaborate theoretical adsorption curves of a solid with a specific pore geometry. These theoretical isotherms allow the elaboration of kernels that can be translated into the pore-size distribution through the application of the generalized adsorption isotherm equation
where corresponds to the experimental isotherm values, and are the maximum and minimum size of the pore width (w), correspond to the theoretical isotherm obtained from the DFT simulation. The method assumes that the isotherm from the experiment is made up from the combination of individual isotherms from single pores.
To summarize the process of the acquisition of the pore-size distribution through the application of any of the described advanced methods, Figure 9 shows a modified version of the diagram presented by Rouquerol et al., 2014.
- ○
- Advantages and Disadvantages
The clear advantage of the advanced techniques is their ability to provide a better description of the fluid’s behavior in porous media. If we have an ordered, known, and homogeneous porous solid, it should be possible to obtain a representative pore-size distribution. The most significant drawback for shale application is related to the availability of kernels as well as the complexity provided by the shale itself. Shale is characterized by having pores formed by different minerals and of different shapes that make it almost impossible to have an accurate kernel. However, the available kernels have been shown to provide an acceptable description of the porosity of shales. In addition, the computational work required to obtain a new kernel could still be a challenge.
4.3. Other Methods
The literature shows that other methods can be developed to draw information on the porous media of shales. Among these techniques, we find that the Horvath–Kawazoe method [137] allows users to obtain the distribution of the micropores for slit shape pores [138,139,140]. The method was later modified to work on cylindrical pores as well as on spherical pores [141,142]. This method has been used for shale pore structure analysis. To obtain a description of the external surface area and to calculate the micropore volume of materials that are mainly formed by micropores, the method known as the deBoer t-plot [67,143] appears to be an acceptable option and has been used in shales [123,144]. Finally, one of the methods that appears to be gaining popularity is the application of the Frenkel-Halsey–Hill (FHH) theory for the study of the fractal dimensions of shales [113,145,146].
The analysis of the fractal dimension of a porous material is related to the characterization of the roughness of the pore surface, and it is expressed by an dimensionless number often between two and three, where two is the representation of a perfectly smooth surface and three correspond to rough and disordered surface [147,148]. In the case of the FHH model, the fractal dimension is described by the number of gas molecules (spheres) that cover the solid surface and form a monolayer [148]. The literature shows that, in addition to roughness information, the analysis of fractal dimensions of shales can provide information regarding pore connectivity [149]. However, this field is still to be explored, especially due its potential to describe complex porous structures commonly present in shales.
5. Gas Adsorption for Shale Characterization
We have discussed the background on the use of gas adsorption for shale pore structure characterization, but not the experimental procedure itself. There are several steps that are involved in the execution of an experiment. For example, the sample preparation that includes the definition of particle size and amount of sample, the degas conditions and the selection of the adsorbate. However, as we have previously stated in this review, there is no agreement on a specific methodology used for this purpose. For this reason, we have decided that is worth providing a diagram summarizing the steps for an adsorption experiment addressed to determine PSD. The information in the diagram, shown in Figure 10, was prepared from the compilation of the different works collected for the preparation of this review. It is worth mentioning that our purpose is to provide a simple guide and that by no means we are defining a standard methodology.
The information presented in Figure 10 corresponds to a simplified procedure for shale pore-structure characterization applying gas adsorption. However, changes can occur in the procedure, depending on the purpose of the author. The selection of the gas depends on which fraction of the porosity needs to be analyzed. If the purpose is to analyze mesopores and part of the macropores, then nitrogen and argon are the best options. If the objective is the micropore region, CO2 appears to be the most suitable adsorbate. A combination of N2 and CO2 has been the most frequently used approach to gather a full spectrum of the pore structure, covering micro and mesopores. Regarding the particle size, the literature shows that it can go from a few microns to the use of full-size core-plugs, and the particle size closely relates to the amount of mass used. The number of isotherm points or pressure steps should be optimized for the sample being analyzed. More points can translate into a more detailed pore-size distribution. However, this can also imply longer experimental times, especially for those samples with large particle sizes. Finally, the selection of the inversion method should be discretized by the researcher. We consider that if additional information about the samples is available, e.g., imaging, mineral composition, and a suitable kernel that matches the additional information of the rock is available, DFT model should be selected to obtain a better description of the system. On the other hand, if not additional detail or appropriate kernels are available, traditional methods, e.g., BJH, D-A, should be considered [150]. Although these methods are known for having a questionable accuracy, the results can still be acceptable, especially if the purpose is to analyze changes over the same sample.
6. Comparison with Other Techniques
Several works can be found in the literature in which authors have compared the performance of gas adsorption with respect to other techniques. For example, it has been compared with radiation techniques, e.g., SEM, TEM, SANS, USANS, and Mercury Intrusion Porosimetry (MIP). All these comparisons have proven that even using classical inversion methods can still yield an acceptable description of the Pore-Size Distribution (less than 300 nm). An example of that is the work presented by Clarkson et al., 2012 and 2013 [31,151], where the authors were able to show that the result of simply using BJH and D-A can produce acceptable results in comparison with the results obtained from SANS and USANS. With respect to MIP, the literature shows that the obtained pore-size distribution differs between the two techniques [152]. However, instead of being a suitable replacement, the literature suggests that both techniques can be complemented to obtain a description of the pore structure that can go from less than 1 nm (if CO2 is used) to several microns.
7. Discussion of Gas Adsorption Limitations
Gas Adsorption may not be the best technique to obtain an accurate pore-size distribution of shales. However, its efficacy and low-cost place it as a good option for researchers. The drawbacks and limitations of techniques are well known and can be easily found in the literature. To provide a brief description of the limitations of the technique, we can mention: the lack of a complete understanding on capillary condensation and gas adsorption can be affected by the composition of the rock, where clays and the organic matter appear to induce the most significant alteration. Some of inversion methods have shown to overestimate or underestimate the total porosity of the shale with respect to other techniques. The isotherm can be highly affected by the particle size, if smaller particles are used, so a fraction of the macropores is lost. The BJH from desorption should not be used for characterization of pores smaller than four (4) nm, due to the presence of the tensile strength effect. No appropriate kernels are available to provide an accurate description of the shale matrix [89,150,152,155]. In addition to the previously mentioned limitations, we should add the fact that most of the shale pore-size distribution data have been obtained using the incorporated software on the instrument used, with Micromeritics and Quantachrome instruments being of popular use. Therefore, the user should carefully consider the theory behind the software and in case that DFT is used, the use should analyze the kernels provided in order to make an appropriate selection. The main problem related to the use of pre-existing models is related to the geometry (or shape) of the pores. All inversion methods, classic or advanced, assume a specific geometry that is used to calculate the dimensions of the pores. These geometries include the assumption of cylindrical, spherical, ink-bottle-shaped and slit-shaped pores. However, it is possible to say that any of these basic geometries is able to accurate describe the shale porosity that is known for its large heterogeneity. Shale porosity often include the presence of angular pores and others of different shapes across all scales, where this diversity has a significant impact on the understanding of the physical interaction between the pore walls and the gas and in some cases the interaction between the pore walls. Therefore, it is important to address efforts in creating models that consider more complex geometries, where advanced methods (MD, GCMC, DFT) appear to be the most suitable models to address this issue. For this purpose, the combination with complementary techniques, i.e., imaging, represent a valuable input by providing a more detailed description of the pore structure that could be used to feed the models.
8. Conclusions
The limitations and drawbacks of gas adsorption for pore architecture characterization are known and understood. However, its easy accessibility and low application cost make it worth to invest in its performance improvement. In the meantime, the available models satisfy the necessity of gathering a description of the shale pore architecture, if complemented by other techniques. With this in mind, we feel confident to express three main points regarding the use of gas adsorption for shale characterization.
- Gas adsorption can be considered the fastest and most inexpensive approach to obtain a description of shale pore structures.
- Gas adsorption is not a standalone technique and should be complemented by other techniques such as imaging.
- The most suitable scenario for gas adsorption is to compare changes over the same sample, after it has been subject to an alteration.
The future of gas adsorption relies not just on the development of more complex inversion models to describe the pore architecture but also on its combination with complementary techniques. We define this process as the hybridization of gas adsorption. In previous research, we demonstrated that combination of gas adsorption and NMR can be used draw information regarding surface alteration [43]. Others have shown that these two techniques can be combined to understand the distribution of gasses in the pores and to gather information related to diffusion [153,154,155]. In addition, we are also confident that the hybridization of these two techniques can provide insights to better understand the capillary condensation process in shale complex porous media. The hybridization potential is not limited to the combination with NMR, so other possibilities exist such as combinations with imaging techniques, e.g., tomography. Even within gas adsorption, it is possible to combine models to obtain more details about the pore architecture. For example, the understanding of the fractal dimensions of shales can help in the selection of an inversion method for pore-size distribution or could as well help in the development of new models that better consider the heterogeneities of a complex matrix.
Supplementary Materials
The following are available online at https://www.mdpi.com/article/10.3390/en14102880/s1. Excel File.
Author Contributions
Both authors (B.X.M.-R. and V.A.) contributed equally to this work. Both authors have read and agreed to the published version of the manuscript.
Funding
This research was funded by U.S. Department of Energy, Office of Science, grant number DE-SC0019165.
Acknowledgments
This work was supported as part of the Center for Mechanistic Control of Water-Hydrocarbon-Rock Interactions in Unconventional and Tight Oil Formations (CMC-UF), an Energy Frontier Research Center funded by the U.S. Department of Energy, Office of Science under DOE (BES) Award DE-SC0019165.
Conflicts of Interest
The authors declare no conflict of interest.
Nomenclature
| AFM | Atomic Fore Microscopy |
| Ar | Argon |
| BET | Brunauer–Emmett–Teller |
| BJH | Barrett–Joyner–Halenda |
| CH4 | Methane |
| CO2 | Carbon Dioxide |
| D-A | Dubinin–Astakhov |
| DFT | Density Functional Theory |
| D-R | Dubinin–Radushkevich |
| FHH | Frenkel–Halsey–Hill |
| FIB-SEM | Focus Ion Beam Scanning Electron Microscopy |
| Kr | Krypton |
| MD | Molecular Dynamics |
| MIP | Mercury Intrusion Porosimetry |
| N2 | Nitrogen |
| NLDFT | Non-Local Density Functional Theory |
| OM | Organic Matter |
| PSD | Pore Size Distribution |
| QSDFT | Quenched Solid Density Functional Theory |
| SANS | Small Angle Neutron Scattering |
| SAX | Saturated Excitation Microscopy |
| SEM | Scanning Electron Microscopy |
| TEM | Transmission Electron Microscopy |
| TOC | Total Organic Content |
| USANS | Ultra-Small Angle Neutron Scattering |
| XRD | X-Ray Diffraction |
| XRF | X-Ray Fluorescence |
References
- Curtis, J.B. Fractured shale-gas systems. AAPG Bull. 2002, 86, 1921–1938. [Google Scholar] [CrossRef]
- Scotchman, I.C. CHAPTER 3. Exploration for Unconventional Hydrocarbons: Shale Gas and Shale Oil. Issues Environ. Sci. Technol. 2014, 39, 69–103. [Google Scholar] [CrossRef]
- Rezaee, R. Fundamentals of Gas Shale Reservoirs; Rezaee, R., Ed.; John Wiley & Sons, Inc.: Hoboken, NJ, USA, 2015; ISBN 9781119039228. [Google Scholar]
- Dewhurst, D.N.; Yang, Y.; Aplin, A.C. Permeability and fluid flow in natural mudstones. Geol. Soc. London Spec. Publ. 1999, 158, 23–43. [Google Scholar] [CrossRef]
- Dewhurst, D.N.; Jones, R.M.; Raven, M.D. Microstructural and petrophysical characterization of Muderong Shale: Application to top seal risking. Pet. Geosci. 2002, 8, 371–383. [Google Scholar] [CrossRef]
- Horsrud, P.; Sønstebø, E.; Bøe, R. Mechanical and petrophysical properties of North Sea shales. Int. J. Rock Mech. Min. Sci. 1998, 35, 1009–1020. [Google Scholar] [CrossRef]
- Josh, M.; Esteban, L.; Piane, C.D.; Sarout, J.; Dewhurst, D.; Clennell, M. Laboratory characterisation of shale properties. J. Pet. Sci. Eng. 2012, 88–89, 107–124. [Google Scholar] [CrossRef] [Green Version]
- Jiang, Z.; Zhang, W.; Liang, C.; Wang, Y.; Liu, H.; Chen, X. Basic characteristics and evaluation of shale oil reservoirs. Pet. Res. 2016, 1, 149–163. [Google Scholar] [CrossRef]
- Josh, M.; Piane, C.D.; Esteban, L.; Bourdet, J.; Mayo, S.; Pejcic, B.; Burgar, I.; Luzin, V.; Clennell, M.B.; Dewhurst, D.N. Advanced laboratory techniques characterising solids, fluids and pores in shales. J. Pet. Sci. Eng. 2019, 180, 932–949. [Google Scholar] [CrossRef]
- Hackley, P.C.; Araujo, C.V.; Borrego, A.G.; Bouzinos, A.; Cardott, B.J.; Cook, A.C.; Eble, C.; Flores, D.; Gentzis, T.; Gonçalves, P.A.; et al. Standardization of reflectance measurements in dispersed organic matter: Results of an exercise to improve interlaboratory agreement. Mar. Pet. Geol. 2015, 59, 22–34. [Google Scholar] [CrossRef]
- Vandenbroucke, M.; Largeau, C. Kerogen Origin, Evolution and Structure. Org. Geochem. 2007, 38, 719–833. [Google Scholar] [CrossRef]
- Senftle, J.T.; Landis, C.R.; McLaughlin, R.L. Organic Petrographic Approach to Kerogen Characterization. In Organic Geochemistry; Springer: Boston, MA, USA, 1993; pp. 355–374. [Google Scholar]
- McLaughlin, J.; McLaughlin, R.; Kneller, W. Organic geochemistry of the kerogen and bitumen from the Ohio Shale by pyrolysis-gas chromatography. Int. J. Coal Geol. 1987, 7, 21–50. [Google Scholar] [CrossRef]
- Dembicki, H. Practical Petroleum Geochemistry for Exploration and Production; Elsevier Inc.: Amsterdam, The Netherlands, 2016; ISBN 9780128033517. [Google Scholar]
- Larter, S.; Douglas, A. A pyrolysis-gas chromatographic method for kerogen typing. Phys. Chem. Earth 1980, 12, 579–583. [Google Scholar] [CrossRef]
- Hackley, P.C. Standardization of Vitrinite Reflectance Measurements in Shale Petroleum Systems: How Accurate Are My Ro Data. In Proceedings of the AAPG Annual Convention and Exhibition, Houston, TX, USA, 6–9 April 2014; AAPG: Tulsa, OK, USA, 2014. [Google Scholar]
- Lazar, O.R.; Bohacs, K.M.; Macquaker, J.H.S.; Schieber, J.; Demko, T.M. Capturing Key Attributes of Fine-Grained Sedimentary Rocks In Outcrops, Cores, and Thin Sections: Nomenclature and Description Guidelines. J. Sediment. Res. 2015, 85, 230–246. [Google Scholar] [CrossRef] [Green Version]
- Hazra, B.; Varma, A.K.; Bandopadhyay, A.K.; Chakravarty, S.; Buragohain, J.; Samad, S.K.; Prasad, A.K. FTIR, XRF, XRD and SEM characteristics of Permian shales, India. J. Nat. Gas Sci. Eng. 2016, 32, 239–255. [Google Scholar] [CrossRef]
- Dargahi, H.J.; Rezaee, R.; Pejcic, B. Clay Mineralogy of Shale Gas Reservoirs through Integrating Infrared Spectroscopy and X-Ray Diffraction. In Proceedings of the Unconventional Resources Technology Conference, Denver, CO, USA, 12–14 August 2013; pp. 2027–2036. [Google Scholar]
- Mandile, A.J.; Hutton, A.C. Quantitative X-ray diffraction analysis of mineral and organic phases in organic-rich rocks. Int. J. Coal Geol. 1995, 28, 51–69. [Google Scholar] [CrossRef]
- Coveney, R.M., Jr.; Glascock, M.D. A review of the origins of metal-rich Pennsylvanian black shales, central U.S.A., with an inferred role for basinal brines. Appl. Geochem. 1989, 4, 347–367. [Google Scholar] [CrossRef]
- Zhang, J.; Zeng, Y.; Slatt, R. XRF (X-ray fluorescence) applied to characterization of unconventional Woodford Shale (Devonian, U.S.A.) lateral well heterogeneity. Fuel 2019, 254, 115565. [Google Scholar] [CrossRef]
- Wood, D.A.; Hazra, B. Characterization of organic-rich shales for petroleum exploration & exploitation: A review-Part 1: Bulk properties, multi-scale geometry and gas adsorption. J. Earth Sci. 2017, 28, 739–757. [Google Scholar] [CrossRef]
- Zhang, D.; Ranjith, P.; Perera, M. The brittleness indices used in rock mechanics and their application in shale hydraulic fracturing: A review. J. Pet. Sci. Eng. 2016, 143, 158–170. [Google Scholar] [CrossRef]
- Shi, X.; Wang, J.; Ge, X.; Han, Z.; Qu, G.; Jiang, S. A new method for rock brittleness evaluation in tight oil formation from conventional logs and petrophysical data. J. Pet. Sci. Eng. 2017, 151, 169–182. [Google Scholar] [CrossRef]
- Loucks, R.G.; Reed, R.M.; Ruppel, S.C.; Hammes, U. Spectrum of Pore Types and Networks in Mudrocks and a Descriptive Classification for Matrix-Related Mudrock Pores. Am. Assoc. Pet. Geol. Bull. 2012, 96, 1071–1098. [Google Scholar] [CrossRef] [Green Version]
- Kuila, U.; McCarty, D.K.; Derkowski, A.; Fischer, T.B.; Topór, T.; Prasad, M. Nano-scale texture and porosity of organic matter and clay minerals in organic-rich mudrocks. Fuel 2014, 135, 359–373. [Google Scholar] [CrossRef] [Green Version]
- Veselinovic, D.; Green, D.; Dick, M. Determination of Natural Fracture Porosity Using NMR. In Proceedings of the of the 4th Unconventional Resources Technology Conference, American Association of Petroleum Geologists, Tulsa, OK, USA, 20–22 July 2016. [Google Scholar]
- Longman, M.; Dahlberg, K.; Yared, K. Lithologies and Petrophysical Characteristics of the Upper Cretaceous Baxter Shale Gas Reservoir, Canyon Creek Field, Sweetwater County, Wyoming. In Proceedings of the Society of Petroleum Engineers-SPE Low Perm Symposium; Society of Petroleum Engineers, Denver, CO, USA, 5 May 2016. [Google Scholar]
- Fleury, M.; Romero-Sarmiento, M. Characterization of shales using T1–T2 NMR maps. J. Pet. Sci. Eng. 2016, 137, 55–62. [Google Scholar] [CrossRef] [Green Version]
- Clarkson, C.; Freeman, M.; He, L.; Agamalian, M.; Melnichenko, Y.; Mastalerz, M.; Bustin, R.; Radliński, A.; Blach, T. Characterization of tight gas reservoir pore structure using USANS/SANS and gas adsorption analysis. Fuel 2012, 95, 371–385. [Google Scholar] [CrossRef]
- Song, Y.-Q.; Kausik, R. NMR application in unconventional shale reservoirs—A new porous media research frontier. Prog. Nucl. Magn. Reson. Spectrosc. 2019, 112–113, 17–33. [Google Scholar] [CrossRef]
- Goral, J.; Panja, P.; Deo, M.; Andrew, M.; Linden, S.; Schwarz, J.-O.; Wiegmann, A. Confinement Effect on Porosity and Permeability of Shales. Sci. Rep. 2020, 10, 1–11. [Google Scholar] [CrossRef] [Green Version]
- Sakhaee-Pour, A.; Bryant, S.L. Gas Permeability of Shale. In Proceedings of the Proceedings-SPE Annual Technical Conference and Exhibition, Society of Petroleum Engineers (SPE), Denver, CO, USA, 30 October–2 November 2011; Volume 4, pp. 3047–3060. [Google Scholar]
- Zeng, J.; Liu, J.; Li, W.; Leong, Y.-K.; Elsworth, D.; Guo, J. Evolution of Shale Permeability under the Influence of Gas Diffusion from the Fracture Wall into the Matrix. Energy Fuels 2020, 34, 4393–4406. [Google Scholar] [CrossRef]
- Neuzil, C. Permeability of Clays and Shales. Annu. Rev. Earth Planet. Sci. 2019, 47, 247–273. [Google Scholar] [CrossRef]
- Lyu, Q.; Shi, J.; Gamage, R.P. Effects of testing method, lithology and fluid-rock interactions on shale permeability: A review of laboratory measurements. J. Nat. Gas Sci. Eng. 2020, 78, 103302. [Google Scholar] [CrossRef]
- Yuan, Y.; Rahman, S.; Wang, J.; Doonechaly, N.G. An Innovative Technique for Estimation of Permeability of Shale Gas Reservoirs. In Proceedings of the Society of Petroleum Engineers-SPE Asia Pacific Unconventional Resources Conference and Exhibition, Society of Petroleum Engineers, Brisbane, Australia, 9–11 November 2015. [Google Scholar]
- Wang, M.; Yu, Q. A method to determine the permeability of shales by using the dynamic process data of methane adsorption. Eng. Geol. 2019, 253, 111–122. [Google Scholar] [CrossRef]
- Yang, Z.; Dong, M. A new measurement method for radial permeability and porosity of shale. Pet. Res. 2017, 2, 178–185. [Google Scholar] [CrossRef]
- Tahmasebi, P.; Javadpour, F.; Enayati, S.F. Digital Rock Techniques to Study Shale Permeability: A Mini-Review. Energy Fuels 2020. [Google Scholar] [CrossRef]
- Lu, T.; Xu, R.; Zhou, B.; Wang, Y.; Zhang, F.; Jiang, P. Improved Method for Measuring the Permeability of Nanoporous Material and Its Application to Shale Matrix with Ultra-Low Permeability. Materials 2019, 12, 1567. [Google Scholar] [CrossRef] [Green Version]
- Medina-Rodriguez, B.X.; Alvarado, V.; Edgin, M.; Kaszuba, J. Unveiling stimulation fluid-driven alterations in shale pore architecture through combined interpretation of TD-NMR and multi-component gas adsorption. Fuel 2021, 297, 120744. [Google Scholar] [CrossRef]
- Rouquerol, J.; Avnir, D.; Fairbridge, C.W.; Everett, D.H.; Haynes, J.M.; Pernicone, N.; Ramsay, J.D.F.; Sing, K.S.W.; Unger, K.K. Recommendations for the characterization of porous solids (Technical Report). Pure Appl. Chem. 1994, 66, 1739–1758. [Google Scholar] [CrossRef]
- Anovitz, L.M.; Cole, D.R. Characterization and Analysis of Porosity and Pore Structures. Rev. Miner. Geochem. 2015, 80, 61–164. [Google Scholar] [CrossRef] [Green Version]
- Davarpanah, A.; Mirshekari, B. Experimental Investigation and Mathematical Modeling of Gas Diffusivity by Carbon Dioxide and Methane Kinetic Adsorption. Ind. Eng. Chem. Res. 2019, 58, 12392–12400. [Google Scholar] [CrossRef]
- He, S.; Palmer, J.C.; Qin, G. A non-equilibrium molecular dynamics study of methane transport in clay nano-pores. Microporous Mesoporous Mater. 2017, 249, 88–96. [Google Scholar] [CrossRef]
- Aylmore, L.A.G. Gas Sorption in Clay Mineral Systems. Clays Clay Miner. 1974, 22, 175–183. [Google Scholar] [CrossRef]
- Aylmore, L.A.G.; Quirk, J.P. The micropore size distributions of clay mineral systems. Eur. J. Soil Sci. 1967, 18, 1–17. [Google Scholar] [CrossRef]
- Gan, H.; Nandi, S.; Walker, P. Nature of the porosity in American coals. Fuel 1972, 51, 272–277. [Google Scholar] [CrossRef]
- Rani, S.; Padmanabhan, E.; Prusty, B.K. Review of gas adsorption in shales for enhanced methane recovery and CO2 storage. J. Pet. Sci. Eng. 2019, 175, 634–643. [Google Scholar] [CrossRef]
- Kang, S.M.; Fathi, E.; Ambrose, R.J.; Akkutlu, I.Y.; Sigal, R.F. Carbon Dioxide Storage Capacity of Organic-Rich Shales. SPE J. 2011, 16, 842–855. [Google Scholar] [CrossRef] [Green Version]
- Zhang, L.; Xiong, Y.; Li, Y.; Wei, M.; Jiang, W.; Lei, R.; Wu, Z. DFT modeling of CO2 and Ar low-pressure adsorption for accurate nanopore structure characterization in organic-rich shales. Fuel 2017, 204, 1–11. [Google Scholar] [CrossRef]
- Kuila, U.; Prasad, M. Specific surface area and pore-size distribution in clays and shales. Geophys. Prospect. 2013, 61, 341–362. [Google Scholar] [CrossRef]
- Brunauer, S.; Emmett, P.H.; Teller, E. Adsorption of Gases in Multimolecular Layers. J. Am. Chem. Soc. 1938, 60, 309–319. [Google Scholar] [CrossRef]
- Brunauer, S.; Deming, L.S.; Deming, W.E.; Teller, E. On a Theory of the van der Waals Adsorption of Gases. J. Am. Chem. Soc. 1940, 62, 1723–1732. [Google Scholar] [CrossRef]
- Choi, J.-G.; Do, D.D.; Do, H.D. Surface Diffusion of Adsorbed Molecules in Porous Media: Monolayer, Multilayer, and Capillary Condensation Regimes. Ind. Eng. Chem. Res. 2001, 40, 4005–4031. [Google Scholar] [CrossRef]
- Rouquerol, J.; Rouquerol, F.; Llewellyn, P.; Maurin, G.; Sing, K.S.W. Adsorption by Powders and Porous Solids: Principles, Methodology and Applications, 2nd ed.; Elsevier Inc.: Amsterdam, The Netherlands, 2014; ISBN 9780080970356. [Google Scholar]
- Thommes, M. Physical Adsorption Characterization of Nanoporous Materials. Chem. Ing. Tech. 2010, 82, 1059–1073. [Google Scholar] [CrossRef]
- Sing, K.S.W. Reporting physisorption data for gas/solid systems with special reference to the determination of surface area and porosity (Recommendations 1984). Pure Appl. Chem. 1985, 57, 603–619. [Google Scholar] [CrossRef]
- Busch, A.; Gensterblum, Y. CBM and CO2-ECBM related sorption processes in coal: A review. Int. J. Coal Geol. 2011, 87, 49–71. [Google Scholar] [CrossRef]
- DIN ISO 15901-3: Pore Size Distribution and Porosity of Solid Materials by Mercury Porosimetry and Gas Adsorption-Part 3: Analysis of Micropores by Gas Adsorption. 2007. Available online: https://www.iso.org/standard/40364.html (accessed on 17 May 2021).
- Hui, D.; Pan, Y.; Luo, P.; Zhang, Y.; Sun, L.; Lin, C. Effect of supercritical CO2 exposure on the high-pressure CO2 adsorption performance of shales. Fuel 2019, 247, 57–66. [Google Scholar] [CrossRef]
- Levy, J.H.; Day, S.J.; Killingley, J.S. Methane capacities of Bowen Basin coals related to coal properties. Fuel 1997, 76, 813–819. [Google Scholar] [CrossRef]
- International Union of Pure and Applied Chemistry Physical Chemistry Division Commission on Colloid and Surface Chemistry Including Catalysis* Reporting Physisorption Data for Gas/Solid Systems with Special Reference to the Determination of Surface Area and Porosity. 1985. Available online: http://publications.iupac.org/pac/57/4/0603/index.html (accessed on 25 January 2021).
- Schneider, P. Adsorption isotherms of microporous-mesoporous solids revisited. Appl. Catal. A Gen. 1995, 129, 157–165. [Google Scholar] [CrossRef]
- de Boer, J.H. The Structure and Properties of Porous Materials; Butterworths: London, UK, 1958. [Google Scholar]
- Mayagoitia, V. The Five Types of Porous Structures and Their Hysteresis Loops. Adv. Pharmacol. 1991, 62, 51–60. [Google Scholar] [CrossRef]
- Labani, M.M.; Rezaee, R.; Saeedi, A.; Al Hinai, A. Evaluation of pore size spectrum of gas shale reservoirs using low pressure nitrogen adsorption, gas expansion and mercury porosimetry: A case study from the Perth and Canning Basins, Western Australia. J. Pet. Sci. Eng. 2013, 112, 7–16. [Google Scholar] [CrossRef]
- Zhang, Y.; Shao, D.; Yan, J.; Jia, X.; Li, Y.; Yu, P.; Zhang, T. The pore size distribution and its relationship with shale gas capacity in organic-rich mudstone of Wufeng-Longmaxi Formations, Sichuan Basin, China. J. Nat. Gas Geosci. 2016, 1, 213–220. [Google Scholar] [CrossRef] [Green Version]
- Nelson, B.P.H.; Kibler, J.E. Formation Pressures and Gas-Flow Rates from Well Tests, Southwestern Wyoming Province, Wyoming, Colorado, and Utah; USGS Southwestern Wyoming Province Assessment Team: Laramie, WY, USA, 2005; ISBN 0607990279.
- Zeng, F.; Huang, W.B.; Liu, M.; Lu, S.F.; Yu, L. A Study on Quantitative Characterization of Adsorption Capacity of Shale. Adv. Mater. Res. 2013, 868, 20–25. [Google Scholar] [CrossRef]
- Huang, X.; Zhao, Y.-P. Characterization of pore structure, gas adsorption, and spontaneous imbibition in shale gas reservoirs. J. Pet. Sci. Eng. 2017, 159, 197–204. [Google Scholar] [CrossRef]
- Tian, Y.; Yan, C.; Jin, Z. Characterization of Methane Excess and Absolute Adsorption in Various Clay Nanopores from Molecular Simulation. Sci. Rep. 2017, 7, 12040. [Google Scholar] [CrossRef] [Green Version]
- Huang, L.; Ning, Z.; Wang, Q.; Ye, H.; Wang, Z.; Sun, Z.; Qin, H. Microstructure and adsorption properties of organic matter in Chinese Cambrian gas shale: Experimental characterization, molecular modeling and molecular simulation. Int. J. Coal Geol. 2018, 198, 14–28. [Google Scholar] [CrossRef]
- Li, J.; Zhou, S.; Gaus, G.; Li, Y.; Ma, Y.; Chen, K.; Zhang, Y. Characterization of methane adsorption on shale and isolated kerogen from the Sichuan Basin under pressure up to 60 MPa: Experimental results and geological implications. Int. J. Coal Geol. 2018, 189, 83–93. [Google Scholar] [CrossRef]
- Cao, X.; Wang, M.; Kang, J.; Wang, S.; Liang, Y. Fracturing technologies of deep shale gas horizontal wells in the Weirong Block, southern Sichuan Basin. Nat. Gas Ind. B 2020, 7, 64–70. [Google Scholar] [CrossRef]
- Chen, S.; Zhu, Y.; Wang, H.; Liu, H.; Wei, W.; Fang, J. Shale gas reservoir characterisation: A typical case in the southern Sichuan Basin of China. Energy 2011, 36, 6609–6616. [Google Scholar] [CrossRef]
- Zhang, T.; Ellis, G.S.; Ruppel, S.C.; Milliken, K.; Yang, R. Effect of organic-matter type and thermal maturity on methane adsorption in shale-gas systems. Org. Geochem. 2012, 47, 120–131. [Google Scholar] [CrossRef]
- Gasparik, M.; Ghanizadeh, A.; Bertier, P.; Gensterblum, Y.; Bouw, S.; Krooss, B.M. High-Pressure Methane Sorption Isotherms of Black Shales from The Netherlands. Energy Fuels 2012, 26, 4995–5004. [Google Scholar] [CrossRef]
- Jin, Z.; Firoozabadi, A. Methane and carbon dioxide adsorption in clay-like slit pores by Monte Carlo simulations. Fluid Phase Equilibria 2013, 360, 456–465. [Google Scholar] [CrossRef]
- Rani, S.; Prusty, B.K.; Pal, S.K. Methane adsorption and pore characterization of Indian shale samples. J. Unconv. Oil Gas Resour. 2015, 11, 1–10. [Google Scholar] [CrossRef]
- Tolbert, B.T.; Wu, X. Quantifying Pore Size Distribution Effect on Gas in Place and Recovery Using SLD-PR EOS for Multiple-Components Shale Gas Reservoir. In Proceedings of the Society of Petroleum Engineers-SPE Asia Pacific Unconventional Resources Conference and Exhibition, Society of Petroleum Engineers, Brisbane, Australia, 9–11 November 2015. [Google Scholar]
- Tian, H.; Li, T.; Zhang, T.; Xiao, X. Characterization of methane adsorption on overmature Lower Silurian–Upper Ordovician shales in Sichuan Basin, southwest China: Experimental results and geological implications. Int. J. Coal Geol. 2016, 156, 36–49. [Google Scholar] [CrossRef]
- Zeng, L.; Chen, Y.; Hossain, M.; Saeedi, A.; Xie, Q. Wettability alteration induced water uptake in shale oil reservoirs: A geochemical interpretation for oil-brine-OM interaction during hydraulic fracturing. Int. J. Coal Geol. 2019, 213, 103277. [Google Scholar] [CrossRef]
- Cychosz, K.A.; Thommes, M. Progress in the Physisorption Characterization of Nanoporous Gas Storage Materials. Engineering 2018, 4, 559–566. [Google Scholar] [CrossRef]
- Thommes, M.; Kaneko, K.; Neimark, A.V.; Olivier, J.P.; Rodriguez-Reinoso, F.; Rouquerol, J.; Sing, K.S. Physisorption of gases, with special reference to the evaluation of surface area and pore size distribution (IUPAC Technical Report). Pure Appl. Chem. 2015, 87, 1051–1069. [Google Scholar] [CrossRef] [Green Version]
- Thommes, M. Chapter 15 Textural characterization of zeolites and ordered mesoporous materials by physical adsorption. In Studies in Surface Science and Catalysis; Elsevier Inc.: Amsterdam, The Netherlands, 2007; Volume 168, ISBN 0444530630. [Google Scholar]
- Saidian, M.; Godinez, L.J.; Prasad, M. Effect of clay and organic matter on nitrogen adsorption specific surface area and cation exchange capacity in shales (mudrocks). J. Nat. Gas Sci. Eng. 2016, 33, 1095–1106. [Google Scholar] [CrossRef]
- Zhang, D.; Ranjith, P.; Perera, M.; Ma, G. Laboratory evaluation of flow properties of Niutitang shale at reservoir conditions. Mar. Pet. Geol. 2020, 115, 104257. [Google Scholar] [CrossRef]
- Wang, F.; Guo, S. Influential factors and model of shale pore evolution: A case study of a continental shale from the Ordos Basin. Mar. Pet. Geol. 2019, 102, 271–282. [Google Scholar] [CrossRef]
- Slatt, R.M.; O’Brien, N.R. Pore types in the Barnett and Woodford gas shales: Contribution to understanding gas storage and migration pathways in fine-grained rocks. AAPG Bull. 2011, 95, 2017–2030. [Google Scholar] [CrossRef]
- Yang, X.; Guo, S. Pore characterization of marine-continental transitional shale in Permian Shanxi Formation of The Southern North China Basin. Energy Explor. Exploit. 2020, 38, 2199–2216. [Google Scholar] [CrossRef]
- Yang, X.; Guo, S. Comparative analysis of shale pore size characterization methods. Pet. Sci. Technol. 2020, 38, 793–799. [Google Scholar] [CrossRef]
- Wang, Z.; Li, X.Q.; Zhou, B.G.; Qi, S.; Zhang, J.Z.; Wang, G.; Xu, H.W.; Wang, F.Y. Characterization of Microscopic Pore Structure and Its Influence on Gas Content of Shale Gas Reservoirs from the Lower Paleozoic in Southern Sichuan Basin. Meitan Xuebao/J. China Coal Soc. 2016, 41, 2287–2297. [Google Scholar] [CrossRef]
- Thommes, M.; Cychosz, K.A.; Neimark, A.V. Advanced Physical Adsorption Characterization of Nanoporous Carbons. In Novel Carbon Adsorbents; Elsevier BV: Amsterdam, The Netherlands, 2012; pp. 107–145. [Google Scholar]
- AWM’s. Adsorption Page-Mesopores-BJH Scheme. Available online: http://www.adsorption.org/awm/ads/meso/BJH.htm (accessed on 25 January 2021).
- Harkins, W.D.; Jura, G. Surface of Solids. X. Extension of the Attractive Energy of a Solid into an Adjacent Liquid or Film, the Decrease of Energy with Distance, and the Thickness of Films. J. Am. Chem. Soc. 1944, 66, 919–927. [Google Scholar] [CrossRef]
- Harkins, W.D.; Jura, G. Surfaces of Solids. XIII. A Vapor Adsorption Method for the Determination of the Area of a Solid without the Assumption of a Molecular Area, and the Areas Occupied by Nitrogen and Other Molecules on the Surface of a Solid. J. Am. Chem. Soc. 1944, 66, 1366–1373. [Google Scholar] [CrossRef]
- Jura, G.; Harkins, W.D. Surfaces of Solids. XI. Determination of the Decrease (π) of Free Surface Energy of a Solid by an Adsorbed Film. J. Am. Chem. Soc. 1944, 66, 1356–1362. [Google Scholar] [CrossRef]
- Halsey, G. Physical Adsorption on Non-Uniform Surfaces. J. Chem. Phys. 1948, 16, 931–937. [Google Scholar] [CrossRef]
- Broekhoff, J.C.P.; De Boer, J.H. The Surface Area in Intermediate Pores. In Surface Area Determination; Elsevier: Amsterdam, The Netherlands, 1970; pp. 97–121. [Google Scholar]
- Kruk, M.; Jaroniec, M.; Sayari, A. Adsorption Study of Surface and Structural Properties of MCM-41 Materials of Different Pore Sizes. J. Phys. Chem. B 1997, 101, 583–589. [Google Scholar] [CrossRef]
- Kruk, M.; Jaroniec, M.; Sayari, A. Application of Large Pore MCM-41 Molecular Sieves To Improve Pore Size Analysis Using Nitrogen Adsorption Measurements. Langmuir 1997, 13, 6267–6273. [Google Scholar] [CrossRef]
- Magee, R.W. Evaluation of the External Surface Area of Carbon Black by Nitrogen Adsorption. Rubber Chem. Technol. 1995, 68, 590–600. [Google Scholar] [CrossRef]
- Dubinin, M.M. Fundamentals of the theory of adsorption in micropores of carbon adsorbents: Characteristics of their adsorption properties and microporous structures. Pure Appl. Chem. 1989, 61, 1841–1843. [Google Scholar] [CrossRef]
- Dubinin, M.; Stoeckli, H. Homogeneous and heterogeneous micropore structures in carbonaceous adsorbents. J. Colloid Interface Sci. 1980, 75, 34–42. [Google Scholar] [CrossRef] [Green Version]
- Stoeckli, H.; Kraehenbuehl, F.; Ballerini, L.; De Bernardini, S. Recent developments in the Dubinin equation. Carbon 1989, 27, 125–128. [Google Scholar] [CrossRef] [Green Version]
- Mastalerz, M.; He, L.; Melnichenko, Y.B.; Rupp, J.A. Porosity of Coal and Shale: Insights from Gas Adsorption and SANS/USANS Techniques. Energy Fuels 2012, 26, 5109–5120. [Google Scholar] [CrossRef]
- Chen, J.; Xiao, X. Evolution of nanoporosity in organic-rich shales during thermal maturation. Fuel 2014, 129, 173–181. [Google Scholar] [CrossRef]
- Chen, Y.; Wei, L.; Mastalerz, M.; Schimmelmann, A. The effect of analytical particle size on gas adsorption porosimetry of shale. Int. J. Coal Geol. 2015, 138, 103–112. [Google Scholar] [CrossRef] [Green Version]
- Wang, T.-Y.; Tian, S.-C.; Liu, Q.-L.; Li, G.-S.; Sheng, M.; Ren, W.-X.; Zhang, P.-P. Pore structure characterization and its effect on methane adsorption in shale kerogen. Pet. Sci. 2020, 1–14. [Google Scholar] [CrossRef]
- Zhang, J.; Tang, Y.; He, D.; Sun, P.; Zou, X. Full-scale nanopore system and fractal characteristics of clay-rich lacustrine shale combining FE-SEM, nano-CT, gas adsorption and mercury intrusion porosimetry. Appl. Clay Sci. 2020, 196, 105758. [Google Scholar] [CrossRef]
- Li, T.; Tian, H.; Chen, J.; Cheng, L. Application of low pressure gas adsorption to the characterization of pore size distribution of shales: An example from Southeastern Chongqing area, China. J. Nat. Gas Geosci. 2016, 1, 221–230. [Google Scholar] [CrossRef] [Green Version]
- Chen, S.G.; Yang, R.T. Theoretical Basis for the Potential Theory Adsorption Isotherms. The Dubinin-Radushkevich and Dubinin-Astakhov Equations. Langmuir 1994, 10, 4244–4249. [Google Scholar] [CrossRef]
- Groen, J.C.; Peffer, L.A.; Pérez-Ramírez, J. Pore size determination in modified micro- and mesoporous materials. Pitfalls and limitations in gas adsorption data analysis. Microporous Mesoporous Mater. 2003, 60, 1–17. [Google Scholar] [CrossRef]
- Do, D.; Do, H. Pore Characterization of Carbonaceous Materials by DFT and GCMC Simulations: A Review. Adsorpt. Sci. Technol. 2003, 21, 389–423. [Google Scholar] [CrossRef]
- Herdes, C.; Petit, C.; Mejía, A.; Müller, E.A. Combined Experimental, Theoretical, and Molecular Simulation Approach for the Description of the Fluid-Phase Behavior of Hydrocarbon Mixtures within Shale Rocks. Energy Fuels 2018, 32, 5750–5762. [Google Scholar] [CrossRef] [Green Version]
- Chong, L.; Sanguinito, S.; Goodman, A.L.; Myshakin, E.M. Molecular characterization of carbon dioxide, methane, and water adsorption in micropore space of kerogen matrix. Fuel 2021, 283, 119254. [Google Scholar] [CrossRef]
- AlAfnan, S.; Falola, Y.; Al Mansour, O.; Alsamadony, K.; Awotunde, A.; Aljawad, M. Enhanced Recovery From Organic-Rich Shales through Carbon Dioxide Injection: Molecular-Level Investigation. Energy Fuels 2020, 34, 16089–16098. [Google Scholar] [CrossRef]
- Gupta, N.; Fathi, E.; Belyadi, F. Effects of nano-pore wall confinements on rarefied gas dynamics in organic rich shale reservoirs. Fuel 2018, 220, 120–129. [Google Scholar] [CrossRef]
- Sui, H.; Yao, J.; Zhang, L. Molecular Simulation of Shale Gas Adsorption and Diffusion in Clay Nanopores. Computation 2015, 3, 687–700. [Google Scholar] [CrossRef] [Green Version]
- Adesida, A.G.; Akkutlu, I.Y.; Resasco, D.E.; Rai, C.S. Kerogen Pore Size Distribution of Barnett Shale using DFT Analysis and Monte Carlo Simulations. In Proceedings of the Society of Petroleum Engineers-SPE Asia Pacific Unconventional Resources Conference and Exhibition, Society of Petroleum Engineers, Brisbane, Australia, 9–11 November; Volume 5, pp. 4341–4354.
- Song, W.; Yao, J.; Ma, J.; Li, A.; Li, Y.; Sun, H.; Zhang, L. Grand canonical Monte Carlo simulations of pore structure influence on methane adsorption in micro-porous carbons with applications to coal and shale systems. Fuel 2018, 215, 196–203. [Google Scholar] [CrossRef]
- Aljamaan, H.; Al Ismail, M.; Kovscek, A.R. Experimental investigation and Grand Canonical Monte Carlo simulation of gas shale adsorption from the macro to the nano scale. J. Nat. Gas Sci. Eng. 2017, 48, 119–137. [Google Scholar] [CrossRef]
- Liu, Y.; Hou, J. Investigation on the Potential Relationships between Geophysical Properties and CH4 Adsorption in a Typical Shale Gas Reservoir. Energy Fuels 2019, 33, 8354–8362. [Google Scholar] [CrossRef]
- Hu, X.; Deng, H.; Lu, C.; Tian, Y.; Jin, Z. Characterization of CO2/CH4 Competitive Adsorption in Various Clay Minerals in Relation to Shale Gas Recovery from Molecular Simulation. Energy Fuels 2019, 33, 8202–8214. [Google Scholar] [CrossRef]
- Takbiri-Borujeni, A.; Fathi, E.; Kazemi, M.; Belyadi, F. An integrated multiscale model for gas storage and transport in shale reservoirs. Fuel 2019, 237, 1228–1243. [Google Scholar] [CrossRef]
- Tarazona, P. Free-energy density functional for hard spheres. Phys. Rev. A 1985, 31, 2672–2679. [Google Scholar] [CrossRef]
- Tarazona, P.; Marconi, U.M.B.; Evans, R. Phase equilibria of fluid interfaces and confined fluids. Mol. Phys. 1987, 60, 573–595. [Google Scholar] [CrossRef]
- Lastoskie, C.; Gubbins, K.E.; Quirke, N. Pore size distribution analysis of microporous carbons: A density functional theory approach. J. Phys. Chem. 1993, 97, 4786–4796. [Google Scholar] [CrossRef]
- Olivier, J.P.; Occelli, M.L. Surface Area and Microporosity of a Pillared Interlayered Clay (PILC) from a Hybrid Density Functional Theory (DFT) Method. J. Phys. Chem. B 2001, 105, 623–629. [Google Scholar] [CrossRef]
- Ravikovitch, P.I.; Neimark, A.V. Density Functional Theory Model of Adsorption on Amorphous and Microporous Silica Materials. Langmuir 2006, 22, 11171–11179. [Google Scholar] [CrossRef] [PubMed]
- Landers, J.; Gor, G.Y.; Neimark, A.V. Density functional theory methods for characterization of porous materials. Colloids Surf. A Physicochem. Eng. Asp. 2013, 437, 3–32. [Google Scholar] [CrossRef]
- Zhang, Z.; Yang, Z. Theoretical and practical discussion of measurement accuracy for physisorption with micro- and mesoporous materials. Chin. J. Catal. 2013, 34, 1797–1810. [Google Scholar] [CrossRef]
- Horváth, G.; Kawazoe, K. Method for the calculation of effective pore size distribution in molecular sieve carbon. J. Chem. Eng. Jpn. 1983, 16, 470–475. [Google Scholar] [CrossRef] [Green Version]
- Nia, S.F.; Dasani, D.; Tsotsis, T.; Jessen, K. Pore-Scale Characterization of Oil-Rich Monterey Shale: A Preliminary Study. In Proceedings of the Unconventional Resources Technology Conference, Denver, CO, USA, 12–14 August 2013; pp. 1750–1760. [Google Scholar] [CrossRef]
- Chen, Q.; Zhang, J.; Tang, X.; Dang, W.; Li, Z.; Liu, C.; Zhang, X. Pore Structure Characterization of the Lower Permian Marine-Continental Transitional Black Shale in the Southern North China Basin, Central China. Energy Fuels 2016, 30, 10092–10105. [Google Scholar] [CrossRef]
- Li, J.; Zhou, S.; Fu, D.; Li, Y.; Ma, Y.; Yang, Y.; Li, C. Changes in the pore characteristics of shale during comminution. Energy Explor. Exploit. 2016, 34, 676–688. [Google Scholar] [CrossRef] [Green Version]
- Saito, A.; Foley, H.C. Curvature and parametric sensitivity in models for adsorption in micropores. AIChE J. 1991, 37, 429–436. [Google Scholar] [CrossRef]
- Saito, A.; Foley, H.C. High-resolution nitrogen and argon adsorption on ZSM-5 zeolites: Effects of cation exchange and ratio. Microporous Mater. 1995, 3, 543–556. [Google Scholar] [CrossRef]
- De Boer, J.; Lippens, B.; Linsen, B.; Broekhoff, J.; Heuvel, A.V.D.; Osinga, T.J. Thet-curve of multimolecular N2-adsorption. J. Colloid Interface Sci. 1966, 21, 405–414. [Google Scholar] [CrossRef]
- Chen, L.; Jiang, Z.; Liu, K.; Wang, P.; Gao, F.; Hu, T. Application of low-pressure gas adsorption to nanopore structure characterisation of organic-rich lower Cambrian shale in the Upper Yangtze Platform, South China. Aust. J. Earth Sci. 2017, 64, 653–665. [Google Scholar] [CrossRef]
- Li, K.; Kong, S.; Xia, P.; Wang, X. Microstructural characterisation of organic matter pores in coal-measure shale. Adv. Geo-Energy Res. 2020, 4, 372–391. [Google Scholar] [CrossRef]
- Huang, L.; Liu, X.; Xiong, J.; Liang, L. Experimental on the pore structure characteristics of Longmaxi Formation shale in southern Sichuan Basin, China. Petroleum 2020. [Google Scholar] [CrossRef]
- Liu, K.; Ostadhassan, M.; Jang, H.W.; Zakharova, N.V.; Shokouhimehr, M. Comparison of fractal dimensions from nitrogen adsorption data in shale via different models. RSC Adv. 2021, 11, 2298–2306. [Google Scholar] [CrossRef]
- Lowell, S.; Shields, J.E.; Thomas, M.A.; Thommes, M. Evaluation of Fractal Dimension by Gas Adsorption. Part. Technol. Ser. 2004, 94–100. [Google Scholar]
- Sakhaee-Pour, A.; Li, W. Fractal dimensions of shale. J. Nat. Gas Sci. Eng. 2016, 30, 578–582. [Google Scholar] [CrossRef]
- Wang, G.; Ju, Y. Organic shale micropore and mesopore structure characterization by ultra-low pressure N 2 physisorption: Experimental procedure and interpretation model. J. Nat. Gas Sci. Eng. 2015, 27, 452–465. [Google Scholar] [CrossRef]
- Clarkson, C.; Solano, N.; Bustin, R.; Bustin, A.; Chalmers, G.; He, L.; Melnichenko, Y.; Radliński, A.; Blach, T. Pore structure characterization of North American shale gas reservoirs using USANS/SANS, gas adsorption, and mercury intrusion. Fuel 2013, 103, 606–616. [Google Scholar] [CrossRef]
- Schäfer, T.; Dohrmann, R.; Greenwell, H.C.; Bertier, P.; Schweinar, K.; Stanjek, H.; Ghanizadeh, A.; Clarkson, C.R.; Busch, A.; Kampman, N.; et al. On the Use and Abuse of N 2 Physisorption for the Characterization of the Pore Structure of Shales. In Filling the Gaps-from Microscopic Pore Structures to Transport Properties in Shales; Clay Minerals Society: Chantilly, VA, USA, 2016; pp. 151–161. [Google Scholar]
- Yuan, Y.; Rezaee, R. Comparative Porosity and Pore Structure Assessment in Shales: Measurement Techniques, Influencing Factors and Implications for Reservoir Characterization. Energies 2019, 12, 2094. [Google Scholar] [CrossRef] [Green Version]
- Yao, Y.; Liu, D.; Xie, S. Quantitative characterization of methane adsorption on coal using a low-field NMR relaxation method. Int. J. Coal Geol. 2014, 131, 32–40. [Google Scholar] [CrossRef]
- Li, Z.; Liu, D.; Xie, S.; Fang, X.; Si, G.; Cai, Y.; Wang, Y. Evaluation of Methane Dynamic Adsorption–Diffusion Process in Coals by a Low-Field NMR Method. Energy Fuels 2020, 34, 16119–16131. [Google Scholar] [CrossRef]
- Yao, Y.; Liu, J.; Liu, D.; Chen, J.; Pan, Z. A new application of NMR in characterization of multiphase methane and adsorption capacity of shale. Int. J. Coal Geol. 2019, 201, 76–85. [Google Scholar] [CrossRef]
Figure 1.
Physisorption process on solid surface.

Figure 2.
Simplified diagram of the volumetric method (left) and the gravimetric method (right) to determine the volume of adsorption.
Figure 2.
Simplified diagram of the volumetric method (left) and the gravimetric method (right) to determine the volume of adsorption.

Figure 3.
IUPAC classification of isotherms and hysteresis loops commonly observed on shales. (Modified from Rouquerol, 2014 [58]).
Figure 3.
IUPAC classification of isotherms and hysteresis loops commonly observed on shales. (Modified from Rouquerol, 2014 [58]).

Figure 4.
Five different types of hysteresis loop related to pore shapes. (Modified from Labani et al., 2013, and Zhang et al., 2016 [69,70]).

Figure 5.
Representation of the use of different gases for pore structure analysis in the selected literature. (Elaborated from analysis of articles in the attached Excel file).
Figure 5.
Representation of the use of different gases for pore structure analysis in the selected literature. (Elaborated from analysis of articles in the attached Excel file).

Figure 6.
Representation of the main inversion techniques applied for pore structure characterization on shale systems (Elaborated from analysis of articles in the attached Excel file).
Figure 6.
Representation of the main inversion techniques applied for pore structure characterization on shale systems (Elaborated from analysis of articles in the attached Excel file).

Figure 7.
Linear plot for BET method.

Figure 8.
Comparison of the use of BJH and DFT in the last 10 years.

Figure 9.
Diagram of the acquisition of the PSD through the application of advance inversion method. (Modified from Rouquerol et al., 2014 [58]).
Figure 9.
Diagram of the acquisition of the PSD through the application of advance inversion method. (Modified from Rouquerol et al., 2014 [58]).

Figure 10.
Diagram describing the common procedure to determine PSD of shales using gas adsorption.


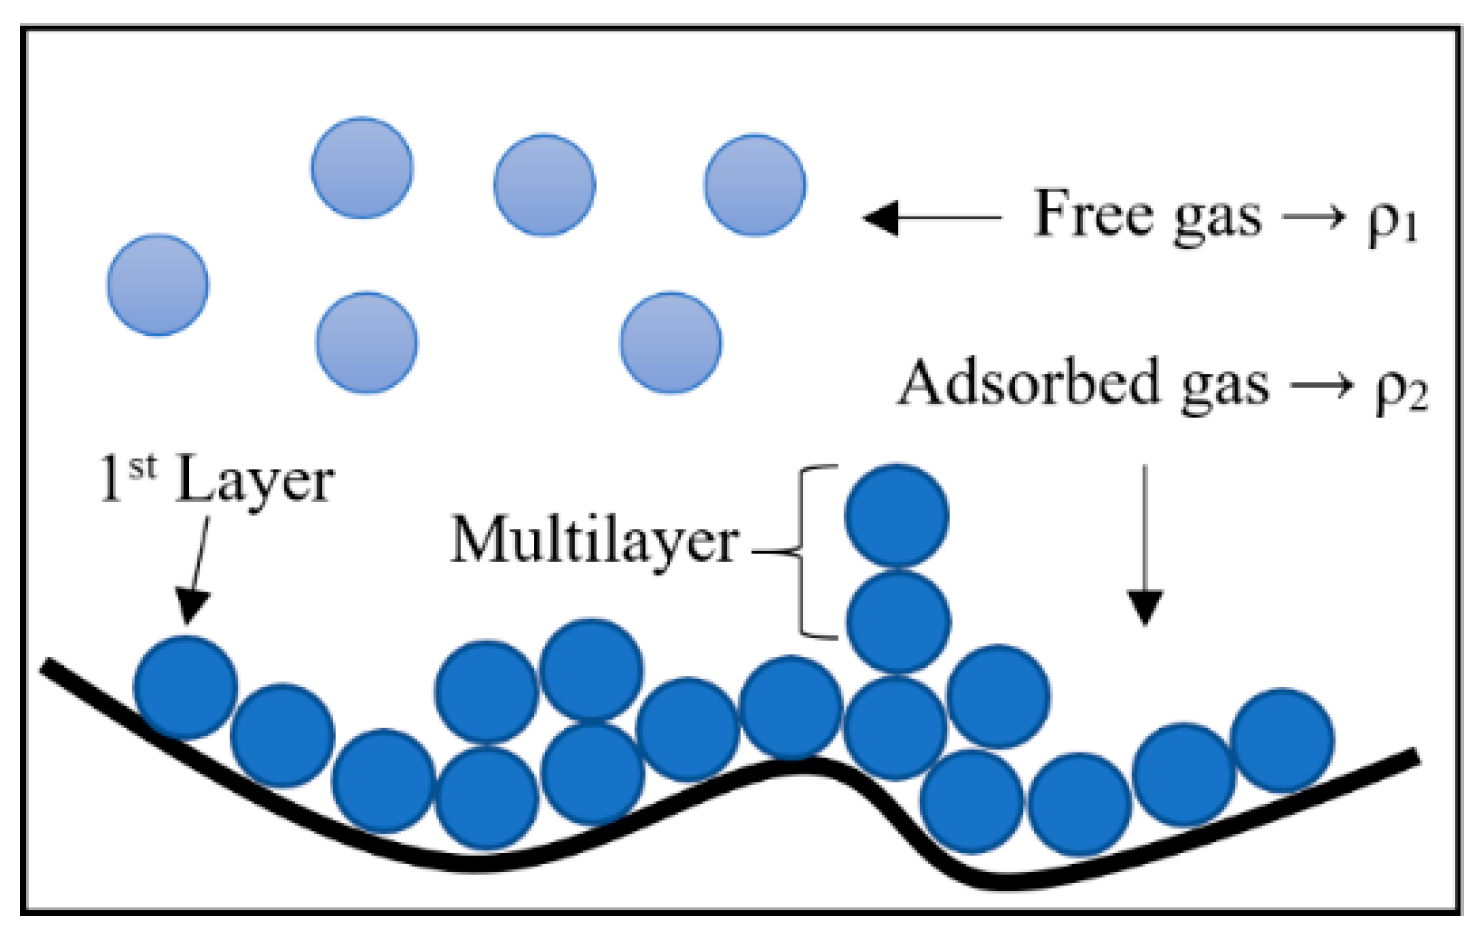
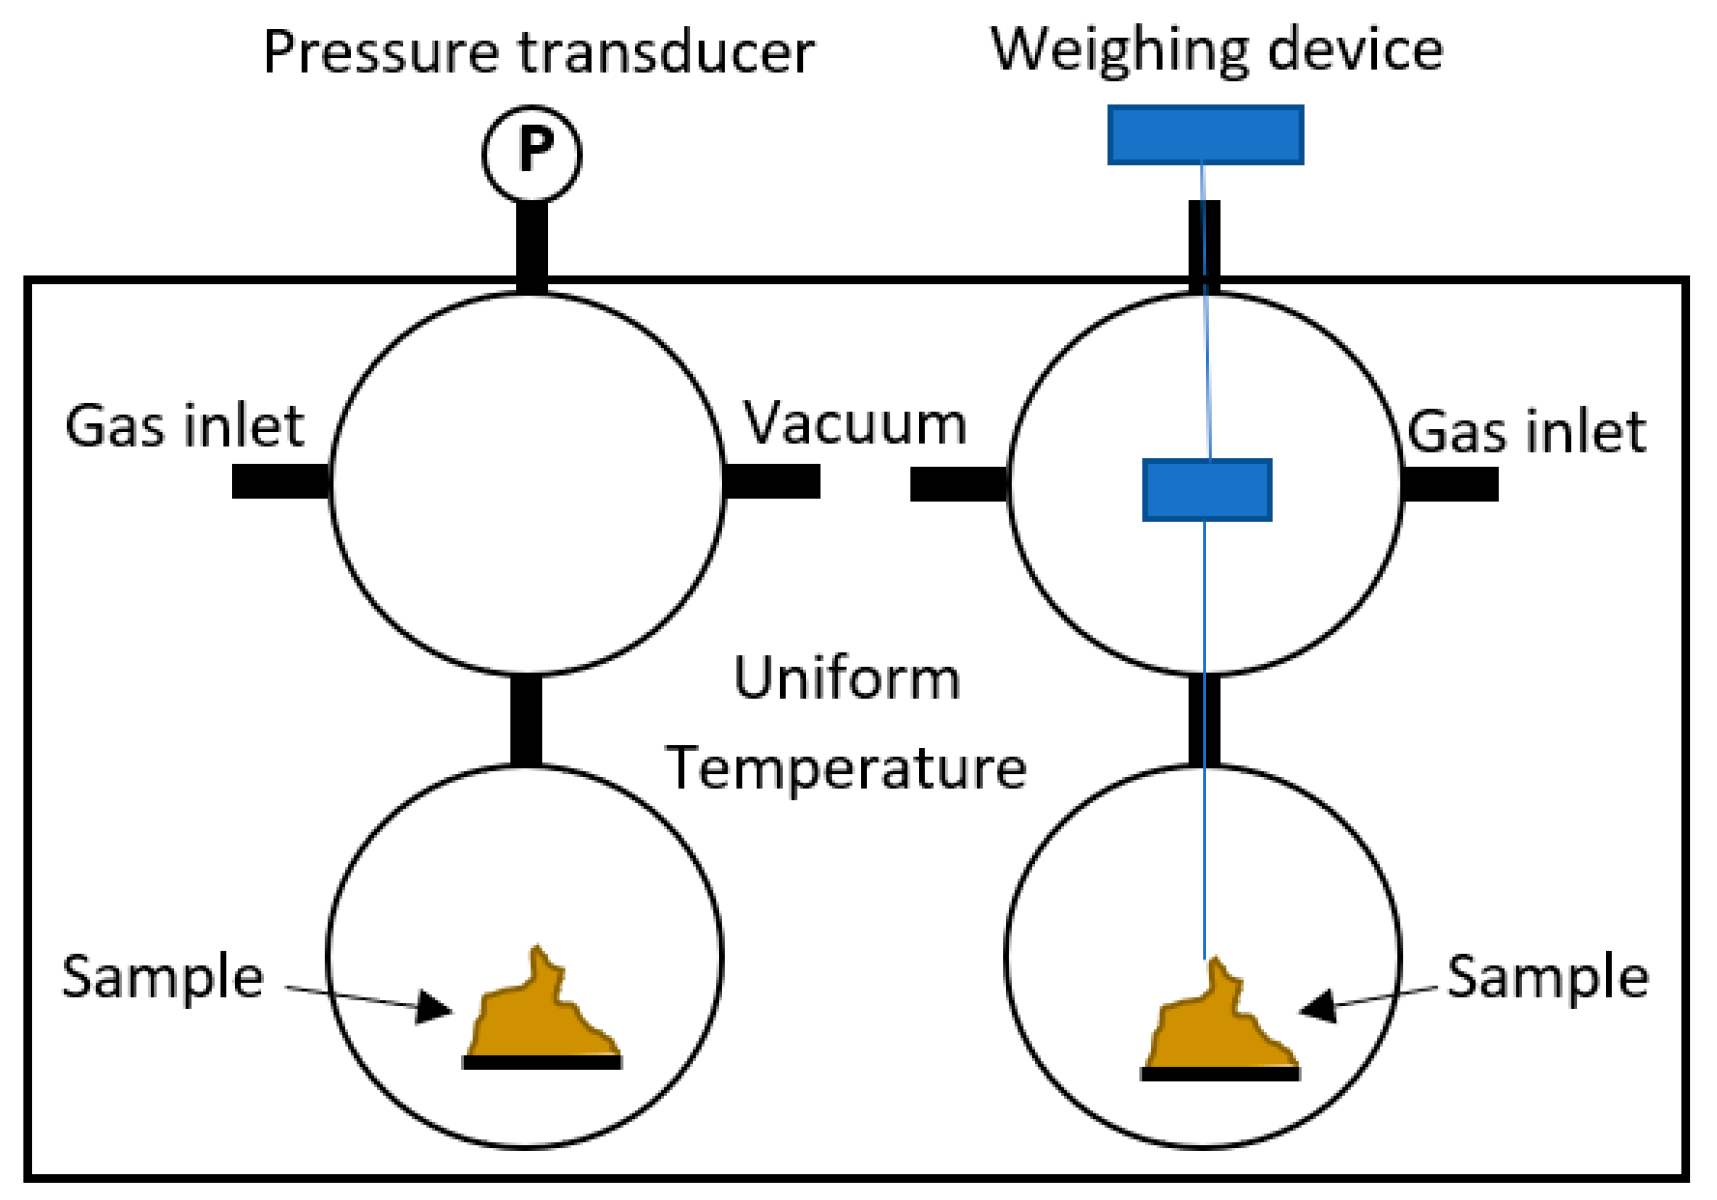
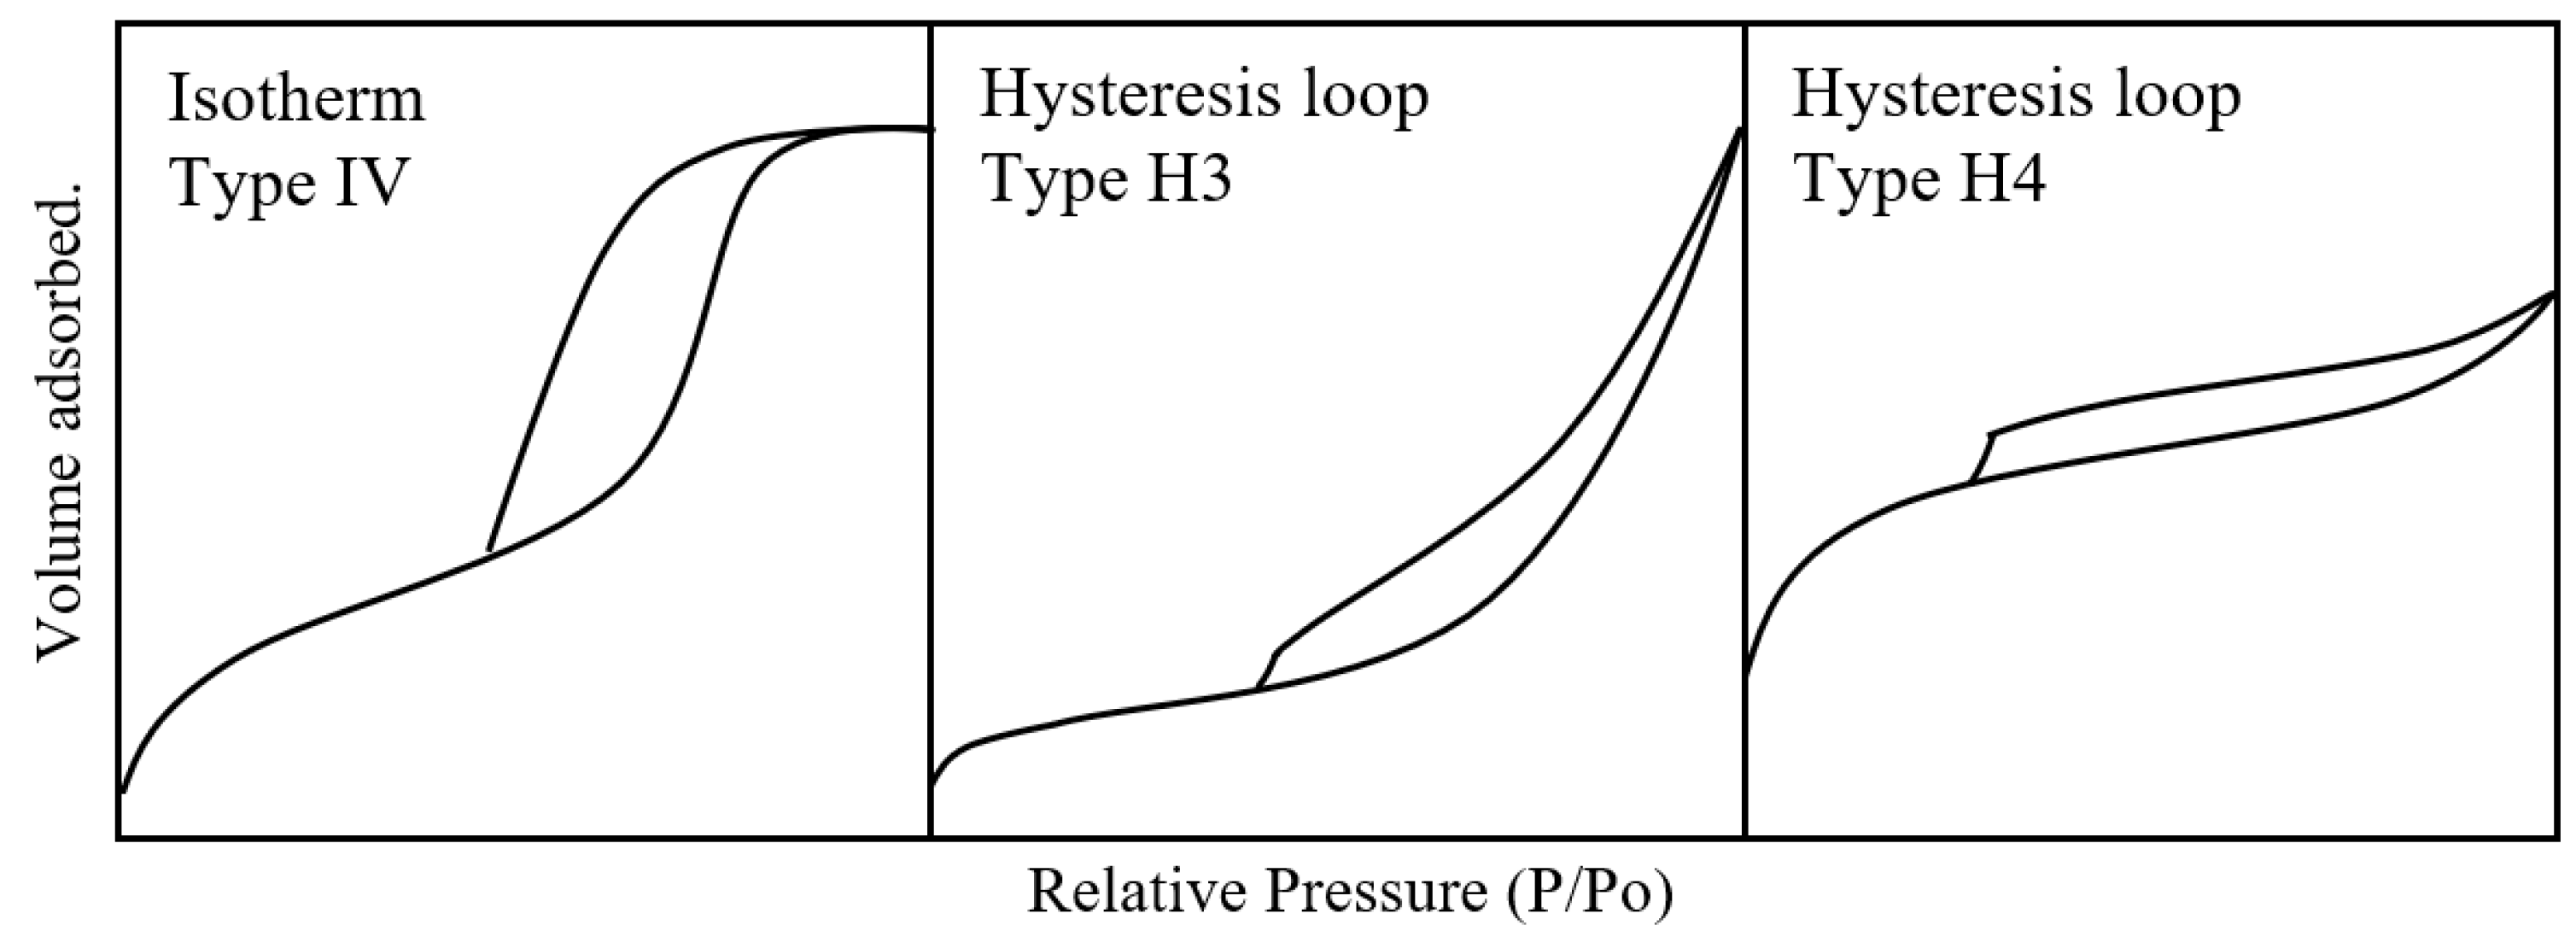
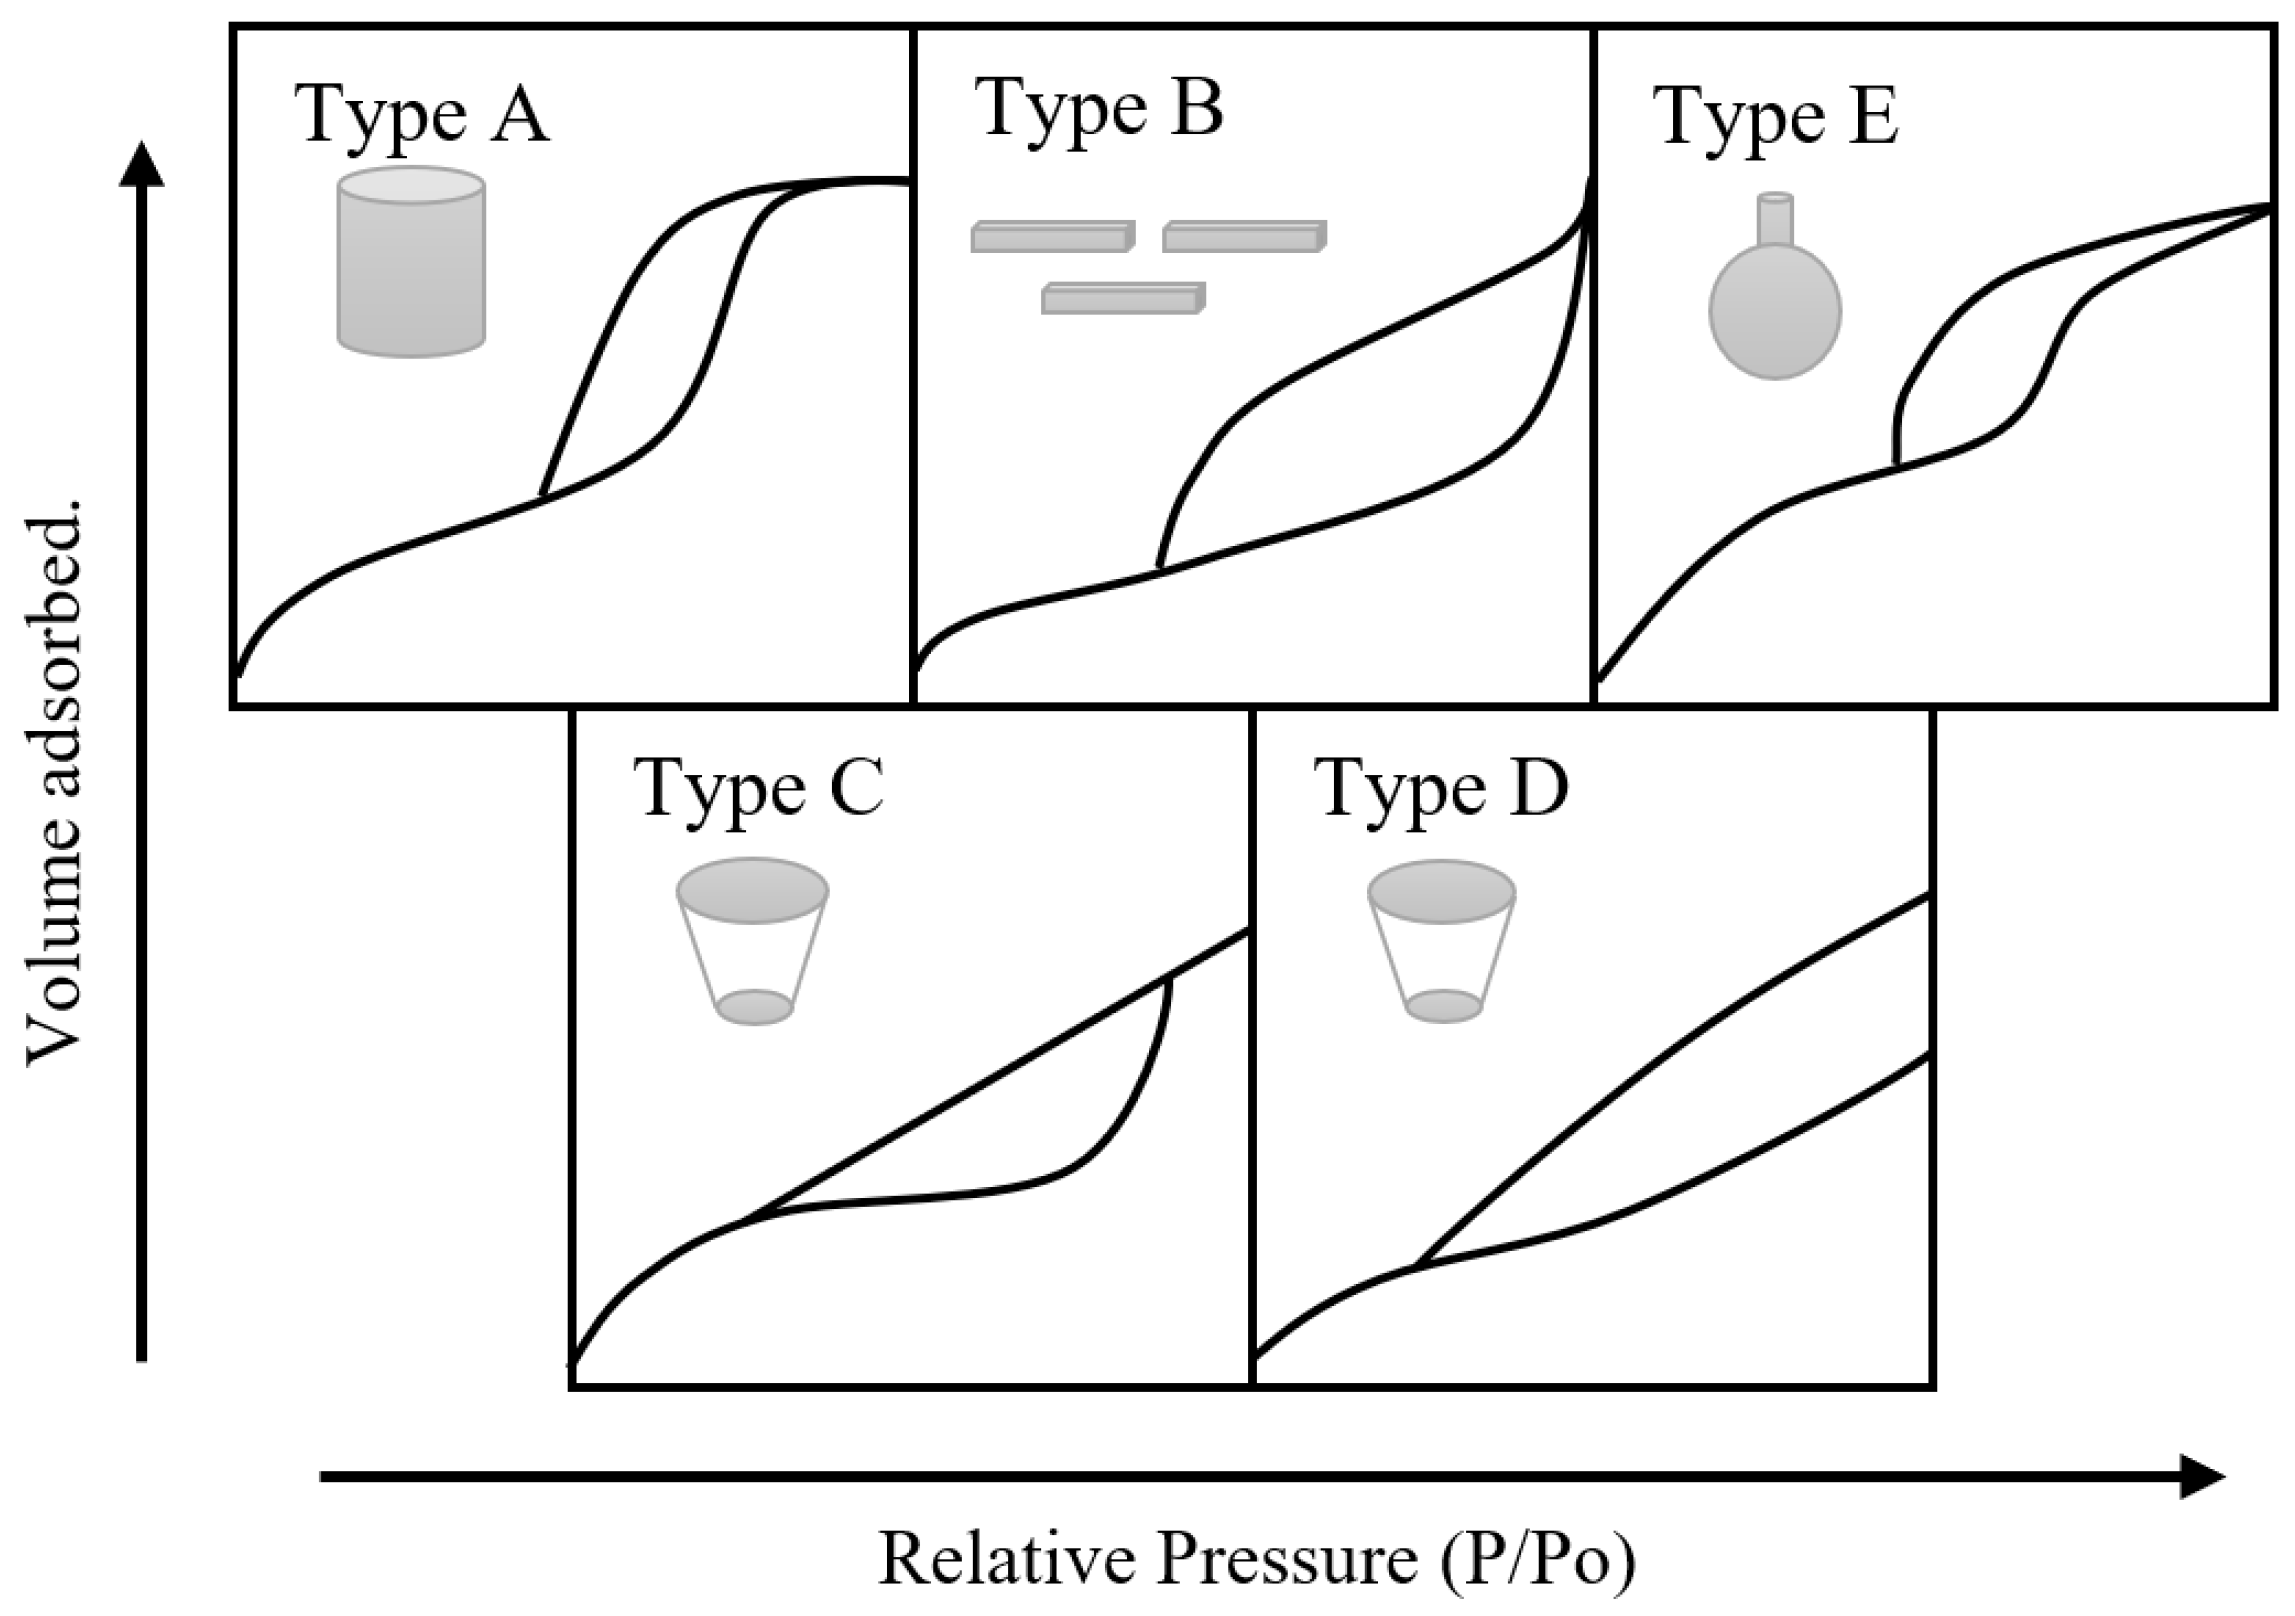
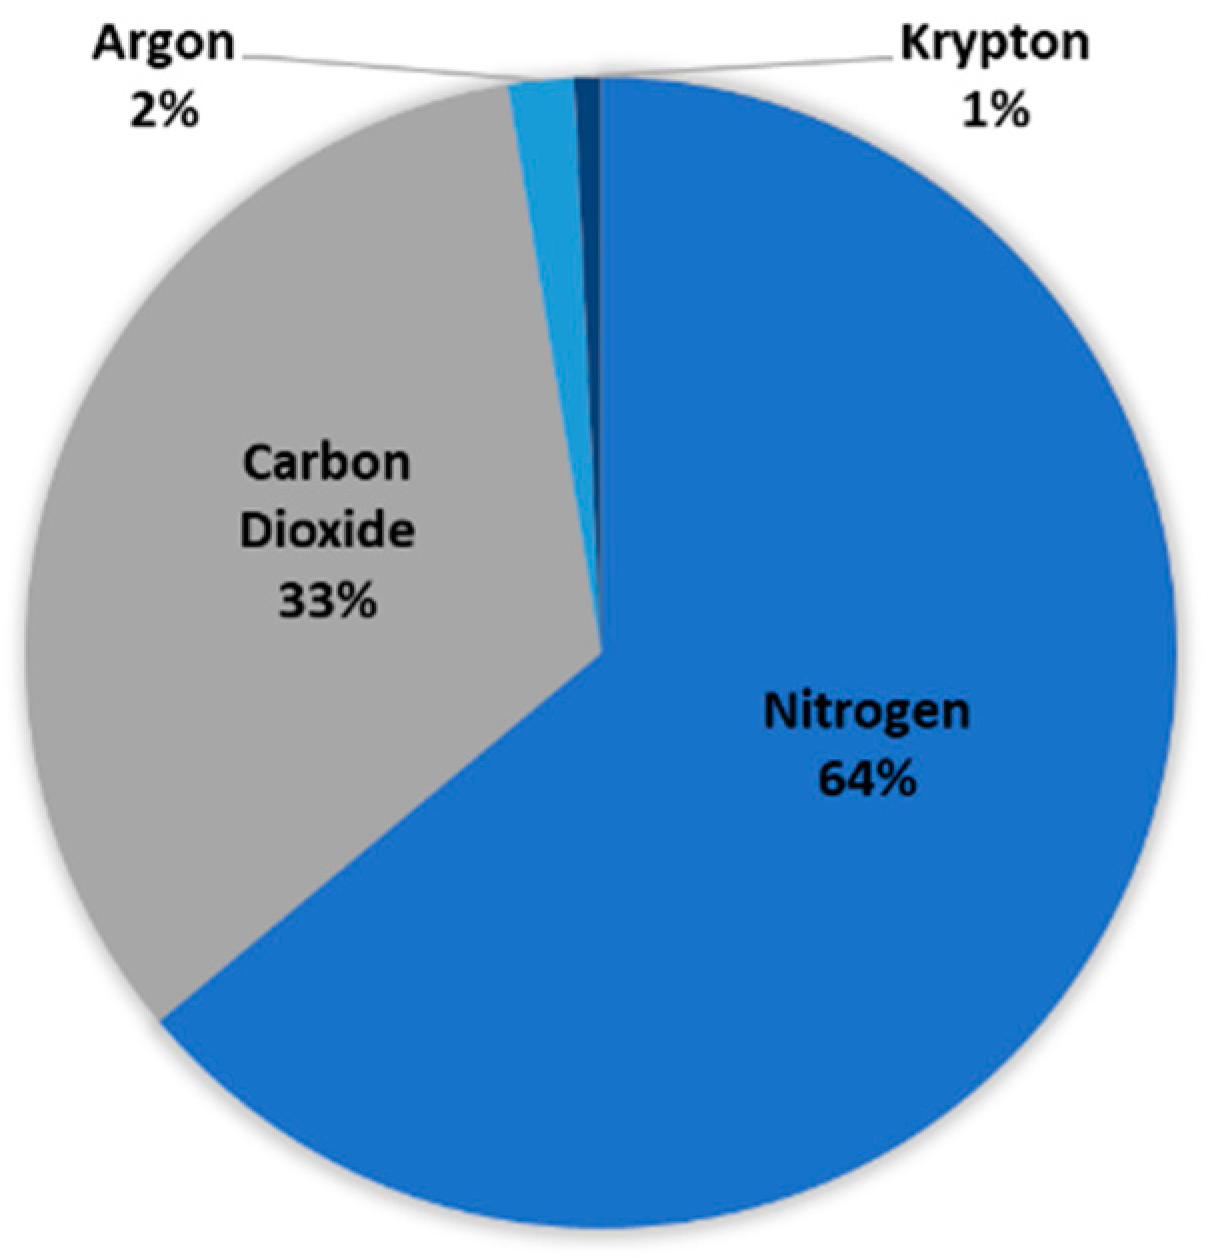
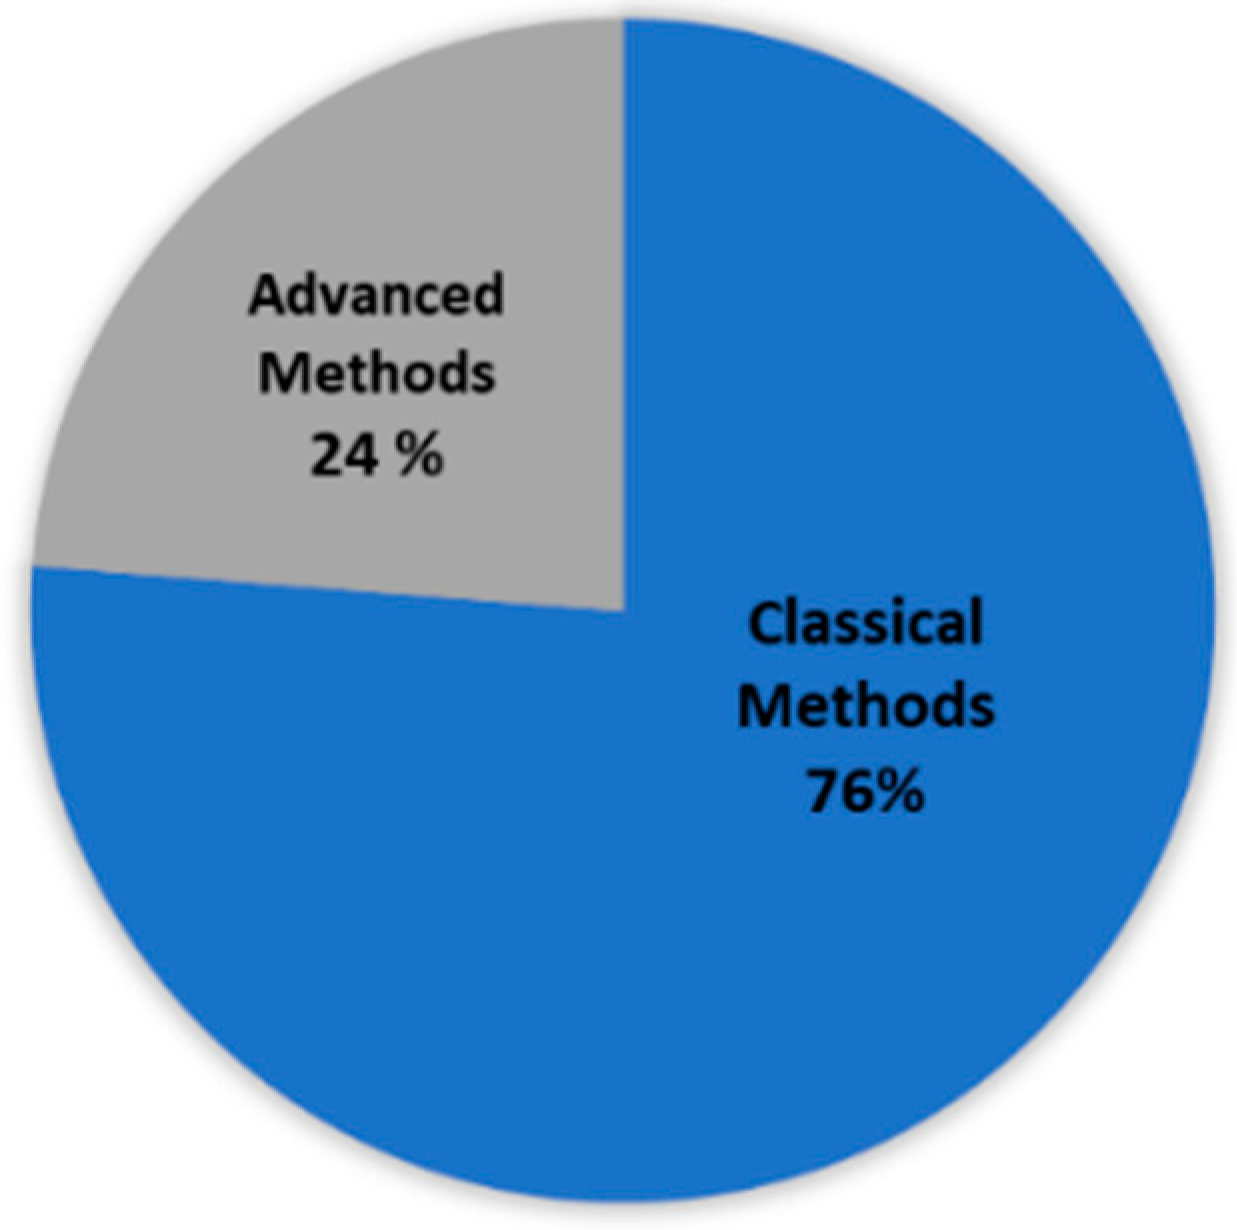
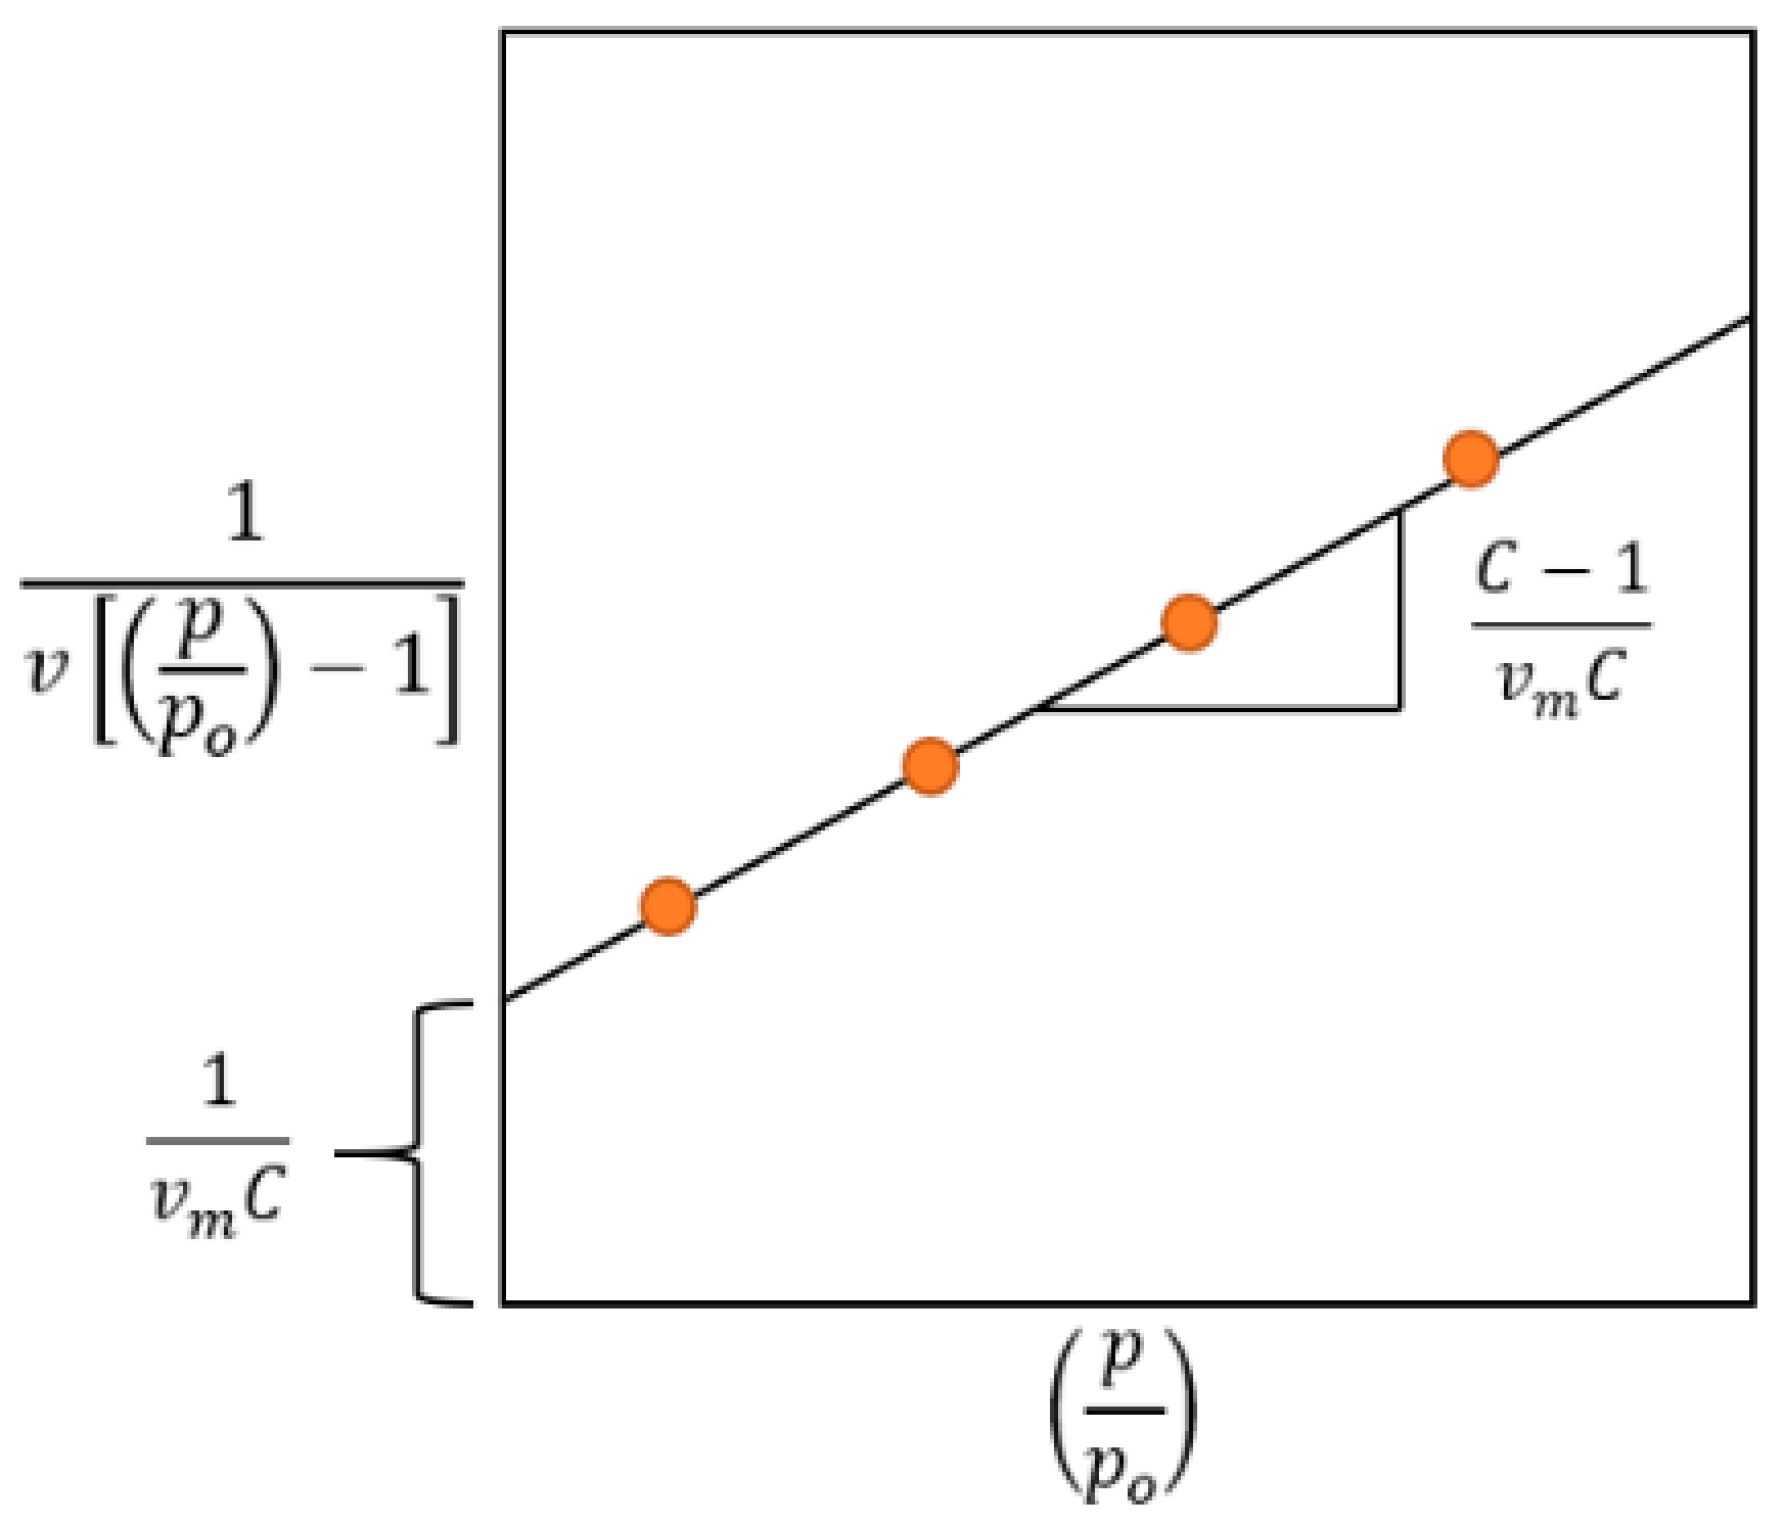
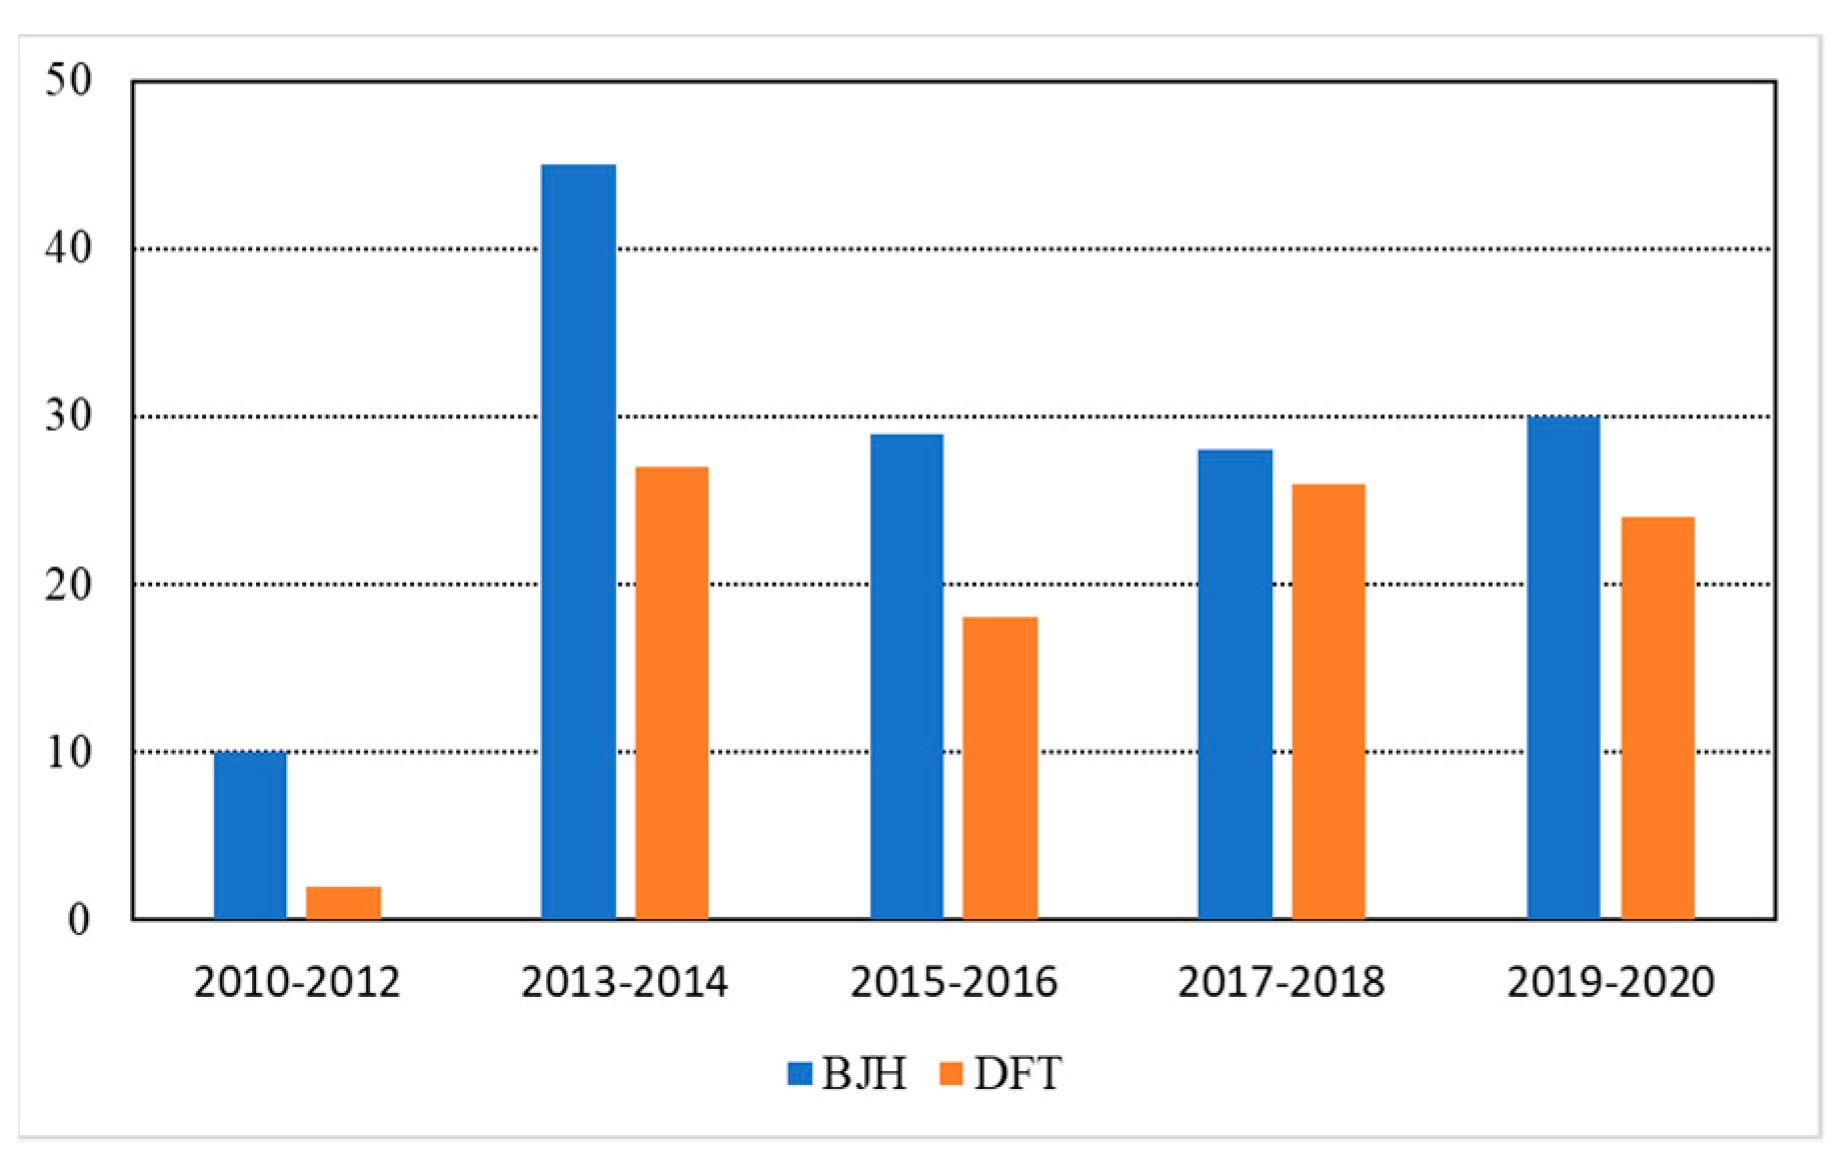
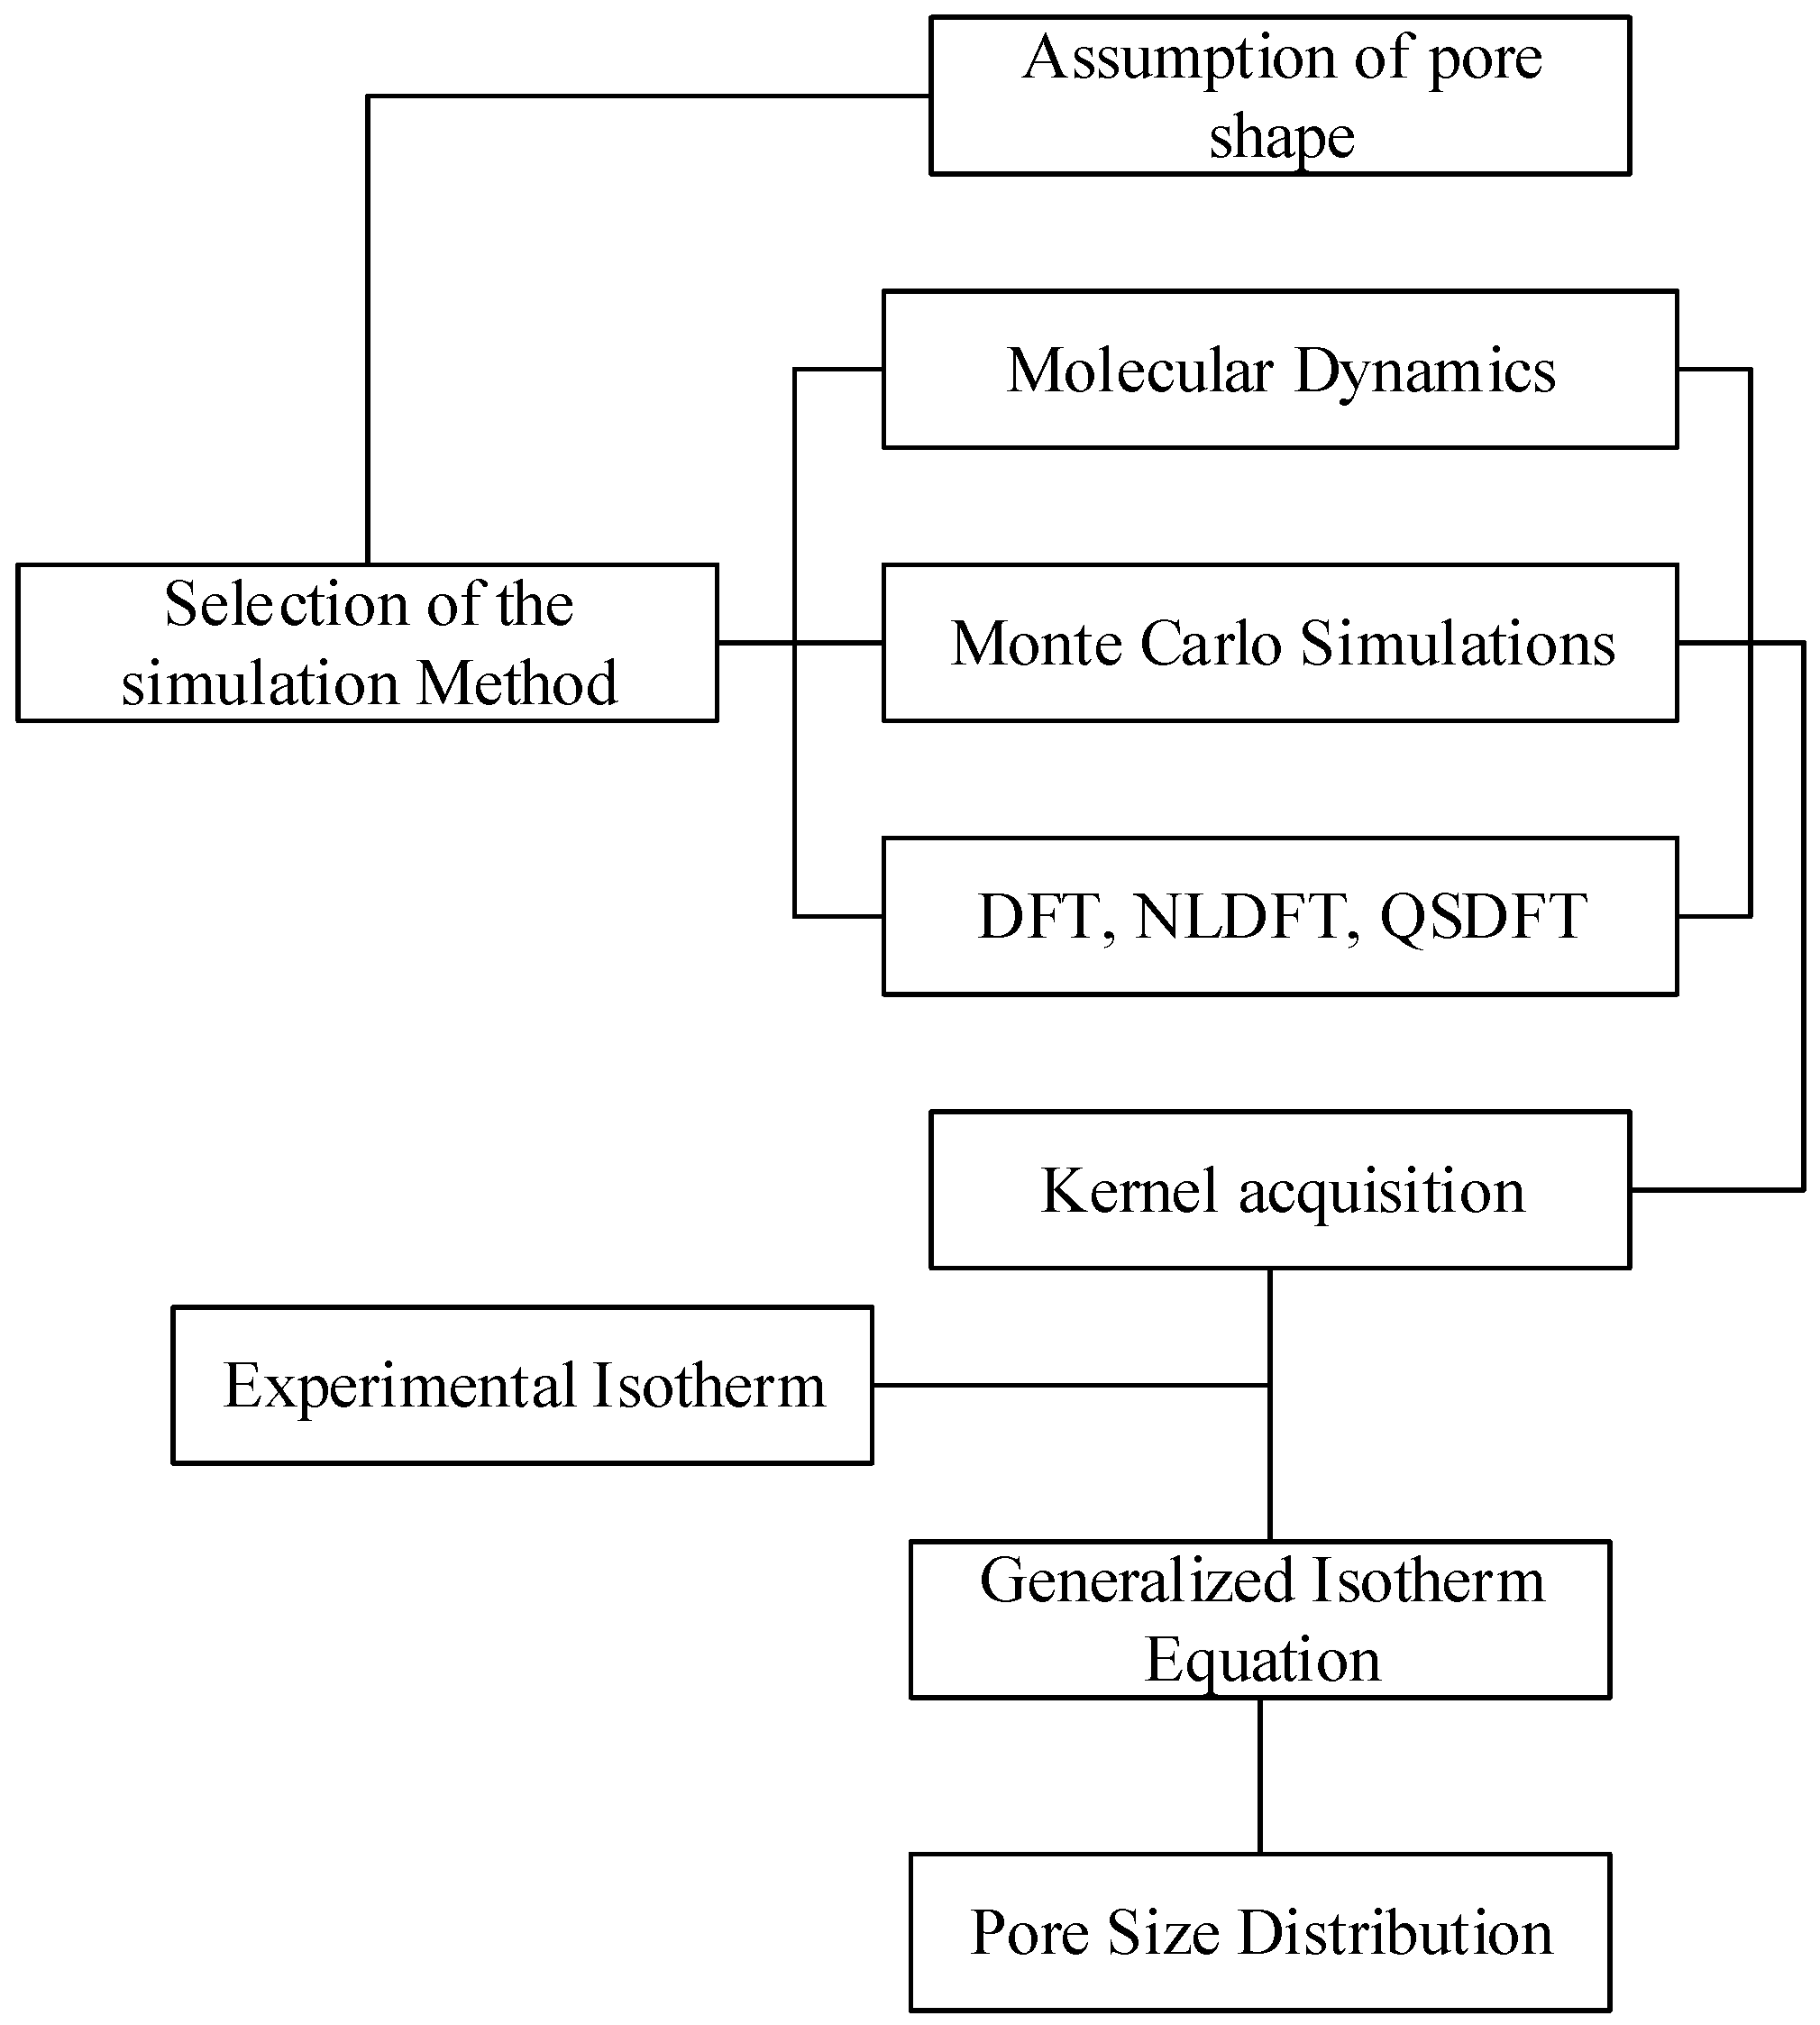
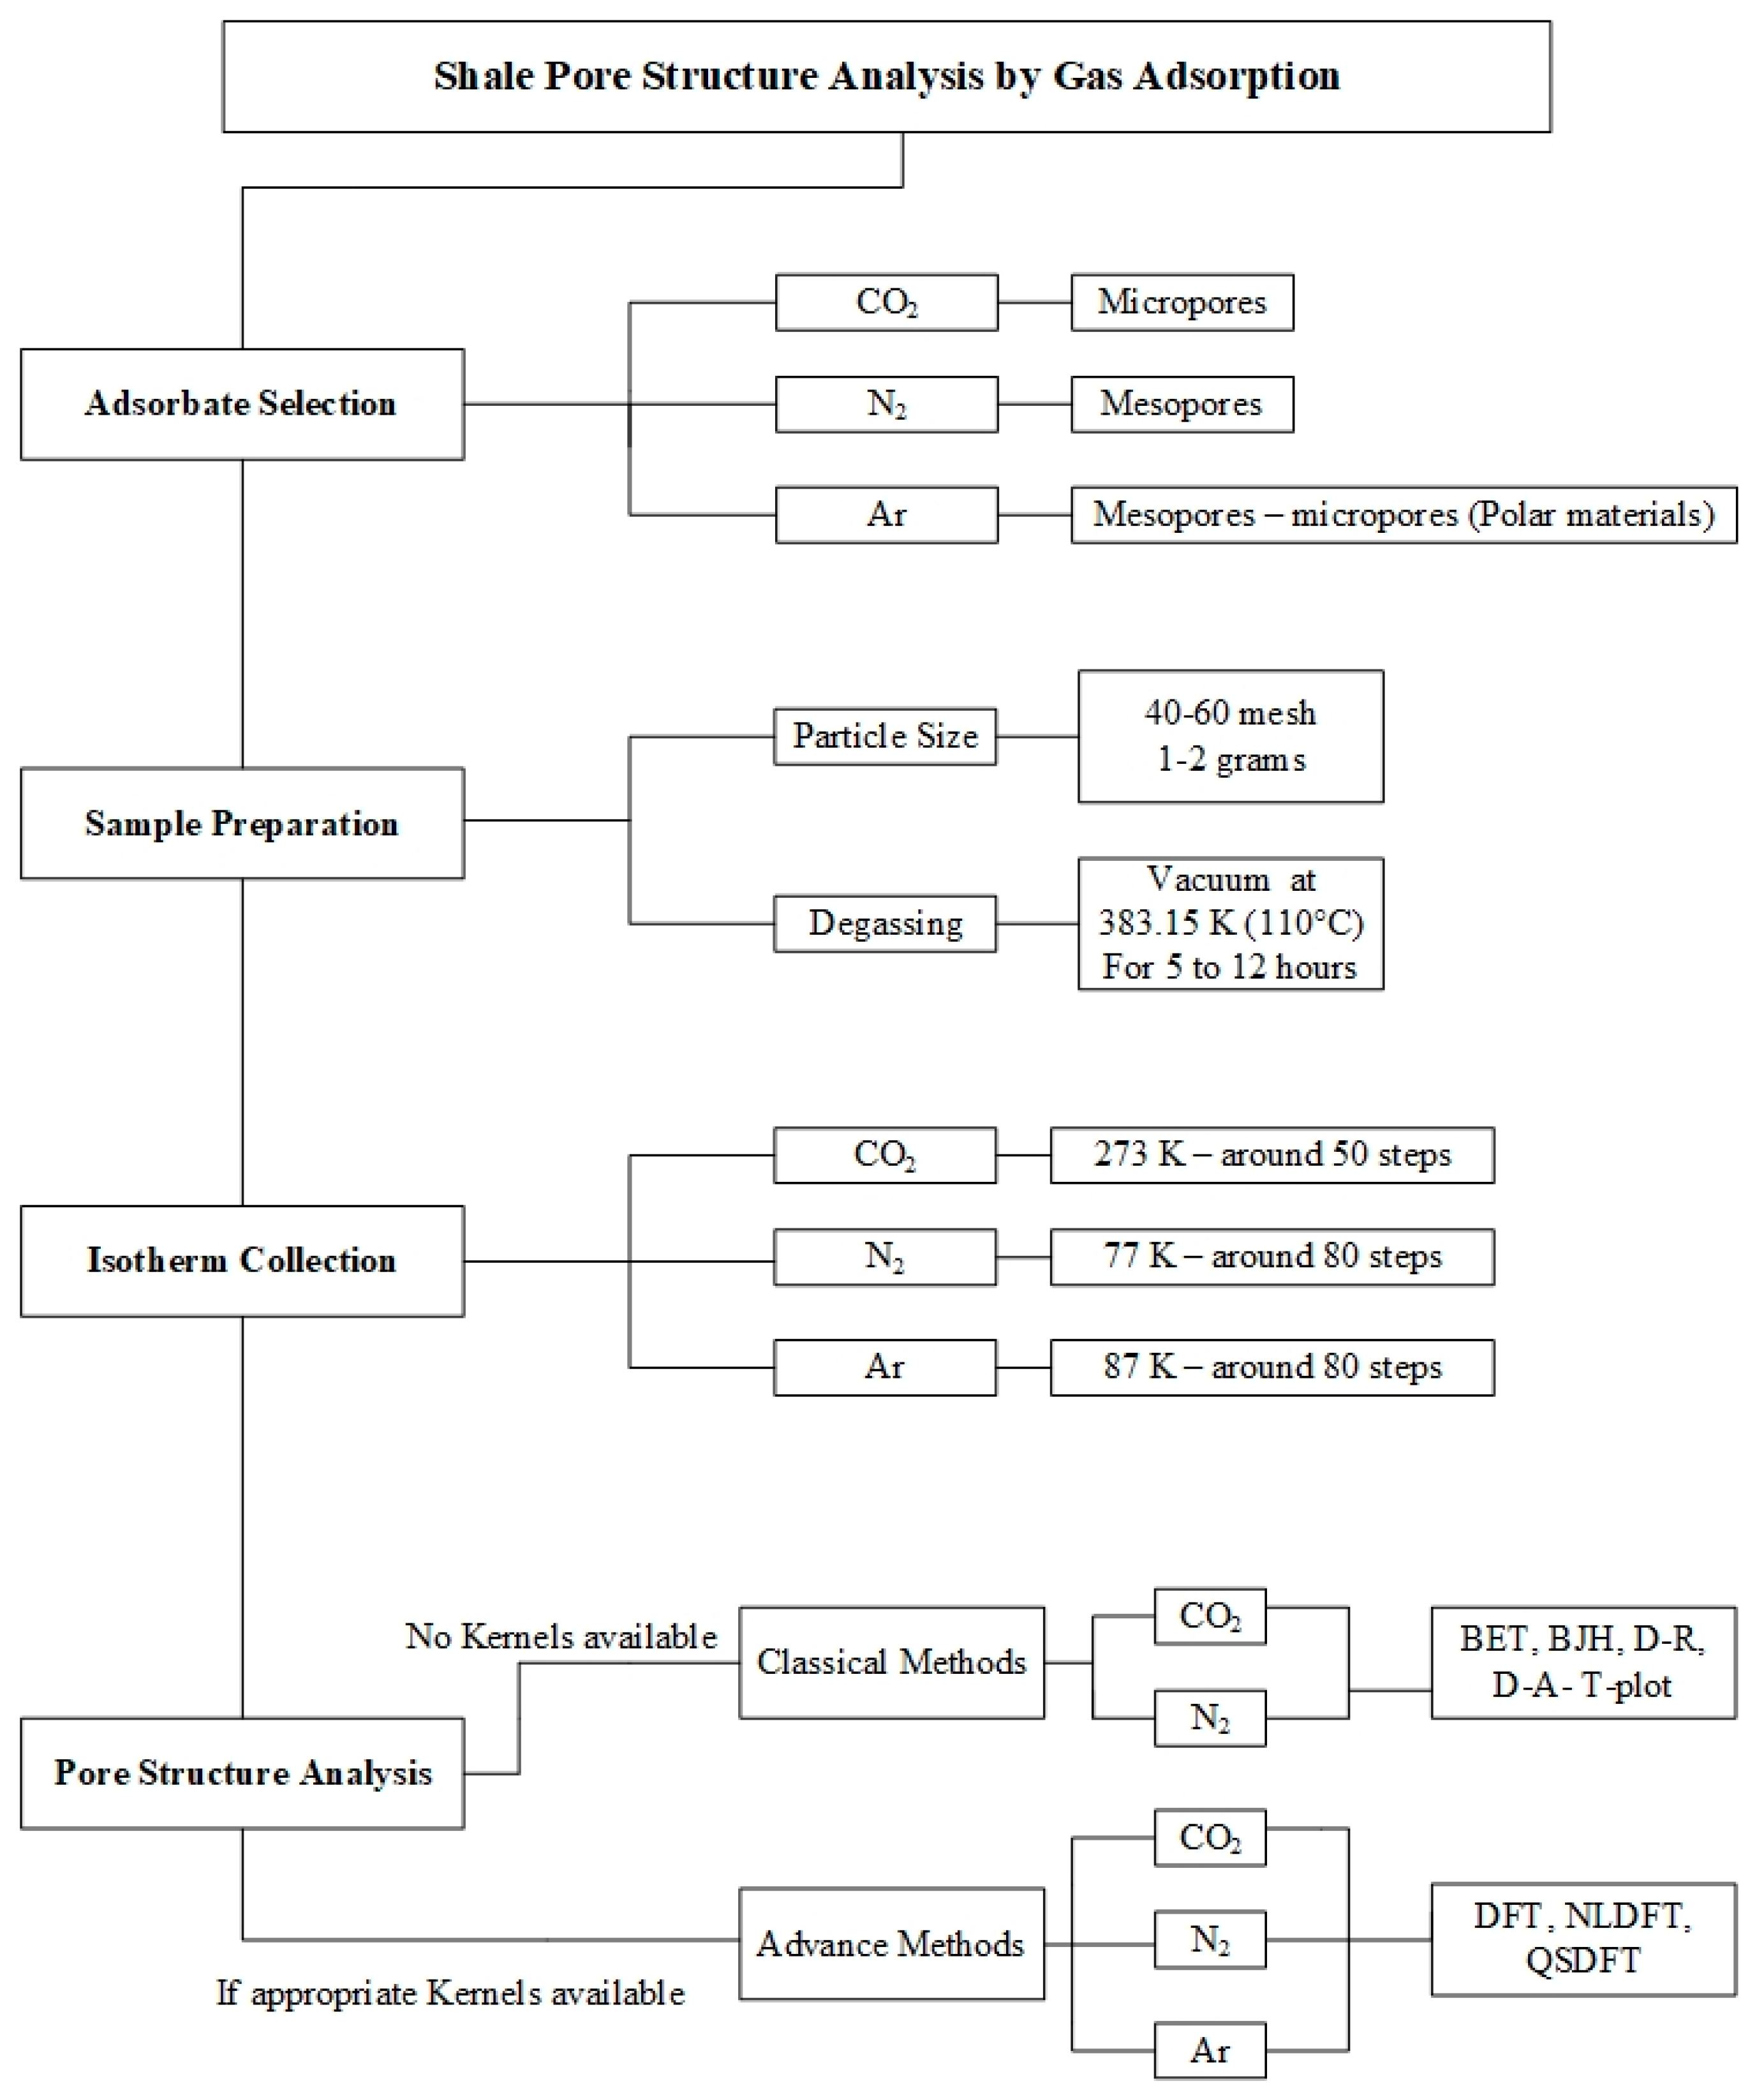
Table 1.
Gases used for shale characterization.
| Name | Formula | Kinetic Diameter (nm) | Common Use in Shales |
|---|---|---|---|
| Methane | CH4 | 0.380 | Storage capacity, Permeability |
| Helium | He | 0.260 | Porosity, void volume |
| Krypton | Kr | 0.360 | Permeability, Porosity, void volume |
| Argon | Ar | 0.340 | Permeability, Porosity, Pore size distribution |
| Nitrogen | N2 | 0.364 | Permeability, Porosity, Pore size distribution, Surface area |
| Carbon Dioxide | CO2 | 0.330 | Storage capacity, Permeability, Porosity, Pore size distribution |
Table 2.
Thickness equation commonly used for pore structure characterization.
| Harkins and Jura [98,99,100] | |
| Halsey [101] | |
| Broekhoff–de Boer [102] | |
| Kruk, Jaroniec, and Sayari [103,104] | |
| Carbon Black STSA [105] |
Table 3.
Dubinin equations.
| Dubinin–Radushkevich | |
| Dubinin–Astakhov |
Publisher’s Note: MDPI stays neutral with regard to jurisdictional claims in published maps and institutional affiliations. |
© 2021 by the authors. Licensee MDPI, Basel, Switzerland. This article is an open access article distributed under the terms and conditions of the Creative Commons Attribution (CC BY) license (https://creativecommons.org/licenses/by/4.0/).
Share and Cite
MDPI and ACS Style
Medina-Rodriguez, B.X.; Alvarado, V. Use of Gas Adsorption and Inversion Methods for Shale Pore Structure Characterization. Energies 2021, 14, 2880. https://doi.org/10.3390/en14102880
AMA Style
Medina-Rodriguez BX, Alvarado V. Use of Gas Adsorption and Inversion Methods for Shale Pore Structure Characterization. Energies. 2021; 14(10):2880. https://doi.org/10.3390/en14102880
Chicago/Turabian StyleMedina-Rodriguez, Bryan X., and Vladimir Alvarado. 2021. "Use of Gas Adsorption and Inversion Methods for Shale Pore Structure Characterization" Energies 14, no. 10: 2880. https://doi.org/10.3390/en14102880
Note that from the first issue of 2016, this journal uses article numbers instead of page numbers. See further details here.