
Effects of Supercritical CO2 on Matrix Permeability of Unconventional Formations

Department of Geophysics, Stanford University, Stanford, CA 94305, USA
*
Author to whom correspondence should be addressed.
Energies 2021, 14(4), 1101; https://doi.org/10.3390/en14041101
Submission received: 11 January 2021
/
Revised: 9 February 2021
/
Accepted: 12 February 2021
/
Published: 19 February 2021
(This article belongs to the Special Issue Multiscale and Multiphysics Processes in Unconventional Formations 2020)
Abstract
:We studied the effects of supercritical carbon dioxide (scCO2) on the matrix permeability of reservoir rocks from the Eagle Ford, Utica, and Wolfcamp formations. We measured permeability using argon before exposure of the samples to scCO2 over time periods ranging from days to weeks. We measured permeability (and the change of permeability with confining pressure) when both argon and scCO2 were the pore fluids. In all three formations, we generally observe a negative correlation between initial permeability and carbonate content—the higher the carbonate content, the lower the initial permeability. In clay- and organic-rich samples, swelling of the matrix resulting from adsorption decreased the permeability by about 50% when the pore fluid was scCO2 although this permeability change is largely reversible. In carbonate-rich samples, dissolution of carbonate minerals by carbonic acid irreversibly increased matrix permeability, in some cases by more than one order of magnitude. This dissolution also increases the pressure dependence of permeability apparently due to enhanced mechanical compaction. Despite these trends, we observed no general correlation between mineralogy and the magnitude of the change in permeability with argon before and after exposure to scCO2. Flow of scCO2 through μm-scale cracks appears to play an important role in determining matrix permeability and the pressure dependence of permeability. Extended permeability measurements show that while adsorption is nearly instantaneous and reversible, dissolution is time-dependent, probably owing to reaction kinetics. Our results indicate that the composition and microstructure of matrix flow pathways control both the initial permeability and how permeability changes after interaction with scCO2. Electron microscopy images with Back-Scattered Electron (BSE) and Energy Dispersive Spectroscopy (EDS) revealed dissolution and etching of calcite minerals and precipitation of calcium sulfide resulting from exposure to scCO2.
1. Introduction
Geological carbon capture and sequestration (CCS) is one of the most effective approaches in dealing with climate change [1]. However, it is not yet economically viable to inject carbon dioxide into saline formations [2]. Storage of carbon dioxide (CO2) in unconventional formations has gained a lot of attention in recent years (e.g., [3,4]). In addition, employing CO2 as the hydraulic fracturing fluid in unconventional formations is a potential approach to economically sequester CO2 [5,6]. These formations are consisted of ultrafine-grained rocks termed as “shale” with a combination of different minerals including clays, carbonates, quartz, feldspars, and pyrite, as well as organic matter [7]. Shale rocks typically: (i) present small pore sizes, and (ii) have a very low permeability, ranging from 10−21 to 10−18 m2 [8].
Carbon dioxide transitions to supercritical phase at pressures and temperatures above 8.31 MPa and ~31.1 °C, respectively, which correspond to depths greater than ~900 m. The unconventional formations are usually located at a depth of 1–3 km [9]. Hence, we are dealing with supercritical carbon dioxide (scCO2), which is a non-aqueous fluid with near-gas viscosity and near-liquid density. Its lower viscosity compared to water causes easier flow in the shale matrix, and therefore, its leak-off is significantly higher than that of water [10]. However, its production-wise overall efficiency remains to be answered.
Another important aspect of scCO2 is its reactivity with shale matrix [11,12,13,14,15]. Dissolution of carbonate minerals in the presence of water, caused by carbonic acid, has an important role on altering the micro-structure of shale rocks 15]. A number of studies have investigated the alterations of pore structure resulted from interaction with dry scCO2 and scCO2-saturated brine [16,17,18,19]. Dry scCO2 was found to be reacting with carbonates in cycles of dissolution and precipitation, resulting in etches on the surface of samples [16]. Moreover, Fourier-Transform Infrared (FT-IR) spectroscopy revealed changes to the bonds of carbonate minerals, while introducing new bonds for CO2-kerogen interface [17]. The surface area and the ratio of meso/micro-pores to nano-pores changed after interaction with scCO2 [18]. Adsorption is, on the other hand, the process of uptaking scCO2 by clays and kerogen, induced by changes in electrostatic charge [20,21]. Comparison between Utica and Marcellus samples revealed that the clay type has an influence on the extent of adsorption. For example illite has a lower adsorption capacity compared to mixed illite/smectite layers [19].
Most of the laboratory studies have focused on permeability changes in shale rocks that are caused by interaction with scCO2-saturated brine. There are limited experimental studies on the effects of dry scCO2 on matrix permeability of shale rocks [10,22,23]. After interaction with scCO2, shale rocks exhibit a sorption-induced strain resulting in a reduction in permeability [20,22,24], with a more substantial permeability reduction for vertical samples compared to horizontal samples [22]. The emphasis of these studies, however, were centered around pore space characterization before and after interaction with scCO2. There are some studies on interaction of dry scCO2 and fractured shale samples, which are out of the scope of this study [25]. In this paper, we study the effects of scCO2 on stress-dependent permeability of carbonate- and clay-rich shale samples. Argon gas was used to measure permeability of the samples before and after exposure to scCO2. In addition, scCO2 permeability values were measured as an additional index to better quantify the processes involved in the response of the samples. The permeability measurements were made by either modified pulse-decay or steady-state methods, depending on the initial permeability.
2. Materials and Methods
2.1. Samples
We received core samples from the Wolfcamp, Eagle Ford, and Utica formations, all in “bare rock” status. Wolfcamp is a four-section stacked formation deposited from late Pennsylvanian to late Wolfcampian in the Permian Basin, with a variation of porosity and TOC (total organic content) between 2–12% and 0.6–6%, respectively [26]. In particular, the Wolfcamp cores used in this study were obtained from a horizontal well in Midland Basin (Texas, USA). Eagle Ford is a two-unit formation located below Austin Chalk and above Buda Limestone, deposited in Late Cretaceous geological period. It is a calcareous formation (carbonate content of 40–90%) with porosity and TOC ranging from 2–8% and 2–12%, respectively. The cores were extracted from a horizontal well located in Texas, USA. Utica is a stacked Middle-Ordovician aged formation located in Appalachian basin, extending through Ohio, Pennsylvania, West Virginia, New York, and Quebec. It contains calcareous shale with calcite ranging from 10–60%, while its TOC varies from ~3% to ~8%. The Utica core that was used in this study was extracted from a horizontal well in Ohio, USA.
We used a MiniFlex 600 XRD machine (Rigaku, Tokyo, Japan) to determine the mineralogical composition of the cores. As illustrated in Table 1, composition of the cores from Wolfcamp formation significantly varies, whereas the Eagle Ford cores have relatively similar mineral composition. The single core from Utica has considerable amount of clays and kerogen, while its carbonate content is moderate. In addition, the RockEval analysis revealed that the organic matter type for Wolfcamp and Eagle Ford samples are gas-prone and mixed oil/gas-prone, respectively.
The cores were first sub-cored into 1-inch diameter cylindrical plugs, which were then saw-cut into disk-shaped samples with lengths of 0.2–0.3 inches. Sandpaper was subsequently used to make sure that the surface of the sample is even and prepared to put into the test vessel. Please note that the samples were not dried to keep the in-situ conditions of the samples and allow the reaction of carbonates and scCO2 in the presence of in-situ pore water.
2.2. Experimental Procedure
A customized-made hydrostatic test chamber (as shown in Figure 1a) with proper isolation (by polystyrene) was used to perform permeability tests. A heater, a thermostat, and a fan were put inside the chamber to maintain an elevated and distributed temperature. A temperature probe (Omega Engineering, Norwalk, CT, USA) was used to monitor the temperature at different locations inside the chamber throughout the experiments. Each disk-shaped sample was put into a thick Viton jacket (as shown in Figure 1b), then placed between two core-holders in the test vessel (see Figure 1a). Mineral oil was used to apply the confining pressure with the use of an ISCO pump (Teledyne Technologies, Thousand Oaks, CA, USA). The pore pressure tubes were connected to the sample through core-holders. Upstream and downstream pore pressures were applied using a Quizix 6000 pump (Chandler Engineering, Tulsa, OK), with argon and scCO2 as pore fluids.
2.3. Experimental Program
Figure 2 shows the stress path that was followed during the tests. A confining pressure of ~1 MPa was first applied for 24 h, followed by vacuuming the pore pressure tubes and the sample for 24 h. Then confining pressure seasoning was performed to minimize stress-relief-induced changes in the microstructure of the sample, followed by application of a confining pressure of 20 MPa for a few hours. Subsequently, a pore pressure of 10 MPa was applied at both upstream and downstream sides, with 24 h for equilibrium of pore pressures. A cycle of argon permeability was then performed at effective stresses of 10 MPa (loading and unloading) and 30 MPa. Afterwards, the pore pressures were removed, and the sample/tubes were vacuumed for 24 h to remove any residual argon. Supercritical CO2 was then introduced into the sample, with an equilibrium/reaction time of 72 h. The same cycle of effective stress, as that of argon, was applied and three permeability measurements were made. Finally, another cycle of argon permeability measurement was performed. The cycles of pre-scCO2 argon, scCO2, and post-scCO2 argon permeabilities were labeled as C1, C2, and C3, respectively. The temperature in the chamber was set at ~40 °C to make sure that CO2 is in supercritical state.
For two samples (namely 3-2H and 4-2H), two additional scCO2 cycles followed by a last argon cycle (with same stress conditions as the first three cycles) were performed. The aim was to assess the effects of scCO2 over prolonged periods of time on already-reacted samples. After completion of post-scCO2 argon permeability (C3 cycle), the sample/tubes were vacuumed, and two cycles of scCO2 permeability, labeled as “Second scCO2; C4 cycle” and “Third scCO2; C5 cycle”, were performed with an equilibrium/reaction time of 72 h prior to each cycle. Subsequently, a last cycle of argon permeability (namely, “Last Argon; C6 cycle”) was performed. On the other hand, for the Utica sample 1-42-3H, upon completion of C3 (argon) cycle, we let the sample interact with scCO2 for a period of three weeks, following by a single permeability measurement with scCO2 succeeded by argon permeability measurement at the same effective stress.
2.4. Permeability Measurement
The permeability measurements were made by either steady-state or modified pulse-decay methods, with the latter implemented for samples with permeability values lower than 10−19 m2. In steady-state measurements, the pore pressure was set constant at downstream side (at 10 MPa), while, the volumetric flow rate was set to a prescribed constant value at the upstream side. Then, the recorded upstream pore pressure (after reaching equilibrium state) was used to estimate pore pressure difference between upstream and downstream sides. Finally, the modified Darcy’s law [27], to consider gas compressibility effects, was implemented to estimate the permeability of the samples as follows:
where k is the sample’s permeability (m2), Q is the inlet volumetric flow rate at the upstream side (m3/s), μ is the dynamic viscosity (Pa.s), L is the length of the sample (m), PUS and PDS are the upstream and downstream pore pressures, respectively, and A is the cross section area of the sample (m2). Figure 3a shows an example of one steady-state measurement, indicating equilibrium of differential pore pressure.
For ultra-low-permeability samples (below 10−19 m2), a modified pulse-decay approach was used [28,29]. In this method, we first set upstream and downstream pore pressures at 10 MPa. Then, the upstream pore pressure is increased by 0.3–1.5 MPa (depending on the sample) to induce pressure diffusion, while practically no fluid flow occurs over the experimental time-scales due to very low permeability values. The upstream pore pressure is then maintained at a constant value (at 10.3–11.5 MPa; depending on the sample), which eliminates the experimental errors associated with leakage at the upstream side. On the other hand, the downstream pore pressure is left uncontrolled (at an initial value of 10 MPa) and its evolution is recorded, which increases over time to reach to upstream pore pressure. Figure 3b illustrates an example of upstream and downstream pore pressures during a modified pulse-decay test. The time-dependent differential pore pressure (ΔP(t)) follows an exponential evolution, which can be expressed as:
in which ΔP(t) and ΔP0 are the differential pore pressures at time t and 0, respectively, and α is the slope of the plot of log(ΔP(t)) vs. time. Then, the permeability can be estimated based on the following formula:
where β is isothermal gas compressibility (Pa−1) at a given pressure and temperature conditions and Vdown is the downstream volume (m3). Please note that it is assumed that no fluid flow occurs from upstream to downstream, therefore, the volume of downstream should be constant throughout the experiment, otherwise, the measurements defy the assumptions of this method and are not valid.
2.5. Imaging
An Apreo S LoVac Scanning Electron Microscope (SEM; Thermo Fisher Scientific, Waltham, MA) was used to conduct pore-scale imaging on both untested and tested samples, which were cut from the same core. The imaging was performed in back-scattered electron (BSE) mode, in which, the brightness/darkness of the different regions in the image can indicate different minerals, organic matter, or porosity. Energy dispersive spectroscopy (EDS) maps were also obtained in order to identify micro-structural changes in the samples. Comparison of untested and tested BSE/EDS images in different samples might provide some insights into various mechanisms involved in permeability alteration caused by interaction with scCO2.
3. Results and Data Analysis
We categorize data obtained from the suite of experiments based on the processes/phenomena observed for each sample. Namely these include “Mineral dissolution”, “Adsorption into clays and organic matter”, “Matrix weakening”, and “Competing effects of mineral dissolution and adsorption”, which are presented in Section 3.1 through Section 3.4. In addition, Table 2, provides a brief summary of the processes/phenomena involved with each sample and its net increase/decrease of permeability caused by interaction with scCO2. Further discussions on the observations of permeability changes are provided in Section 4.
3.1. Mineral Dissolution
Samples 2-1H and 4-2H show increase in their permeability upon exposure to scCO2. The former is a carbonate-rich sample with an initial permeability of less than 10−21 m2 (<1 nD), while the latter is a carbonate-poor sample with an initial permeability of ~10−18 m2 (~ 1 μD). Despite the significant differences in their mineralogical content and initial permeabilities, both samples show a substantial degree of permeability increase due to mineral dissolution. It is likely that the lower permeability sample (2-1H) experiences carbonate dissolution in the pore throats, while dissolution of calcite-filled micro-cracks is likely to occur in the higher permeability sample (4-2H). Section 3.1.1 and Section 3.1.2 provide detailed observations for samples 2-1H and 4-2H, respectively.
3.1.1. Sample 2-1H; Ultralow-Permeability, Carbonate-Rich
Figure 4 illustrates the permeability values of sample 2-1H, with a carbonate content of ~71%. Pre-CO2 argon (i.e., C1) cycle has a permeability of 6.85 × 10⁻²² m2 at an effective stress of 10 MPa (σ = CP – PP = 20 − 10 = 10 MPa). The very low permeability of the sample suggests that critical flow necks, necessary for fluid flow, are substantially tiny. This can be explained by chemical diagenesis due to very high carbonate content [30], despite negligible clay and organic matter content (~1%) that are traditionally regarded as important in filling the inter-granular space between quartz and calcite minerals. Increasing effective stress (σ) from 10 to 30 MPa, reduces permeability by 27% resulting in a permeability of 5.01 × 10⁻²² m2. Eventually, upon unloading the sample to σ = 10 MPa, permeability recovers by 98%, suggesting that the sample does not experience permanent closure of flow paths during loading. The mild pressure dependence of permeability and the negligible degree of irrecoverable permeability can be attributed to the negligible amount of clay minerals, organic matter, and micro-cracks which are the most compliant and plastically deformed components of shale rocks.
After three days of interaction with scCO2, permeability increases by more than one order of magnitude to a value of 1.60 × 10⁻²⁰ m2. scCO2 reacts with the (vapor) pore water and forms carbonic acid (H2CO3). Subsequently, carbonate minerals (calcite – CaCO3 or dolomite – CaMg(CO3)2) react with the carbonic acid, resulting in dissolution of carbonate minerals, particularly calcite grains. These reactions are shown in Equations (4) and (5):
Furthermore, dissolution of carbonate minerals that reacted with carbonic acid can explain the significant increase in permeability of the sample. Permeability drops to a value of 1.23 × 10⁻²⁰ m2 at σ = 30 MPa and recovers by ~92% after unloading to 10 MPa.
Permeabilities measured with argon after removal of scCO2 (i.e., in C3 cycle) exhibit values of 1.23 × 10⁻²⁰ and 0.712 × 10⁻²⁰ m2 at effective stresses of 10 and 30 MPa, respectively, exhibiting 56% increase in pressure dependency compared to that of prior to scCO2 interaction (i.e., C1 cycle). The greater pressure dependency in the C3 cycle (compared to C1) is an indication that the rock matrix surrounding some of the pore throats, which are responsible for fluid flow, is getting more compliant due to interaction with scCO2. However, it should not be misinterpreted as mechanical softening of the whole shale matrix, as the fluid flow occurs in the most conductive flow channels, and hence, most of the matrix microstructure is unlikely to be altered by scCO2. In addition, the permeability recovery after unloading is ~99%, which is in close agreement with permeability recovery of C1 cycle (i.e., prior to interaction with scCO2).
We do not expect to observe significant permeability changes between C2 and C3 cycles, however, the slight decrease of permeability in C3 cycle compared to C2 (by 17%) could be attributed to the mechanical deformation in pore throats caused by (i) vacuuming the sample for 24 h, (ii) equilibrating the sample with argon for 24 h, and (iii) loading/unloading cycles between C2 and C3.
3.1.2. Sample 4-2H; High-Permeability, Carbonate-Poor
Figure 5 shows the permeability values of sample 4-2H, with an initial permeability of 0.943 × 10⁻¹⁸ m2, which is more than three orders of magnitude higher than that of sample 2-1H. Sample 4-2H is mainly composed of quartz as opposed to calcite. As discussed earlier in Section 3.1.1, carbonate minerals show both chemical and mechanical diagenesis, however, only mechanical compaction (diagenesis) is expected for quartz minerals. Subsequently, the void space between quartz grains in sample 4-2H is unlikely to get filled. In addition, the presence of micro-cracks could be another possible explanation for the higher permeability of this sample.
In C1 cycle, by increasing effective stress to 30 MPa followed by unloading to 10 MPa, we observe that the pressure dependency and recovery percentage of permeability are 19% and 93%, respectively. After three days of interaction with scCO2, despite its moderate-to-high initial permeability and low carbonate content, the permeability of the sample increases more than 400% to a value of 4.63 × 10⁻¹⁸ m2 in C2 cycle. Dissolution of some of the calcite-filled micro-cracks, which were responsible for fluid flow, can explain the significant increase in permeability, when transitioning from C1 to C2 cycle. Permeability recovery after unloading is ~89%, which is lower than C1 cycle, indicating that dissolution of micro-cracks has some irreversible effects on permeability, caused by altering the height, shape, and distribution of asperities in micro-cracks, which, in turn, affects permeability. When the BSE images of unreacted plug (see Figure 6a,b) are compared to those of reacted plug (see Figure 6c,d), it can be observed that the rock matrix exhibits some additional etching and dissolution pits, as a result of interaction with scCO2.
Argon permeability after interaction with scCO2 (i.e., C3 cycle) at σ = 30 MPa is more than three times greater than that of C1 cycle. This observation suggests that the permeability increase, caused by scCO2 interaction with calcite-filled micro-cracks, is irrecoverable. After removal of scCO2, the permeability reduces by ~33% (compared to C2 cycle) in the first measurement of C3 cycle. There are a few possible explanations for the reduction of permeability. Firstly, the sample is vacuumed for 24 h at σ = 20 MPa, followed by 24-h argon equilibrium at σ = 10 MPa, which can together cause mechanical compaction over a period of 48 h. However, the slight increase of permeability in C4 and C5 cycles, in which scCO2 is again used as the pore fluid, undermines the significant role of mechanical compaction as the main factor in permeability reduction transitioning from C2 to C3 cycle. Secondly, and more importantly, we were able to conduct steady-state permeability measurements on sample 4-2H, given its μD permeability range. For the sake of consistency between permeability measurements with different fluids, we used a pre-scribed constant volumetric flow rate of 5 × 10⁻¹⁰ m3/s during the permeability cycles, for both argon and scCO2. At a pore pressure of 10 MPa and a temperature of 40 °C, the viscosity of argon and scCO2 are 2.62 × 10⁻⁵ and 4.78 × 10⁻⁵ Pa.s, respectively. If flow is truly laminar and the Darcy’s law is obeyed, one would expect that the pore pressure difference would proportionately change to compensate the viscosity difference between different fluids, and hence, the fluid type should not cause any difference in permeability. However, we believe that the assumption of complete laminar flow might be violated, and flow regime might fall in slip/transition flow regimes. Therefore, we see a discrepancy between scCO2 and the subsequent argon permeability. These explanations may not be misunderstood as if the argon and scCO2 permeabilities should always be the same. When assessing the processes/phenomena involved in permeability changes caused by scCO2, one should rather consider a number of conditions, such as initial permeability, mineralogical composition, and permeability changes in all cycles.
As briefly explained earlier, two additional scCO2 permeability cycles (namely, C4 and C5) were performed, with each having three days of interaction with the sample, followed by one last cycle of argon permeability (C6 cycle). We can observe slight permeability reduction in C4 and C5 cycles compared to C2, which can be attributed to mechanical compaction over the course of the experiment and/or adsorption of scCO2 into clays and kerogen. The latter will be discussed in great depth in Section 3.2. The relatively constant permeability values in C4 and C5 cycles suggest that further dissolution of calcite-filled micro-cracks in these cycles is negligible. Increasing effective stress from 10 to 30 MPa leads to a permeability reduction of 12.5 ± 1% for the C4 and C5 cycles as opposed to 26% in C2 cycle. The (i) significant change in pressure dependency of permeability when C2 and C4 cycles are compared, and (ii) the relatively unchanged pressure dependency of permeability transitioning from C4 to C5 cycle could be additional indications that, during two additional three-day periods of scCO2 interaction with the sample (i.e., cycles C4 and C5), further dissolution of calcite-filled micro-cracks is negligible. Pressure dependency of argon permeabilities in C3 and C6 cycles is relatively similar, both within 10 ± 1%. This suggests that the two additional three-day periods of scCO2 interaction with the sample does not change the stiffness of the rock matrix, adjacent to the flow channels, which is another confirming observation that no significant further dissolution occurs in C4 and C5 cycles.
3.2. Adsorption into Clays and Organic Matter
Samples 3-2H and 4-4H showed adsorption of scCO2 into clay minerals and organic matter, resulting in a reversible reduction of permeability with a recovery percentage of more than 94% in all the cases, as shown in Figure 7 and Figure 8. Note that the clay type in sample 3-2H is muscovite and its “clay+TOC” content is 28%, while sample 4-4H contains 44% and its clay type is illite/smectite. Despite the difference in mineralogy of clays (both type and amount), the scCO2 permeability is roughly half of that of argon for both samples. For sample 3-2H, extended cycles of permeability measurements were made, similar to sample 4-2H (see Section 3.1.2). We observed that the longer interaction time with scCO2 in the extended cycles led to a mild increase in permeability, even when the carbonate content is insignificant. When comparing the results for these two samples, we should bear in mind that their permeabilities differ by one order of magnitude, which prevents us from directly comparing the two samples.
3.2.1. Sample 4-4H; High “Clay + TOC”; Regular Cycles
As shown in Figure 7, sample 4-4H has an initial permeability of 1.76 × 10⁻¹⁹ m2 at σ = 10 MPa, which is almost one order of magnitude lower than sample 4-2H. Sample 4-4H has more “clay+TOC” content (44% vs. 28%) and less quartz (52% vs. 62%) compared to 4-2H, with the relatively same amount of carbonates, which together could explain the lower permeability of this sample. In fact, the lower amount of sphere-shaped quartz minerals results in less intergranular void space, while, the higher amount of “clay+TOC” contributes to the filling of the already-less intergranular void space. Increasing effective stress to 30 MPa results in a reduction of permeability by 16% and recovers back to 1.65 × 10⁻¹⁹ m2 upon unloading to σ = 10 MPa, exhibiting a permeability recovery of 94%. The mid-range initial permeability, high degree of permeability recovery, and mild pressure dependency of permeability could all suggest that micro-cracks are not primary paths of fluid flow for sample 4-4H.
Interaction of the sample with scCO2 for three days causes a permeability reduction by ~48%. We believe that this substantial reduction in permeability is attributed to the adsorption of scCO2 into clay minerals and kerogen, which constitute a significant portion of the mineralogical content for this sample (~44%). Upon increasing effective stress to 30 MPa, the permeability reduces by 11% to a value of 0.76 × 10⁻¹⁹ m2, while 95% permeability recovery is observed after unloading back to σ = 10 MPa. When argon is re-introduced into the sample (i.e., cycle C3), the permeability increases by ~85%, to a permeability value of 1.51 × 10⁻¹⁹ m2, which is only 8% less than that of argon permeability in C1 cycle. This significant permeability recovery suggests that adsorption of scCO2 into clay minerals and organic matter causes a reversible permeability reduction. Whereas, the slight decrease in C3 cycle compared to C1 could be attributed to the permanent closure of some of the flow paths resulted from application of repeated cycles of loading for a duration of ~200 h. When the sample is loaded to σ = 30 MPa, the permeability reduces by 7% and recovers by more than 99% after unloading back to 10 MPa. The lower degree of pressure dependence in successive permeability cycles could be associated with those pores that get permanently closed and no longer are affected by changes in effective stress.
3.2.2. Sample 3-2H; Extended Cycles
Figure 8 illustrates the six permeability measurement cycles for sample 3-2H. Similar to sample 4-2H, two additional cycles of scCO2 permeability followed by one cycle of argon permeability were conducted on this sample. Its permeability values at effective stresses of 10 and 30 MPa are 4.06 × 10⁻¹⁸ and 2.08 × 10⁻¹⁸ m2, respectively, exhibiting 49% reduction in permeability as effective stress is increased by 20 MPa. Upon unloading to σ = 10 MPa, its permeability partially recovers by 67% to a value of 2.72 × 10⁻¹⁸ m2. The significant permanent reduction of permeability in C1 cycle is attributed to irreversible mechanical deformation, possibly by closure of some micro-cracks. In C2 cycle, after three days of scCO2 interaction, its permeability further reduces by 44% to a value of 1.52 × 10⁻¹⁸ m2, which is attributed to scCO2 adsorption into clays and organic matter as well as continued mechanical deformation under loading. When the effective stress is increased to 30 MPa, the permeability of the sample is further reduced to 1.02 × 10⁻¹⁸ m2 and recovers back by 93% upon unloading.
When argon is reintroduced into the sample (i.e., C3 cycle), its permeability increases to 2.93 × 10⁻¹⁸ m2, which is 7% higher than argon permeability before introducing scCO2 into the sample (i.e., C1 cycle). The full recovery of permeability suggests that adsorption into clays and organic matter is a reversible process, as also observed for sample 4-4H. Between last measurement of C1 cycle and the first measurement of C3 cycle (both with argon gas at σ = 10 MPa), the sample has experienced repeated cycles of loading/unloading for a period of ~200 h. Consequently, we expected that its permeability in C3 cycle is slightly lower than C1 cycle. Nevertheless, the slight increase in permeability implies that dissolution of carbonate minerals occurs, despite the insignificant amount of carbonates in this sample. Therefore, the 7% increase of permeability is the aggregate effects of (i) increase in permeability due to dissolution and (ii) decrease in permeability due to permanent closure of some flow paths. Increasing effective stress to 30 MPa results in 28% reduction in permeability, while it recovers back by 97% upon unloading to σ = 10 MPa. The lower degree of pressure dependency in C3 cycle (28%) compared to C1 (49%) should not be misinterpreted as effects of scCO2. If we rather take the unloading path in C1 cycle, the sample shows a pressure dependency of 31%, which suggests that some permanent changes in the microstructure of the sample has led to substantial initial pressure dependency. Therefore, interaction with scCO2 does not have a significant effect on pressure dependency.
After another three days of interaction with scCO2, the permeability in C4 cycle is reduced to a value of 1.85 × 10⁻¹⁸ m2, indicating 35% decrease compared to its preceding argon permeability (i.e., C3 cycle). Whereas, the permeability reduction is 42% when transitioning from C1 to C2 cycle (which is also a transition from an argon to scCO2 cycle). Both occur due to adsorption of scCO2 into clays and organic matter, however, two phenomena might have caused the difference in the behavior. Firstly, as the experiment proceeds, the sample experiences fewer permanent changes in permeability resulted from mechanical deformation. Secondly, the sample might experience additional dissolution of carbonates when it is exposed to scCO2 for longer periods of time, which attempts to increase permeability, and hence, moderating the effects of adsorption. The permeability in C4 cycle reduces by 34% when effective stress is increased to 30 MPa and recovers back to 1.78 × 10⁻¹⁸ m2, exhibiting only 4% irrecoverable permeability upon unloading. It is important to note that the recovery percentage significantly improves as the experiment proceeds, from 67% in C1 cycle to 97 ± 1% in C3 cycles and afterwards. We observed ~2% increase in permeability in C5 cycle, which suggests that no additional significant adsorption occurs in the sample. Rather, the slight increase in permeability indicates that a minor carbonate dissolution has occurred, despite the ongoing mechanical deformation caused by loading/unloading cycles for another 100 h. Increasing effective stress to 30 MPa and unloading it back to 10 MPa results in a pressure dependency and recovery percentage of 32% and 98%, respectively.
Last argon (C6) cycle exhibits a permeability of 2.83 × 10⁻¹⁸ at σ = 10 MPa, which is only 0.1% less than that of C3 cycle (i.e., argon cycle before extended scCO2 cycles C4 and C5). As explained for interpretation of C4 and C5 cycles, there are some degree of modest additional mineral dissolution during extended cycles of scCO2 interaction (i.e., cycles C4 and C5). Note that there are a few cycles of loading/unloading from the last measurement of C3 cycle until the first measurement of C6 cycle, which are indeed accompanied by permanent reduction in permeability caused by mechanical compaction. Permeability values are almost the same in C3 and C6 cycles, while the mineral dissolution and mechanical effects of loading/unloading are actually competing and neutralizing the effects of each other. Therefore, the unchanged argon permeability before and after extended cycles of scCO2 should not be simply misunderstood as no other processes rather than adsorption are involved. In fact, dissolution and mechanical compaction are the other two phenomena that are largely irreversible. Permeability decreases to a value of 1.99 × 10⁻¹⁸ m2 at σ = 30 MPa, indicating a pressure dependency 7% higher than that of C3 cycle. This could be another indication that some minor carbonate dissolution has occurred, which in turn, has weakened the matrix. The sample shows a permeability recovery of 97% upon unloading to σ = 10 MPa.
It is very interesting to note that after all the cycles of loading/unloading, introducing/removing different pore fluids, and interaction with scCO2, the permeability of the sample has been changed from 2.72 × 10⁻¹⁸ m2 in C1 cycle to 2.74 × 10⁻¹⁸ m2 in C6 cycle. Less than 1% increase of permeability might mistakenly lead to the conclusion that no significant process is occurring. However, the step-by-step inspection of permeability changes throughout the experiment suggests that adsorption into clays and organic matter, carbonate dissolution, and mechanical closure of flow paths are three important processes that neutralize each other, leading to almost no permeability changes.
3.3. Competition between Dissolution and Adsorption
We attempted to better understand the behavior of unconventional formations when they interact with scCO2, while both dissolution and adsorption are contributing to permeability changes in the samples. In this regard, we conducted permeability cycles on two Eagle Ford samples with very similar mineralogical contents. Their permeability response was not easy to explain, as two processes of dissolution and adsorption were convoluted/combined with each other. Subsequently, we conducted a longer-term permeability experiment on the Utica sample to better separate the effects of dissolution and adsorption on one single sample. The results of these experiments are presented in Section 3.3.1 and Section 3.3.2.
3.3.1. Samples 1-63H and 3-110H; Shorter-Term Experiment; Combined Effects
The permeability values of C1, C2, and C3 cycles for samples 1-63H and 3-110H are shown in Figure 9a,b, respectively. When inspecting Table 1, we observe two important mineralogical characteristics of these samples. Firstly, the mineralogical content of them is very similar, as they only differ by 1% in their carbonate and “clay+TOC” content while their QFP (quartz + feldspars + pyrite minerals) content is the same. In Section 3.1 and Section 3.2, we identified mineralogy as one of the important factors (but not the only factor) in determining the response of unconventional formations to interaction with supercritical carbon dioxide. In this section, we instead study the effects of scCO2 on two samples with very similar mineralogy, and hence, attribute the observed difference in their response to other factors such as micro-structure, preferential flow path, pore size distribution, to name but a few. Secondly, while the samples contain 56–57% carbonate minerals, they have a high amount of organic matter around 7%, which both fall in the upper range of unconventional formations. We expect to observe mineral dissolution when the carbonate content is high (as explained by details in Section 3.1), while enhanced amount of “clay+TOC” increases the likelihood of adsorption of scCO2 (as explained by details in Section 3.2). Consequently, we would be able to draw some conclusions about the dominance of dissolution or adsorption, when the amount of both carbonates and “clays+TOC” are considerable.
The initial permeability values (at σ = 10 MPa) of samples 1-63H and 3-110H are 12.87 × 10⁻²¹ and 5.57 × 10⁻²¹ m2, respectively, while they decrease by 50% and 45% upon increasing effective stress to 30 MPa. As we will discuss in Section 4.1, the mineral composition is one of the factors that significantly affects the initial permeability of shale rocks. However, the permeability of sample 1-63H is almost twice that of 3-110H, despite their similar mineralogical content. This suggests that the flow necks in sample 1-63H might be larger than sample 3-110H, which is also confirmed by the higher pressure-dependency of the former. Upon unloading to σ = 10 MPa, both samples indicate a recovery percentage of ~67%. The nano-Darcy range of initial permeability suggests that micro-cracks do not play an important role in permeability of these samples. Accordingly, the relatively substantial permeability loss can be attributed to the inelastic deformation of the flow necks in the vicinity of clays and organic matter, which are the most compliant constituents of the rock matrix.
After three days of interaction with scCO2, the permeability of sample 1-63H shows a negligible increase from 8.52 × 10⁻²¹ to 8.68 × 10⁻²¹ m2, while the permeability of sample 3-110H substantially decreases from 3.74 × 10⁻²¹ to 1.78 × 10⁻²¹ m2. In sample 1-63H, carbonate dissolution is counterbalancing the combined effects of scCO2 adsorption into “clay+TOC” and mechanical compaction. As a result, this sample experiences some negligible degree of permeability increase. However, it should be again kept in mind to not misinterpret this observation as if there are no active processes affecting permeability. In fact, dissolution occurs at a relatively high rate so that the effects of adsorption, given its relatively high “clay+TOC” content, and mechanical compaction are not obvious in the scCO2 permeability values (i.e., C2 cycle). On the other hand, interaction with scCO2 results in more than 50% reduction in permeability for sample 3-110H, which suggests that mechanical deformation and adsorption are prevailing over dissolution. The disparity in behavior of these two samples, despite their similar mineralogical content, signifies the importance of the impact of microstructure-induced differences between the dominant flow paths of the two samples. Therefore, the extent of permeability changes due to different processes such as dissolution, adsorption, and mechanical compaction could be markedly different.
Increasing effective stress to 30 MPa results in 39% and 6% reduction of permeability in cycle C2 for samples 1-63H and 3-110H, respectively. The significantly higher pressure-dependency of the sample 1-63H could be associated with its enhanced dissolution, and therefore, weakening of the matrix. However, we cannot assertively attribute this substantial discrepancy only to the effects of dissolution, as other factors such as preferential flow paths, measurement error, and microstructural differences could play a role. Upon unloading back to σ = 10 MPa, permeability of samples recover back to 7.89 × 10⁻²¹ and 1.70 × 10⁻²¹ m2 for samples 1-63H and 3-110H, respectively, indicating permeability recovery percentages of 91% and 95%. The slightly higher permeability irreversibility for sample 1-63H could be attributed to the permanent closure of flow paths in the vicinity of regions (i.e., flow necks) with carbonate dissolution.
When argon is re-introduced (i.e., C3 cycle), the permeability values of samples 1-63H and 3-110H increase by 16% and 109%, respectively. This distinct difference in permeability increase between the two samples can be only attributed to the different degrees of scCO2 adsorption into clays and kerogen. As previously discussed, sample 1-63H experiences less pronounced adsorption compared to 3-110H, and therefore, upon removal of scCO2 the former’s permeability increases by a lesser amount. Samples 1-63H and 3-110H exhibit 21% and 27% decrease in permeability, respectively, when effective stress is increased to 30 MPa. Both samples show less pressure-dependency compared to C1 cycle, which can be attributed to the effects of mechanical loading/unloading, and in turn, permanent closure of some flow paths. In addition, by comparing the permeability values at σ = 30 MPa in C1 and C3 cycles, we see 14% increase and 16% decrease for samples 1-63H and 3-110H, respectively. This is another indication that dissolution is dominating over the combined effects of adsorption and mechanical deformation in sample 1-63H, while, dissolution is overshadowed by the combined effects of adsorption and mechanical compaction in sample 3-110H.
3.3.2. Sample 1-42-3H; Longer-Term Experiment
Figure 10 shows the permeability values for sample 1-42-3H. Its permeability decreases from 6.52 × 10⁻¹⁸ to 1.97 × 10⁻¹⁸ m2 as effective stress increases from 10 to 30 MPa, exhibiting ~70% reduction in permeability, while permeability recovers by 55% to a value of 2.95 × 10⁻¹⁸ m2 upon unloading to σ = 10 MPa. The highly pressure-dependent and irreversible permeability could be attributed to (i) presence of micro-cracks (inferred from its high initial permeability), and (ii) high amount of “clay+TOC”, which are both the most compliant elements of the rock matrix. After three days of interaction with scCO2, the permeability of the sample decreases to 1.20 × 10⁻¹⁸ m2 in C2 cycle, exhibiting 59% reduction which can be attributed to adsorption of scCO2 into clays and kerogen. Note that this sample has 15% carbonates, and hence, some dissolution might have occurred. However, mechanical deformation and adsorption are the more dominant processes in this sample. Increasing effective stress to 30 MPa results in 51% reduction in permeability. The highly pressure-dependent permeability values in C2 cycle, which was also the case for C1 cycle, are caused by the high amount of more compliant constituents (i.e., clays and kerogen). Its permeability recovers by 72% upon unloading to σ = 10 MPa. The higher recovery percentage in C2 cycle compared to C1 can be attributed to less significant deformation of compliant elements of matrix in successive cycles.
When scCO2 was removed and argon re-introduced (i.e., C3 cycle), the permeability increased from 0.87 × 10⁻¹⁸ to 1.82 × 10⁻¹⁸ m2, associated with reversibility of adsorption. However, the permeability of sample is 38% lower than last measurement of C1 cycle. This suggests that mechanical compaction plays an important role in the response of this sample. Increasing effective stress to 30 MPa followed by unloading to 10 MPa resulted in a pressure-dependency rate and recovery percentage of 51% and 90%, respectively. The high pressure-dependency of the sample (70% in C1 cycle and 51% in C3 cycle), even after three cycles of loading/unloading, is likely linked to the very high amount of “clay+TOC”.
After completion of C3 cycle, we again introduced scCO2 into the sample and let they interact for a period of 21 days, while maintaining the effective stress at 10 MPa. This prolonged period of interaction was aimed at separating the effects of adsorption and dissolution, as this sample has moderate carbonate content as well as very high “clay+TOC” content. Sample’s scCO2 permeability decreases from 1.64 × 10⁻¹⁸ to 0.71 × 10⁻¹⁸ m2, which is again attributed to adsorption. In addition, we expect some degree of carbonate dissolution due to 21 days of interaction with scCO2, however, it is overshadowed by effects of adsorption. On the other hand, we notice that permeability measured at this stage is 18% lower than scCO2 permeability in C2 cycle (at the same effective stress of 10 MPa). One might tend to consider this slight decrease as the exclusive effect of repeated cycles of loading/unloading, however, it neglects the enhanced amount of dissolution and adsorption due to 21-day scCO2 interaction with the sample. Therefore, this slight reduction in permeability (compared to C2 cycle) is associated with the combined effects of (i) decrease in permeability by mechanical deformation, (ii) decrease in permeability by enhanced adsorption, and (iii) increase in permeability by enhanced dissolution. Finally, we observe that permeability is increased to 2.44 × 10⁻¹⁸ m2 after re-introducing argon, which is not only higher than its preceding scCO2 permeability, but also 49% higher than argon permeability in C3 cycle. Despite the adsorption of scCO2 into clays and organic matter and mechanical deformation for more than 550 h, the higher argon permeability compared to C3 cycle indicates that a significant amount of dissolution occurred over prolonged periods of interaction with scCO2.
3.4. Sample 4-6H; Matrix Weakening
Sample 4-6H has an initial permeability of 13.3 × 10⁻¹⁸ m2 (~13 μD), which is the highest among all the samples, as shown in Figure 11. Similar to the other Eagle Ford samples (namely, 1-63H and 3-110H), it contains high carbonate and kerogen, and moderate amount of clays. This can potentially lead to very low permeability due to chemical diagenesis of the carbonate minerals and placement of organic matter and clays in most of the void space, as observed in samples 1-63H and 3-110H. However, the high initial permeability indicates that flow through micro-cracks is the dominant transport mechanism for this sample. Upon increasing effective stress to 30 MPa, the permeability drops by 63% to a value of 4.87 × 10⁻¹⁸ m2 and recovers back to 7.02 × 10⁻¹⁸ m2 after unloading to 10 MPa, indicating a recovery percentage of 53%. The higher degree of pressure dependency can be attributed to the more compliant micro-cracks, as opposed to less compliant matrix for the other two Eagle Ford samples. In addition, the lower permeability recovery percentage indicates that the flow paths, controlled by geometry of micro-cracks in sample 4-6H, are experiencing a significant degree of irreversible mechanical compaction.
After three days of interaction with scCO2, permeability in C2 cycle dropped to 6.51 × 10⁻¹⁸ m2, exhibiting 7% decrease compared to the last measurement of argon (C1) cycle. This can, in part, be attributed to the higher effective stress of 20 MPa, when the sample is vacuumed for 24 h. Increasing effective stress to 30 MPa results in a substantial permeability decrease by 57% to a value of 2.77 × 10⁻¹⁸ m2, with a permeability recovery percentage of 59% upon unloading to σ = 10 MPa. Highly pressure-dependent permeability and significant permeability irreversibility upon unloading, alongside with negligible permeability change after three days of scCO2 interaction indicate that the dominant mechanism in permeability reduction is mechanical compaction rather than mineral dissolution and/or adsorption, even in the presence of 53% carbonate minerals, 17% clays, and 7% organic matter. This can be attributed to the very low residence time of fluid in the micro-cracks, due to relatively high initial permeability, as opposed to what we observed in the other two Eagle Ford samples, which had similar mineralogical contents.
Upon re-introducing and equilibrium of argon gas (i.e., C3 cycle), the permeability drops only by 2% to a value of 3.79 × 10⁻¹⁸ m2. As we observed for samples 2-1H and 3-2H, dissolution is accompanied by increase in post-CO2 permeability (i.e., C3 cycle) compared to the initial values (i.e., C1 cycle). On the other hand, adsorption of scCO2 into clays and organic matter is a phenomenon that results in a reversible decrease in permeability, as observed for samples 4-2H and 4-4H. None of these two mechanisms are observed in this sample, and hence, the very slight decrease in permeability transitioning from C2 cycle (scCO2) to C3 (argon) is another reason that the dominant mechanism for this sample is mechanical compaction. Increasing effective stress to 30 MPa, further decreases permeability to 2.29 × 10⁻¹⁸ m2, exhibiting a 40% reduction caused by mechanical compaction, while it recovers back by 91%. The last permeability cycle (C3) has lower degree of pressure-dependency and irreversibility of permeability compared to C1 and C2 cycles, which can be explained by the mechanical compaction of micro-cracks with repeated cycles of loading/unloading.
4. Discussions
In this section, we provide some further explanations/analyses of the presented results in Section 3. Section 4.1 discusses the influence of carbonate content on initial (unreacted) permeability, followed by comparison of argon and scCO2 permeabilities in Section 4.2. The opposing effects of dissolution and adsorption are discussed in Section 4.3, succeeded with an analysis on pressure dependency of permeability before and after exposure to scCO2 in Section 4.4.
4.1. Control of Initial (Unreacted) Argon Permeability by Carbonate Content
Figure 12 is a graph showing the carbonate content against initial permeability measurement, for samples in this study as well as three papers from our research group. When only considering the measurement in this study, if we exclude the two outliers (i.e., samples 4-6H and 1-42-3H), which were most likely dominated by flow in micro-cracks, we can easily identify that there is a negative correlation between carbonate content and initial permeability of these samples. When all the studies are considered together, there still is negative correlation between carbonate content and initial permeability. Almost five orders of magnitude variation in permeability, from more than 10−17 m2 to less than 10−21 m2, can be observed when the carbonate content changes from less than 1% to around 80%. This observation can be, in part, attributed to the fact that carbonate minerals experience both chemical and mechanical diagenesis. Consequently, carbonate minerals tend to occupy the pore space due to chemical diagenesis, and hence, decrease the available flow paths. The deviation of the trend in carbonate content—initial permeability graph for samples 4-6H and 1-42-3H, for this study, and samples from the other three studies can be attributed to the dominance of micro-cracks in their transport characteristics. Therefore, carbonate content is a very important factor affecting initial permeability of shale rocks.
4.2. Argon vs. scCO2 Permeability
Figure 13 shows the mean free path of argon and CO2 at different pressures. During permeability measurement cycles, the downstream pore pressure was always set at 10 MPa, which corresponds to mean free path (λ) values of 0.84 and 0.89 nm for argon and CO2, respectively. Higher λ values are associated with fewer access to some smaller pores. Hence, the intrinsic scCO2 permeability values are slightly lower than their argon counterparts. Less than 10% difference in λ values is, however, only a minor factor in the difference between argon and scCO2 permeabilities. Please note that when the sample has μD-range permeabilities the discussion here might not be as relevant as nD-range permeabilities, due to more significant dominance of Darcy’s flow.
On the other hand, comparing pressure dependency of argon and scCO2 permeabilities could be sometimes misleading. In modified pulse decay method, which was implemented for very low permeability samples (below 10−19 m2, namely samples 2-1H, 4-4H, 1-63H, and 3-110H), the pulse magnitude (i.e., the difference between upstream and downstream pore pressures) in some cases is more than 2 MPa. This relatively large pulse pressure, in turn, can cause a different interpretation of viscosity (μ) and gas compressibility (β) values for argon and scCO2. For example, assuming a downstream pore pressure of 10 MPa, the term μ×β (viscosity multiplied by gas compressibility used in Equation (3) for permeability estimation) is equal to 2.73 × 10⁻¹² and 3.37 × 10⁻¹² Pa.s/Pa for argon and scCO2, respectively. While an upstream pore pressure of 12 MPa results in a value of μ×β = 2.33 × 10⁻¹² and 2.00 × 10⁻¹² Pa.s/Pa for argon and scCO2, respectively. Subsequently, the question arises as to which value should be used in Equation (3) for the term μ×β. Therefore, the comparison of argon and scCO2 permeabilities is not a reliable index to compare the effects of scCO2 on permeability. Instead, we compare the argon permeabilities before and after introduction of scCO2 to assess its influence on fluid flow. This is a more reliable approach since, on a particular sample, the same pressure pulse was used for argon permeability measurements before and after interaction with scCO2 (namely, cycles C1 and C3).
4.3. Competing Effects of Dissolution and Adsorption
As we previously discussed, Table 2, provides a summary of the results for all the 8 samples including the measurement technique, initial permeability, scCO2-induced changes in permeability, net increase/decrease of permeability, and contributing processes to the response of each sample. Moreover, Figure 14 illustrates the dominant process for permeability changes (caused by interaction with scCO2) for each sample on a ternary diagram. As evident in Figure 14, dissolution and adsorption are two major mechanisms associated with interaction of scCO2 with shale rocks, which typically cause increase and decrease in permeability, respectively. The former is a result of carbonate interaction with scCO2 in the presence of pore water, while, the latter originates due to the tendency of clays and organic matter to take up the sorbing molecules of carbon dioxide. It would be oversimplification to deduce that mineralogy is the only factor in response of shale rocks to injection of scCO2. Pore size distribution and micro-structure are other important factors that affect their response. In Section 3, we explained in details multiple cases where mineralogical content cannot explain the observed behavior of the samples.
As summarized in Table 2, the permeability response of certain samples can be very well explained by mineralogy. For example, sample 2-1H shows a significant increase in its permeability after interaction with scCO2, which is attributed to its very high carbonate content and negligible amount of clays and TOC. Moreover, sample 4-4H with significant “clay + TOC” content shows decrease in its scCO2 permeability due to adsorption. On the contrary, explanation of the permeability response of some samples is not straightforward. For instance, in sample 4-2H the “clay + TOC” content is significantly higher compared to carbonates, and hence, one might expect a decrease in permeability. However, it experiences a significant increase of permeability by a factor of 3–4. By inspecting BSE images, we found that dissolution of (i) calcite minerals in the rock matrix, and (ii) calcite-filled micro-cracks played an important role in the increase of permeability.
In addition, when we compare samples 1-63H and 3-110H which have very similar mineralogical content and initial permeabilities, after interaction with scCO2, both samples exhibit ~15% change in their permeabilities, although in opposing directions. Note that these samples both have considerable amount of “clay+TOC” and carbonates, and therefore, we expect both dissolution and adsorption to contribute to their permeability response. Dissolution is slightly dominating over adsorption for sample 1-63H leading to 14% increase in its permeability, while the dominant process is adsorption for sample 3-110H, which resulted in 16% decrease in permeability. The difference in response of these two samples highlights the influence of micro-structural and pore network variations.
Prolonged permeability cycles were conducted on three samples, namely samples 3-2H, 4-2H, and 1-42-3H. Examining these prolonged cycles reveal that when the sample interacts with scCO2 for a longer period of time, carbonate dissolution is enhanced, while adsorption into clays and organic matter occurs to the same degree. Therefore, we should be careful in anticipating the long-term permeability response of unconventional reservoirs in the presence of scCO2. Time-dependent dissolution and time-invariant adsorption add further complication to the already-complex issue of fluid transport in shale rocks.
4.4. Micro-Structural Changes
In this section we provide BSE images and the associated EDS maps, in order to assist us for better understanding of the interactions between scCO2 and rock matrix, particularly with regard to minerals that contain calcium. These minerals include calcite (CaCO3), dolomite (CaMg(CO3)2), and calcium sulfide (CaS), at both grain and micro-crack scales. We observed that internal micro-structure of calcite grains is substantially affected by the interaction with scCO2, while the dolomite grains are typically unaffected. These alterations include creation of dissolution pits, surface etching, and creation of tiny microcracks. On the other hand, calcium sulfide was found to be one of the minerals that precipitates along tiny flow channels, resulting from interaction of scCO2 with pyrite and calcite.
Figure 15a shows the BSE image of a region in one of the post-test samples. When we magnify the region that is shown by red rectangle, it can be seen that some of the minerals have experienced etching, detachment of grains from each other, and dissolution as evident in Figure 15b. The calcium EDS maps for these regions are provided in Figure 15c,d. The BSE images indicate regions with alteration of both pyrite and calcite, due to interaction with scCO2. R1 is a region which is predominantly composed of calcite. It can be easily observed that calcite grains have been affected by interaction with scCO2. The majority of the calcite body has experienced etching and grain detachment, with some degree of dissolution at the very right end of the selected region (i.e., SR1 sub-region). We can observe a dolomite grain in R2 region, on the very left side of the selected region in Figure 15b, which has experienced insignificant alteration in its internal micro-structure, possibly due to lower kinetic reaction rates of dolomite compared to calcite. We also believe that the boundary between calcite and pyrite has been dissolved by scCO2, as we can see some loose grains in that region.
Figure 16a shows the BSE image of a region that is relatively rich in carbonates, both calcite and dolomite. We have selected a sub-region, as shown in Figure 16b, in which five regions are shown. As it can be inferred by considering the carbon and calcium EDS maps associated with Figure 16a, as shown in Figure 16c,d, these five regions are composed of carbonate minerals. It can be easily inferred that these regions have different morphological characteristics. R1 is a region that is composed of dolomite, which shows no significant changes in its internal micro-structure, as also observed in Figure 15. R2 and R3 regions are primarily composed of calcite. They both contain some loose grains on their surface, which could have been resulted from the precipitation of already-dissolved calcite minerals, from somewhere else in the rock matrix. R4 region is associated with etching and minor cracking in calcite mineral, as was the case for the region associated with Figure 15. R5 region, which has a smaller calcite grain compared to other regions, shows some dissolution pits. When we further inspect the EDS maps of calcium and carbon, which are provided in Figure 16c,d, it can be observed that there are multiple regions (that contain carbonate minerals) with smaller carbon content compared to calcite content. This is a clear sign of dissolution in these carbonate regions. R6, R7, and R8 are some examples of such regions.
Figure 17a,b show the BSE images of two different regions in one of the samples, while the EDS maps for them are shown in Figure 17c,d. When we compare the EDS maps of these regions with the BSE images, we could identify different regions with calcite or dolomite. R1 and R2 regions, as illustrated in Figure 17b, are associated with dolomite. They both show insignificant changes in the internal microstructure of the dolomite grains, similar to other regions in Figure 15 and Figure 16. R3 region is, however, a calcite grain, which shows some dissolution pits and tiny microcrack creation, due to interaction with scCO2, as also observed in some of the calcite grains in Figure 15 and Figure 16. So far, we have seen that calcite grains are most likely affected by scCO2 interaction with them, while dolomite grains are not. Although, we observe in Figure 17b that not all the calcite grains are affected by scCO2. R4 and R5 regions, that are shown in Figure 17b, are dolomite and calcite grains. Both of these grains are relatively unaltered by interaction with scCO2. R6, R7, and R8 regions are all calcite grains with different patterns of alteration due to interaction with scCO2. By comparing these three regions, it can be inferred that the size of the calcite grain is also an important factor on how its microstructure might be altered. R9 is a big calcite grain which has been affected by scCO2. The interesting observation we made is that the boundary of such a big grain is affected to a much greater extent than its middle parts. As it can be seen in Figure 17b, the SR1 and SR2 sub-regions show much more alteration compared to the rest of the calcite grain. This could be attributed to the fact that the boundary of such a big grain is more accessible to scCO2 than its middle regions.
Figure 18a,b show the BSE images of a region in one of the post-test samples at two magnifications of 250× and 1000×, respectively. In addition, we have shown the EDS maps for calcium (in Figure 18c,d) and sulfur (in Figure 18e,f). The most interesting feature, at both 250× and 1000× magnifications, is the precipitation of calcium sulfide (CaS) in a very narrow flow channel, which falls inside the red parallelograms, as shown in Figure 18a–f. This phenomenon observed by the presence of both calcium and sulfur in a tiny (but long) flow channel, while there is no carbon present there.
4.5. Pressure-Dependency
Table 3, presents the values of relative change in permeability for cycles conducted with argon in unloading path (i.e., transitioning from effective stress of 30 to 10 MPa), as an index of pressure dependency of permeability. This index can be also an indication of the “stiffness of the rock matrix surrounding the critical flow necks”. The change in volumetric strain corresponding to a change in effective stress (i.e., hydrostatic pressure) is defined as bulk modulus, which is essentially an index of pressure dependency of mechanical deformation. Carbonate and quartz are the stiffest minerals in shale rocks, while clay minerals and organic matter are softer. Therefore, it would be reasonable to assume that an increase in “clay+TOC” content would result in lower bulk modulus values (i.e., higher pressure dependency of mechanical deformation) [31]. This might not be the case when minor mineralogical differences exist, although, it certainly holds as the difference becomes more significant.
When investigating transport characteristics of shale rocks, it is naive to make a similar analysis as that of the impacts of mineralogy on mechanical characteristics. Shale rocks have (i) very complicated micro-structure, (ii) a wide range of pore sizes and types, (iii) an anisotropic nature, and (iv) ultra-low permeability values. These characteristics, along with localized fluid transport through critical flow necks, result in unpredictability of pressure dependency of permeability in these rocks. Samples 1-42-3H and 4-4H have 52% and 44% “clay+TOC” content, respectively, the two highest among all the samples. Thus, one might expect that these samples exhibit the highest degree of pressure dependency. As expected, sample 1-42-3H shows the highest pressure-dependency rate of 33.3%. Sample 4-4H shows the lowest pressure-dependency rate of 10.8%, although, we would have anticipated to be the second highest by only considering its mineralogical content. This could be attributed to the complexities associated with fluid transport in unconventional formations, as well as the fact that fluid flow occurs in localized flow paths. Consequently, the spatial distribution of micro-cracks, minerals, organic matter, and pores in the vicinity of flow paths is an important factor. The current state-of-the-art does not allow us to anticipate the flow path, and hence, it would be very difficult to obtain a full understanding of fluid transport in shale rocks. It is worthy to mention that all these complexities exist in the presence of an inert pore fluid (i.e., argon), while introduction of scCO2 into the matrix makes it more complicated.
As a result of interaction with scCO2, the micro-structure of shale rocks is affected, particularly those parts that are in the vicinity of flow path. In some cases, scCO2-induced alteration of micro-structure could entirely divert the flow path by opening/clogging certain flow necks. This, in turn, significantly changes the permeability, particularly for samples with permeabilities less than 10−20 m2. Pressure dependency rate of permeability for samples 2-1H and 1-42-3H are 25.3% and 33.3%, respectively, before interaction with scCO2. These values increase to 41.5% and 45.7% after interaction with scCO2. We believe that the enhanced pressure dependence of these samples is associated with carbonate dissolution, which weakens the rock matrix surrounding the flow path.
The rate of pressure dependency for sample 1-63H is slightly decreased from 25.1% to 21.9%, although it showed a slight increase in its permeability caused by moderate dominance of dissolution over combined effects of mechanical compaction and adsorption. Thus, it would not be true to assume that carbonate dissolution is always associated with weakening of the rock matrix. The slight reduction in pressure dependence of permeability can be attributed to the significance of mechanical compaction over moderate degree of dissolution rate (inferred from moderate increase in permeability), as opposed to samples 2-1H and 1-42-3H. This could be attributed to the fact that, for ultra-low permeability samples (i.e., below 10−20 m2), a moderate dissolution rate can easily exert a slight increase in permeability. However, an increase in the rate of pressure dependency of permeability requires higher degrees of carbonate dissolution, as was the case for samples 2-1H and 1-42-3H.
5. Conclusions
We used eight cores from Eagle Ford, Utica, and Wolfcamp formations, with carbonate content ranging from 4% to 71% and the range of “clay+TOC” content varying from 1% to 52% by weight. Three permeability cycles were performed on all the samples. A four-order-of-magnitude variation was observed in initial argon permeabilities, which are negatively correlated with carbonate content. The highest rate of pressure dependency of permeability was observed for a sample with the highest amount of clay+TOC. However, we could not establish a direct correspondence between mineralogical content and the pressure dependence of permeability. Comparison of permeability with argon pre- and post-exposure to scCO2 revealed a positive correlation between adsorption-induced reversible decrease in scCO2 permeability and the amount of clay+TOC. On the other hand, dissolution-induced irreversible increases in permeability did not show an overall correlation with carbonate content, although the highest degree of dissolution occurred in the sample with the highest carbonate content. In addition, the pressure dependency of permeability was found to be significantly enhanced for samples with remarkable dominance of carbonate dissolution, due to matrix weakening, whereas carbonate-rich Eagle Ford samples did not experience notable change in the rate of pressure dependency of permeability.
Despite the dominance of dissolution in carbonate-rich samples and adsorption in clay-rich samples, we could not establish a universal pattern between mineralogy and scCO2-induced changes in permeability. The BSE images and EDS maps revealed that calcite microstructure is affected by scCO2 which results in dissolution pits, etching, creation of loose grains. In addition, the size of the calcite grains was found to be an important factor in determining the patterns of micro-structural alterations. Dolomite was, however, not affected by interactions with scCO2. We also observed that precipitation of calcium sulfide in very narrow flow channels occurs. The calcium and sulfur that are necessary for the precipitation were fed by dissolution of calcite and pyrite. We believe that the wide range of permeabilities, micro-structural differences, and presence of micro-cracks are among the main factors that complicates the response of the shale rocks to interaction with scCO2. Investigating the permeability values of extended cycles (for three samples) revealed that dissolution is a time-dependent process, while, adsorption does not significantly evolve over longer periods of interaction with scCO2. This would result in a difference in long-term response of carbonate-rich vs. clay-rich samples.
Author Contributions
Conceptualization, A.K.-A. and M.D.Z.; methodology, A.K.-A. and A.H.K.; formal analysis, A.K.-A.; investigation, A.K.-A. and M.D.Z.; resources, M.D.Z.; data curation, A.K.-A.; writing—original draft preparation, A.K.-A.; writing—review and editing, M.D.Z. and A.H.K.; visualization, A.K.-A.; supervision, M.D.Z.; project administration, M.D.Z.; funding acquisition, M.D.Z. All authors have read and agreed to the published version of the manuscript.
Funding
This work was supported as part of the Center for Mechanistic Control of Water-Hydrocarbon-Rock Interactions in Unconventional and Tight Oil Formations (CMC-UF), an Energy Frontier Research Center funded by the U.S. Department of Energy, Office of Science under DOE(BES) Award DE-SC0019165. Moreover, part of this work was performed at the Stanford Nano Shared Facilities (SNSF), supported by the National Science Foundation under award ECCS-1542152.
Institutional Review Board Statement
Not Applicable.
Informed Consent Statement
Not Applicable.
Data Availability Statement
Data is contained within the article.
Acknowledgments
We also thank Adam Jew for his help on the analysis of XRD spectra.
Conflicts of Interest
The authors declare no conflict of interest. The authors also declare that the funders had no role in the design of the study; in the collection, analyses, or interpretation of data; in the writing of the manuscript, or in the decision to publish the results.
References
- IEA Report. Exploring Clean Energy Pathways: The Role of CO2 Storage. 2019. Available online: https://www.iea.org/reports/the-role-of-co2-storage (accessed on 12 April 2020).
- NETL Report. Carbon Sequestration Atlas of the United States and Canada, Fifth ed. National Energy Technology Laboratory; U.S. Department of Energy, 2015. Available online: https://www.netl.doe.gov/sites/default/files/2018-10/ATLAS-V-2015.pdf (accessed on 28 September 2020).
- Kang, S.M.; Fathi, E.; Ambrose, R.J.; Akkutlu, I.Y.; Sigal, R.F. Carbon dioxide storage capacity of organic-rich shales. SPE J. 2011, 16, 842–855. [Google Scholar] [CrossRef] [Green Version]
- Jin, L.; Hawthorne, S.; Sorensen, J.; Pekot, L.; Kurz, B.; Smith, S.; Heebink, L.; Herdegen, V.; Bosshart, N.; Torres, J.; et al. Advancing CO2 enhanced oil recovery and storage in unconventional oil play—experimental studies on Bakken shales. Appl. Energy 2017, 208, 171–183. [Google Scholar] [CrossRef]
- Middleton, R.S.; Carey, J.W.; Currier, R.P.; Hyman, J.D.; Kang, Q.; Karra, S.; Jiménez-Martínez, J.; Porter, M.L.; Viswanathan, H.S. Shale gas and non-aqueous fracturing fluids: Opportunities and challenges for supercritical CO2. Appl. Energy 2015, 147, 500–509. [Google Scholar] [CrossRef] [Green Version]
- Jia, B.; Tsau, J.S.; Barati, R. A review of the current progress of CO2 injection EOR and carbon storage in shale oil reservoirs. Fuel 2019, 236, 404–427. [Google Scholar] [CrossRef]
- Zoback, M.D.; Kovscek, A.R.; Wilcox, J. Interdisciplinary Investigation of CO2 Sequestration in Depleted Shale Gas Formations; The Leland Stanford Junior University: Stanford, CA, USA, 2013. [Google Scholar]
- Heller, R.; Vermylen, J.; Zoback, M. Experimental investigation of matrix permeability of gas shales. AAPG Bull. 2014, 98, 975–995. [Google Scholar] [CrossRef]
- Zoback, M.D.; Kohli, A.H. Unconventional Reservoir Geomechanics; Cambridge University Press: Cambridge, UK, 2019. [Google Scholar]
- Zhang, C.; Ranjith, P.G. Experimental study of matrix permeability of gas shale: An application to CO2-based shale fracturing. Energies 2018, 11, 702. [Google Scholar] [CrossRef] [Green Version]
- Yin, H.; Zhou, J.; Jiang, Y.; Xian, X.; Liu, Q. Physical and structural changes in shale associated with supercritical CO2 exposure. Fuel 2016, 184, 289–303. [Google Scholar] [CrossRef]
- Pan, Y.; Hui, D.; Luo, P.; Zhang, Y.; Zhang, L.; Sun, L. Influences of subcritical and supercritical CO2 treatment on the pore structure characteristics of marine and terrestrial shales. J. CO2 Util. 2018, 28, 152–167. [Google Scholar] [CrossRef]
- Pan, Y.; Hui, D.; Luo, P.; Zhang, Y.; Sun, L.; Wang, K. Experimental investigation of the geochemical interactions between supercritical CO2 and shale: Implications for CO2 storage in gas-bearing shale formations. Energy Fuels 2018, 32, 1963–1978. [Google Scholar] [CrossRef]
- Hadian, P.; Rezaee, R. The Effect of Supercritical CO2 on Shaly Caprocks. Energies 2020, 13, 149. [Google Scholar] [CrossRef] [Green Version]
- Rohmer, J.; Pluymakers, A.; Renard, F. Mechano-chemical interactions in sedimentary rocks in the context of CO2 storage: Weak acid, weak effects? Earth-Sci. Rev. 2016, 157, 86–110. [Google Scholar] [CrossRef]
- Lu, J.; Nicot, J.P.; Mickler, P.J.; Ribeiro, L.H.; Darvari, R. Alteration of Bakken reservoir rock during CO2-based fracturing—An autoclave reaction experiment. J. Unconv. Oil Gas Resour. 2016, 14, 72–85. [Google Scholar] [CrossRef]
- Sanguinito, S.; Goodman, A.; Tkach, M.; Kutchko, B.; Culp, J.; Natesakhawat, S.; Fazio, J.; Fukai, I.; Crandall, D. Quantifying dry supercritical CO2-induced changes of the Utica Shale. Fuel 2018, 226, 54–64. [Google Scholar] [CrossRef] [Green Version]
- Goodman, A.; Sanguinito, S.; Tkach, M.; Natesakhawat, S.; Kutchko, B.; Fazio, J.; Cvetic, P. Investigating the role of water on CO2-Utica Shale interactions for carbon storage and shale gas extraction activities–Evidence for pore scale alterations. Fuel 2019, 242, 744–755. [Google Scholar] [CrossRef]
- Kutchko, B.; Sanguinito, S.; Natesakhawat, S.; Cvetic, P.; Culp, J.T.; Goodman, A. Quantifying pore scale and matrix interactions of SCCO2 with the Marcellus shale. Fuel 2020, 266, 116928. [Google Scholar] [CrossRef]
- Heller, R.; Zoback, M. Adsorption of methane and carbon dioxide on gas shale and pure mineral samples. J. Unconv. Oil Gas Resour. 2014, 8, 14–24. [Google Scholar] [CrossRef] [Green Version]
- Lindner, E.N. Review of the Effects of CO2 on Very-Fine-Grained Sedimentary Rock/Shale–Part II: Clay Mineral & Shale Response to Hydration (No. 68913329-03d5-45bc-b32a-a7e8e763b10a); National Energy Technology Laboratory-Energy Data eXchange; NETL: 2016. Available online: https://www.osti.gov/scitech/search/filter-results:FD/semantic:10.18141/1432993 (accessed on 3 March 2020).
- Al Ismail, M.; Reece, J.S.; Hol, S.; Zoback, M. The effect of CO2 adsorption on permeability anisotropy in the Eagle Ford Shale. In Unconventional Resources Technology Conference (URTEC); 2014; Available online: https://onepetro.org/URTECONF/proceedings-abstract/14URTC/All-14URTC/URTEC-1921520-MS/151592 (accessed on 15 November 2019).
- Wu, W.; Zoback, M.D.; Kohli, A.H. The impacts of effective stress and CO2 sorption on the matrix permeability of shale reservoir rocks. Fuel 2017, 203, 179–186. [Google Scholar] [CrossRef]
- Klewiah, I.; Berawala, D.S.; Walker, H.C.A.; Andersen, P.Ø.; Nadeau, P.H. Review of experimental sorption studies of CO2 and CH4 in shales. J. Nat. Gas Sci. Eng. 2020, 73, 103045. [Google Scholar] [CrossRef]
- van Noort, R.; Yarushina, V. Water, CO2 and argon permeabilities of intact and fractured shale cores under stress. Rock Mech. Rock Eng. 2019, 52, 299–319. [Google Scholar] [CrossRef] [Green Version]
- Play, W.S. Permian Basin. 2018. Available online: https://www.eia.gov/maps/pdf/PermianBasin_Wolfcamp_EIAReport_Oct2018.pdf (accessed on 24 May 2020).
- Scheidegger, A.E. The Physics of Flow through Porous Media, 3rd ed.; University of Toronto Press: Toronto, ON, Canada, 1974. [Google Scholar]
- Brace, W.; Walsh, J.B.; Frangos, W.T. Permeability of granite under high pressure. J. Geophys. Res. 1968, 73, 2225–2236. [Google Scholar] [CrossRef]
- Metwally, Y.M.; Sondergeld, C.H. Measuring low permeabilities of gas-sands and shales using a pressure transmission technique. Int. J. Rock Mech. Min. Sci. 2011, 48, 1135–1144. [Google Scholar] [CrossRef]
- Einsele, G. Sedimentary Basins: Evolution, Facies, and Sediment Budget; Springer Science & Business Media: Berlin/Heidelberg, Germany, 2000. [Google Scholar]
- Kamali-Asl, A.; Ghazanfari, E.; Newell, P.; Stevens, M. Elastic, viscoelastic, and strength properties of Marcellus Shale specimens. J. Pet. Sci. Eng. 2018, 171, 662–679. [Google Scholar] [CrossRef]
Figure 1.
Photos of (a) test chamber, and (b) jacketed sample placed on the core-holder.

Figure 2.
The generic experimental path followed during the experiments. Note that extended cycles of argon/scCO2 permeabilities were conducted for three samples.
Figure 2.
The generic experimental path followed during the experiments. Note that extended cycles of argon/scCO2 permeabilities were conducted for three samples.

Figure 3.
Evolution of (a) differential pore pressure in a steady-state measurement, and (b) downstream pore pressure in a modified pulse-decay measurement.
Figure 3.
Evolution of (a) differential pore pressure in a steady-state measurement, and (b) downstream pore pressure in a modified pulse-decay measurement.

Figure 4.
Permeability changes for sample 2-1H.

Figure 5.
Permeability changes for sample 4-2H.

Figure 6.
SEM images of sample 4-2H at two different magnifications for (a,b) unreacted, and (c,d) reacted plugs.
Figure 6.
SEM images of sample 4-2H at two different magnifications for (a,b) unreacted, and (c,d) reacted plugs.


Figure 7.
Permeability changes for sample 4-4H.

Figure 8.
Permeability changes for sample 3-2H.

Figure 9.
Permeability changes for samples (a) 1-63H and (b) 3-110H.


Figure 10.
Permeability changes for sample 1-42-3H.

Figure 11.
Permeability changes for sample 4-6H.

Figure 12.
Carbonate content vs. pre-scCO2 permeability.

Figure 13.
Mean free path for argon and CO2 in pressures ranging from 1 to 20 MPa.

Figure 14.
Ternary diagram by processes affecting permeability.

Figure 15.
BSE images and EDS maps for a region with carbonate minerals; (a,b) BSE images of a region with calcite and dolomite alteration; (c,d) calcium EDS maps of the same region.
Figure 15.
BSE images and EDS maps for a region with carbonate minerals; (a,b) BSE images of a region with calcite and dolomite alteration; (c,d) calcium EDS maps of the same region.

Figure 16.
BSE images and EDS maps of a region with different patterns of etching/dissolution (a,b) BSE images of this region with different patterns of calcite alteration; (c,d) EDS maps for calcium and carbon in the region associated with Figure 16a.
Figure 16.
BSE images and EDS maps of a region with different patterns of etching/dissolution (a,b) BSE images of this region with different patterns of calcite alteration; (c,d) EDS maps for calcium and carbon in the region associated with Figure 16a.

Figure 17.
BSE images and EDS maps of calcite and dolomite grains at two different regions (a,b) BSE images from these two regions with different sizes of calcite/dolomite grains; (c,d) the EDS maps of calcium associated with the regions of BSE images.
Figure 17.
BSE images and EDS maps of calcite and dolomite grains at two different regions (a,b) BSE images from these two regions with different sizes of calcite/dolomite grains; (c,d) the EDS maps of calcium associated with the regions of BSE images.

Figure 18.
BSE images and EDS maps at two different magnifications in a region with precipitation of calcium sulfide (a,b) BSE images of the same region at two different magnifications of 250× and 1000×; (c,d) the EDS maps for calcium at magnifications of 250× and 1000×; (e,f) the EDS maps of sulfur at magnifications of 250× and 1000×.


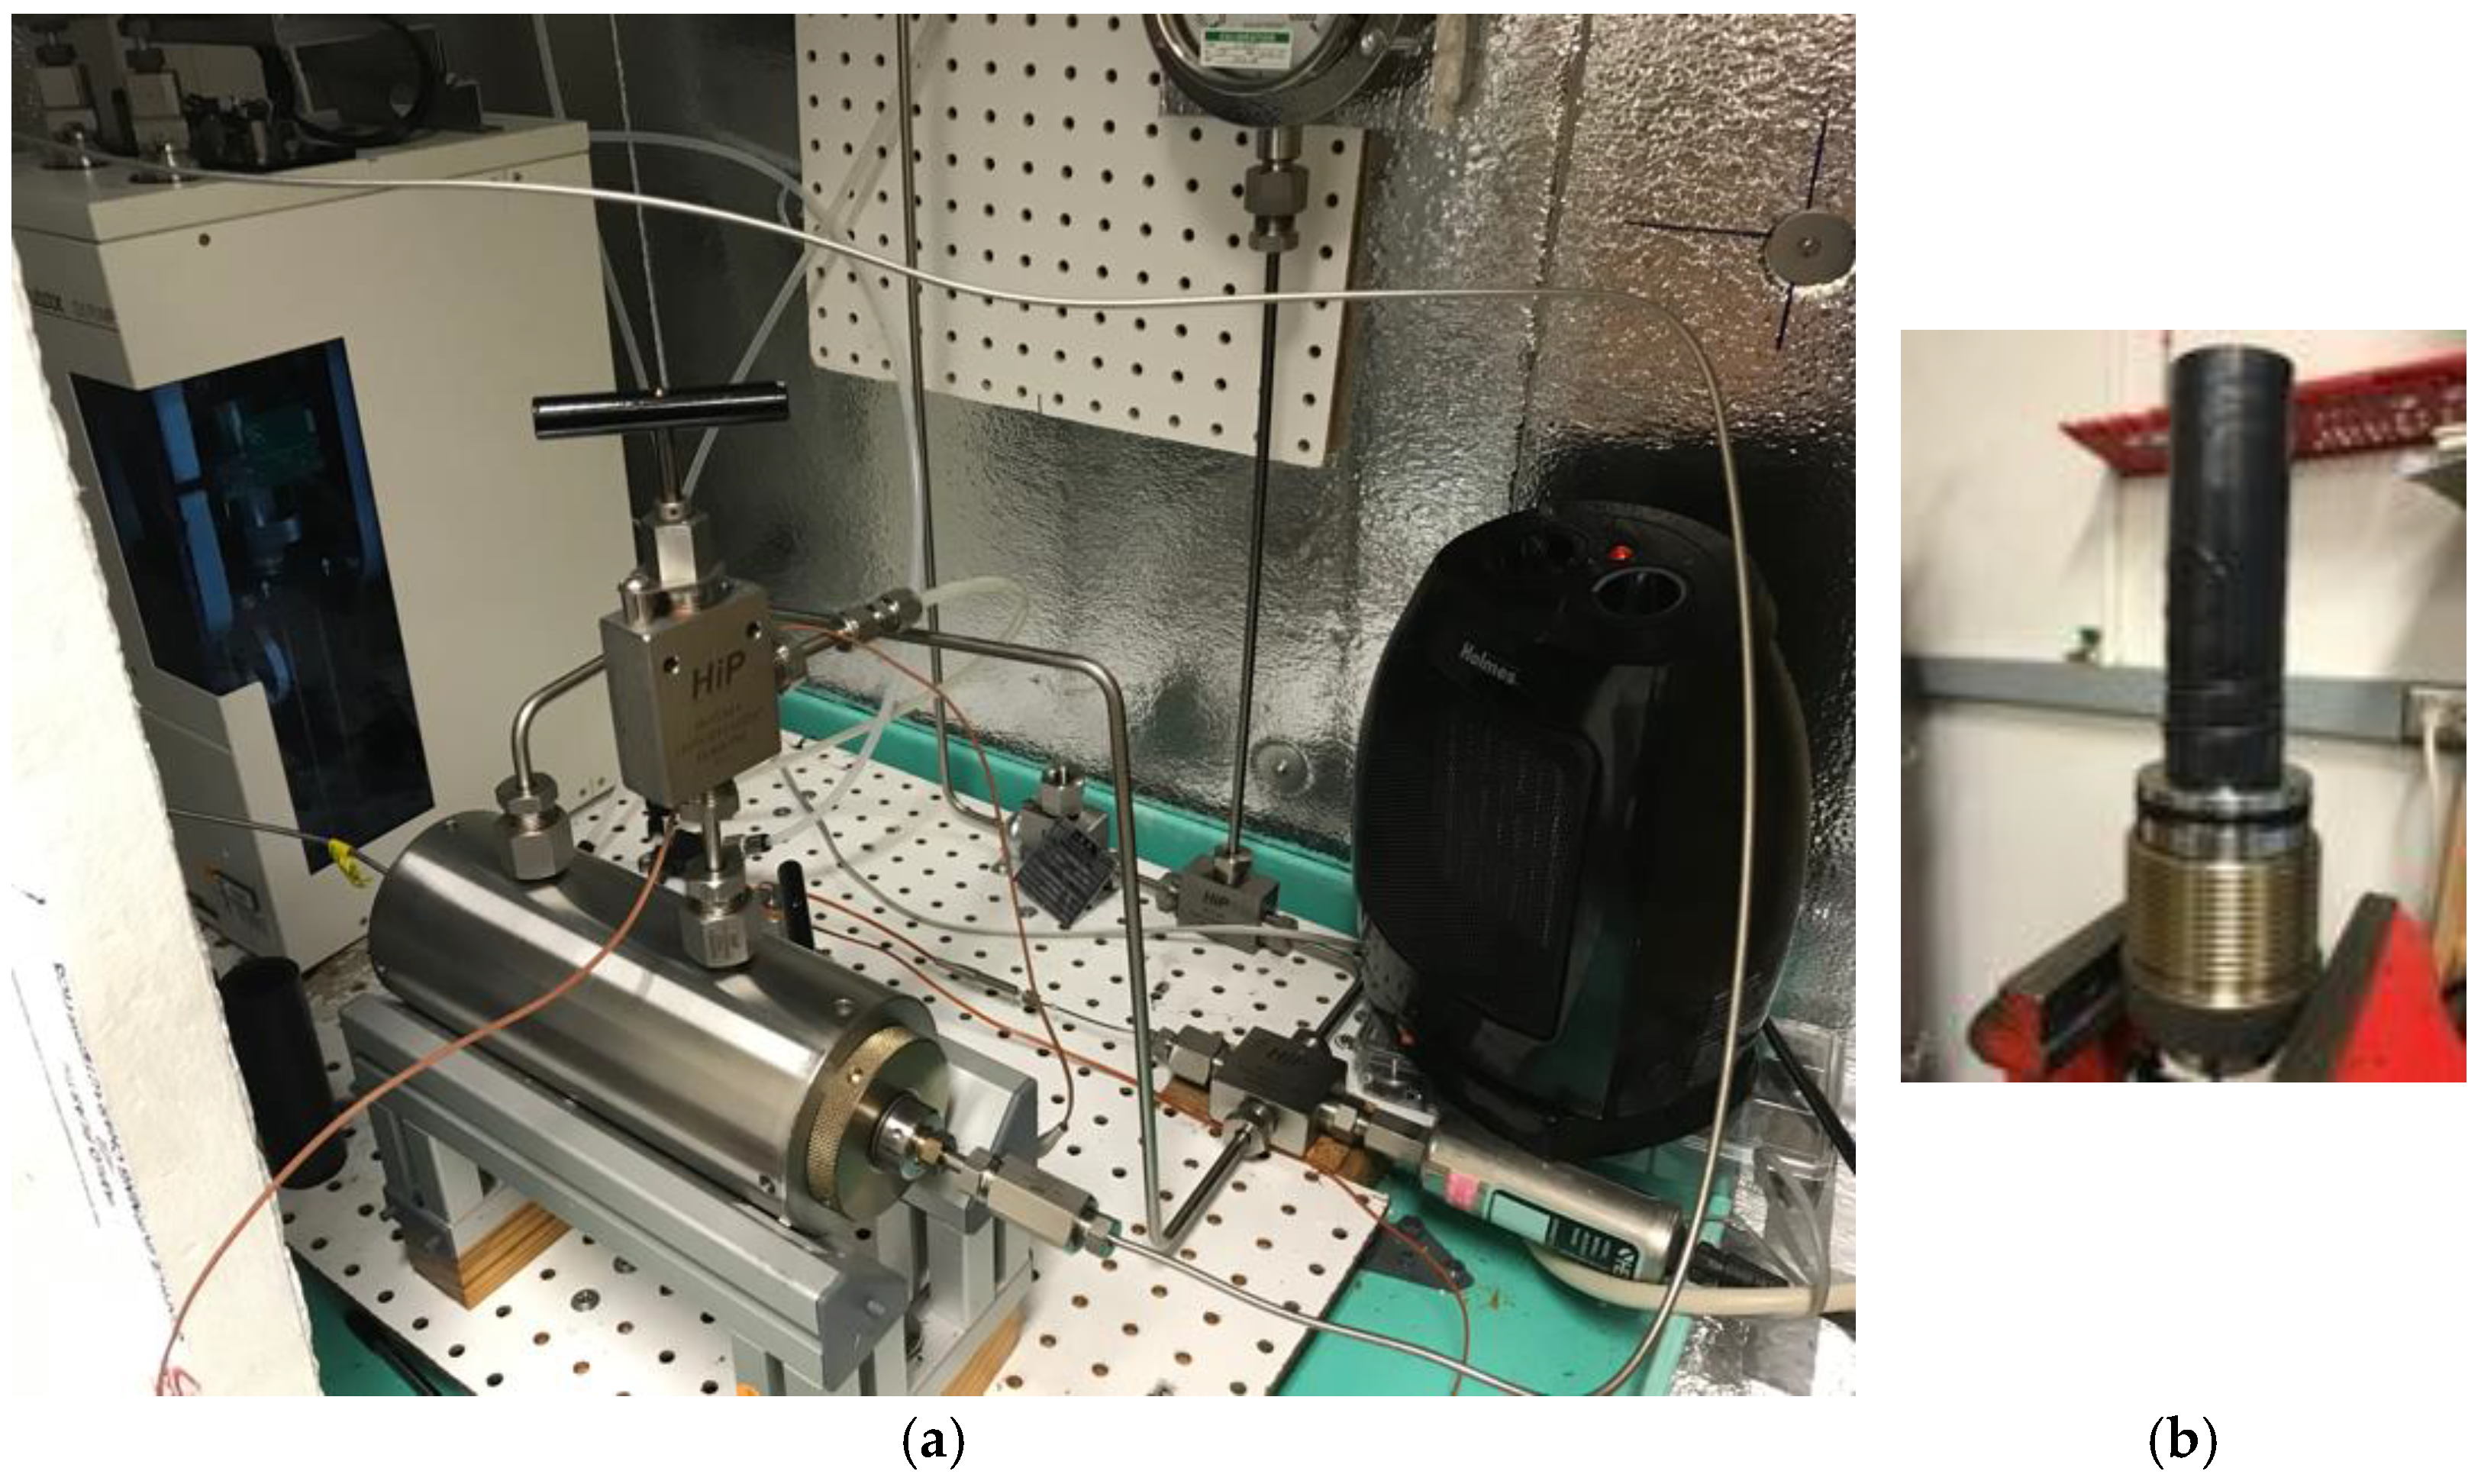
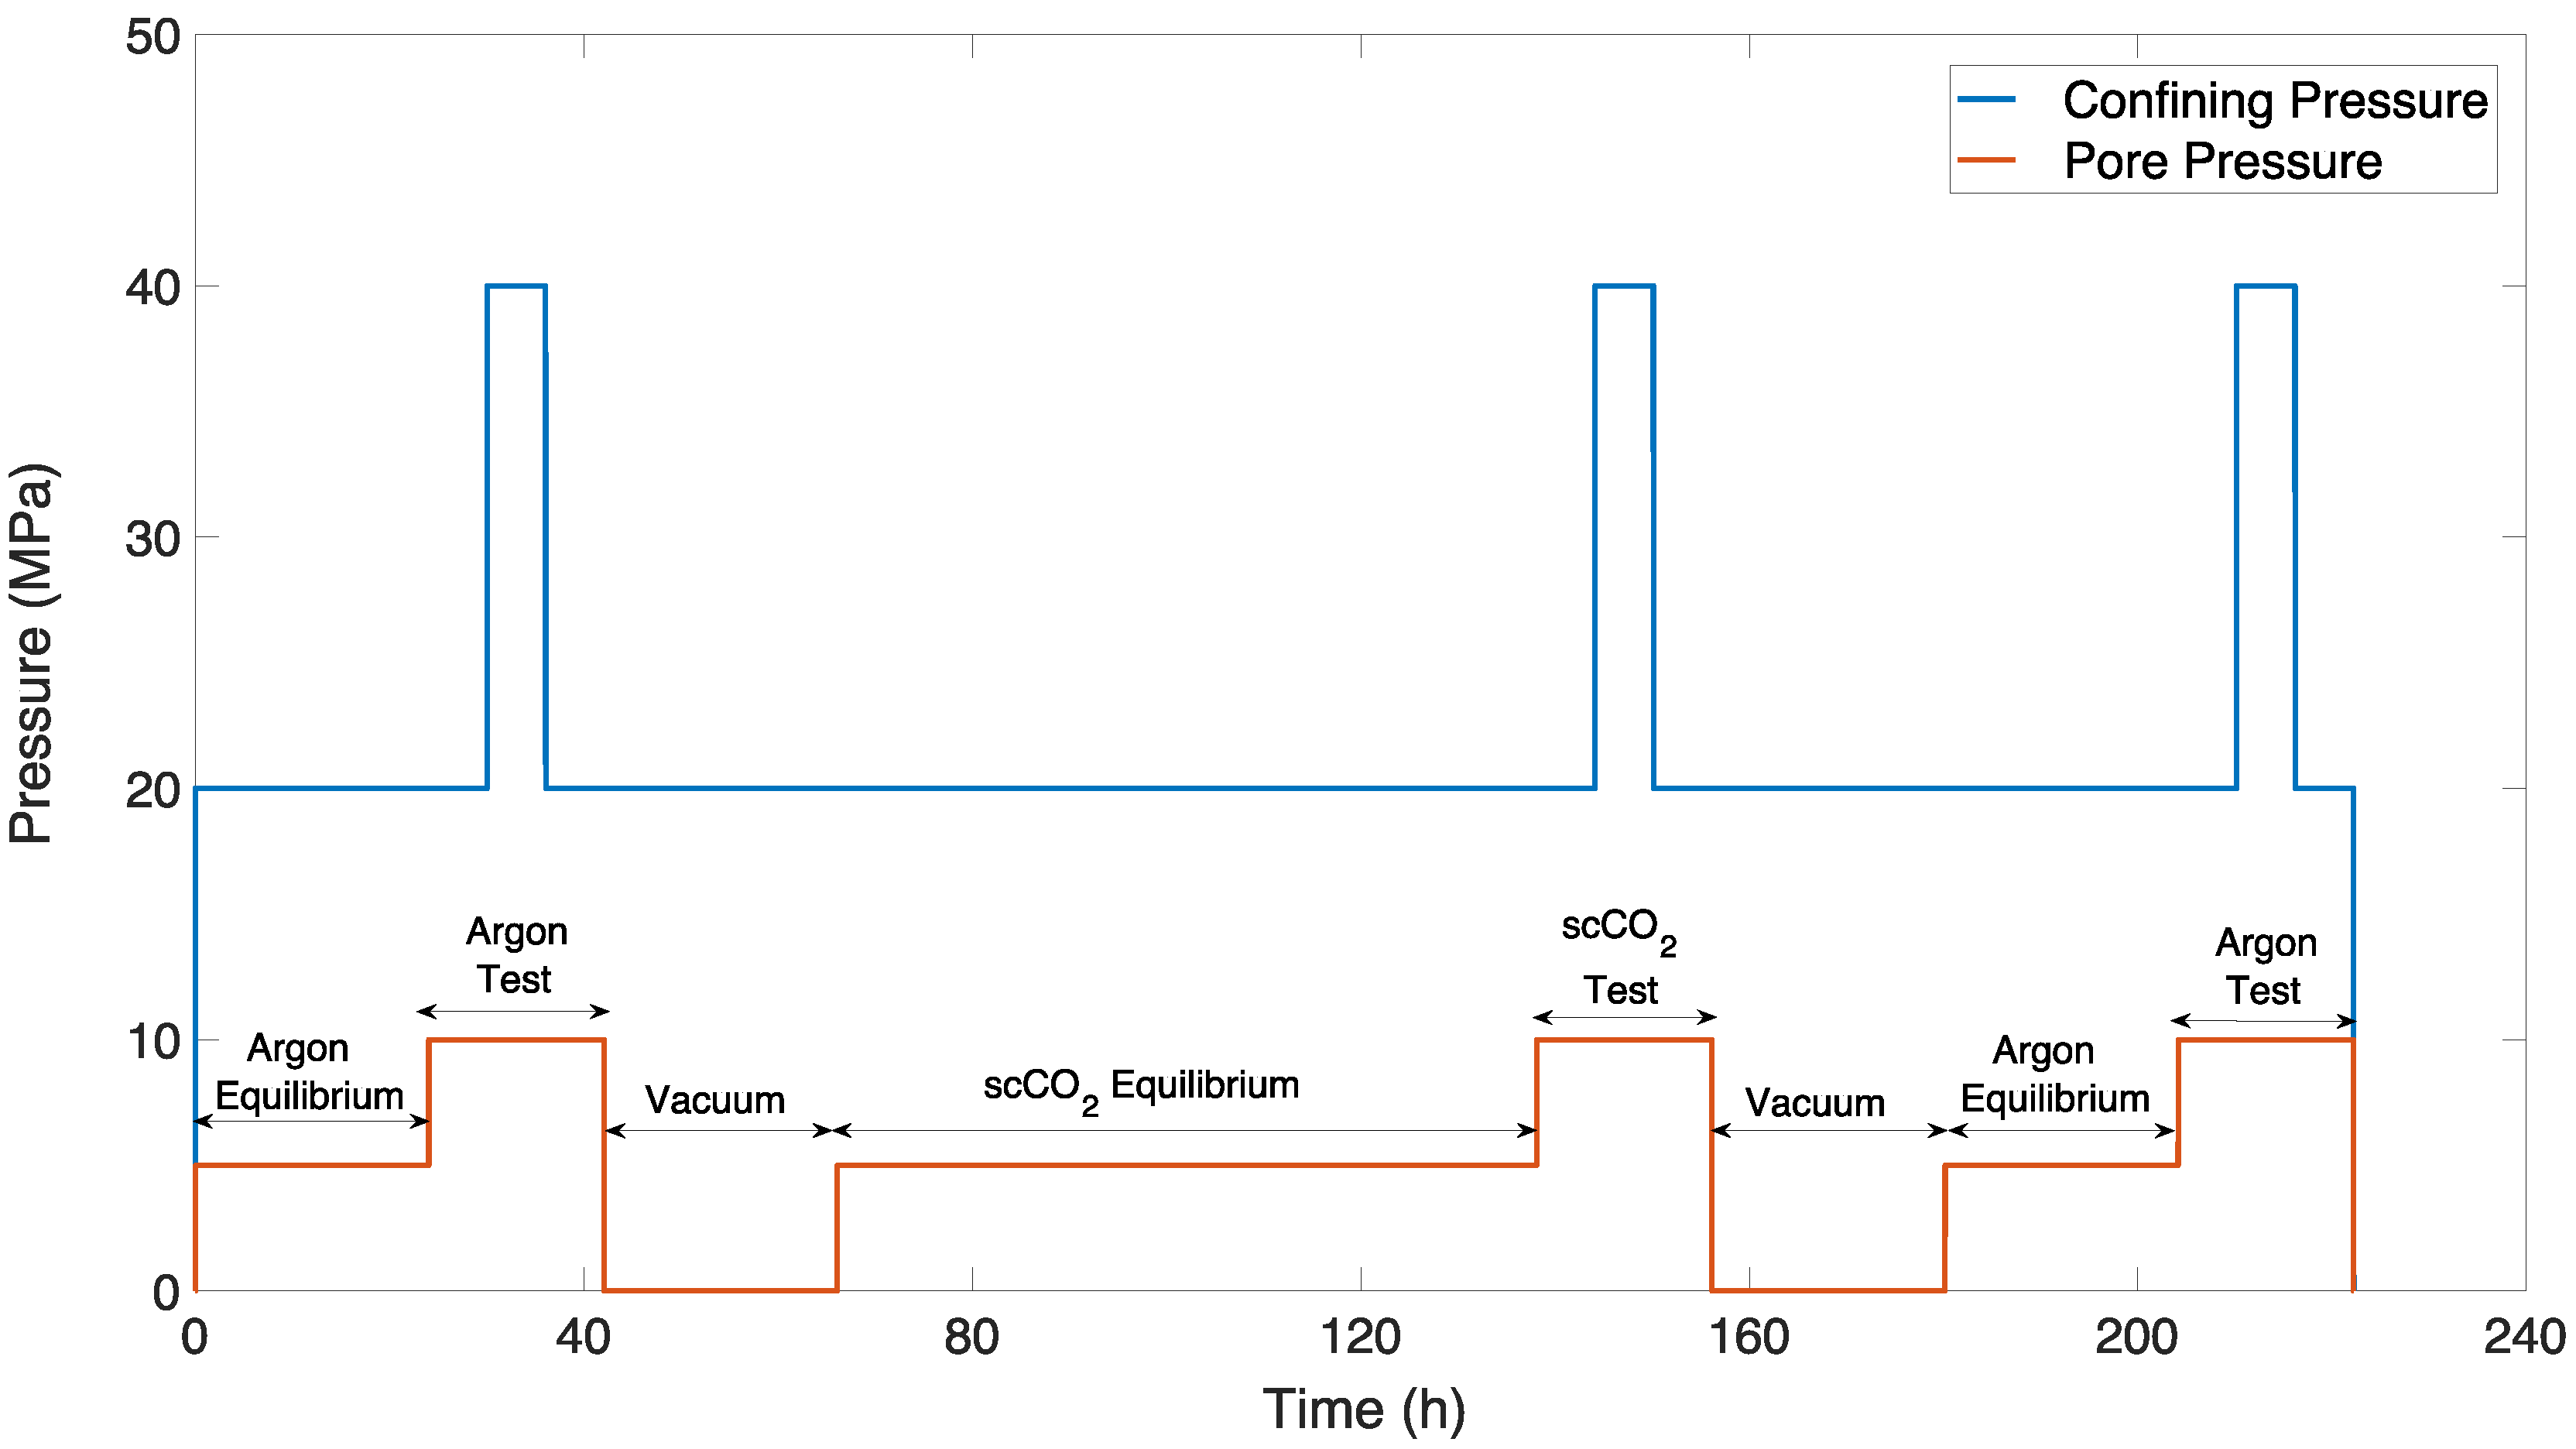
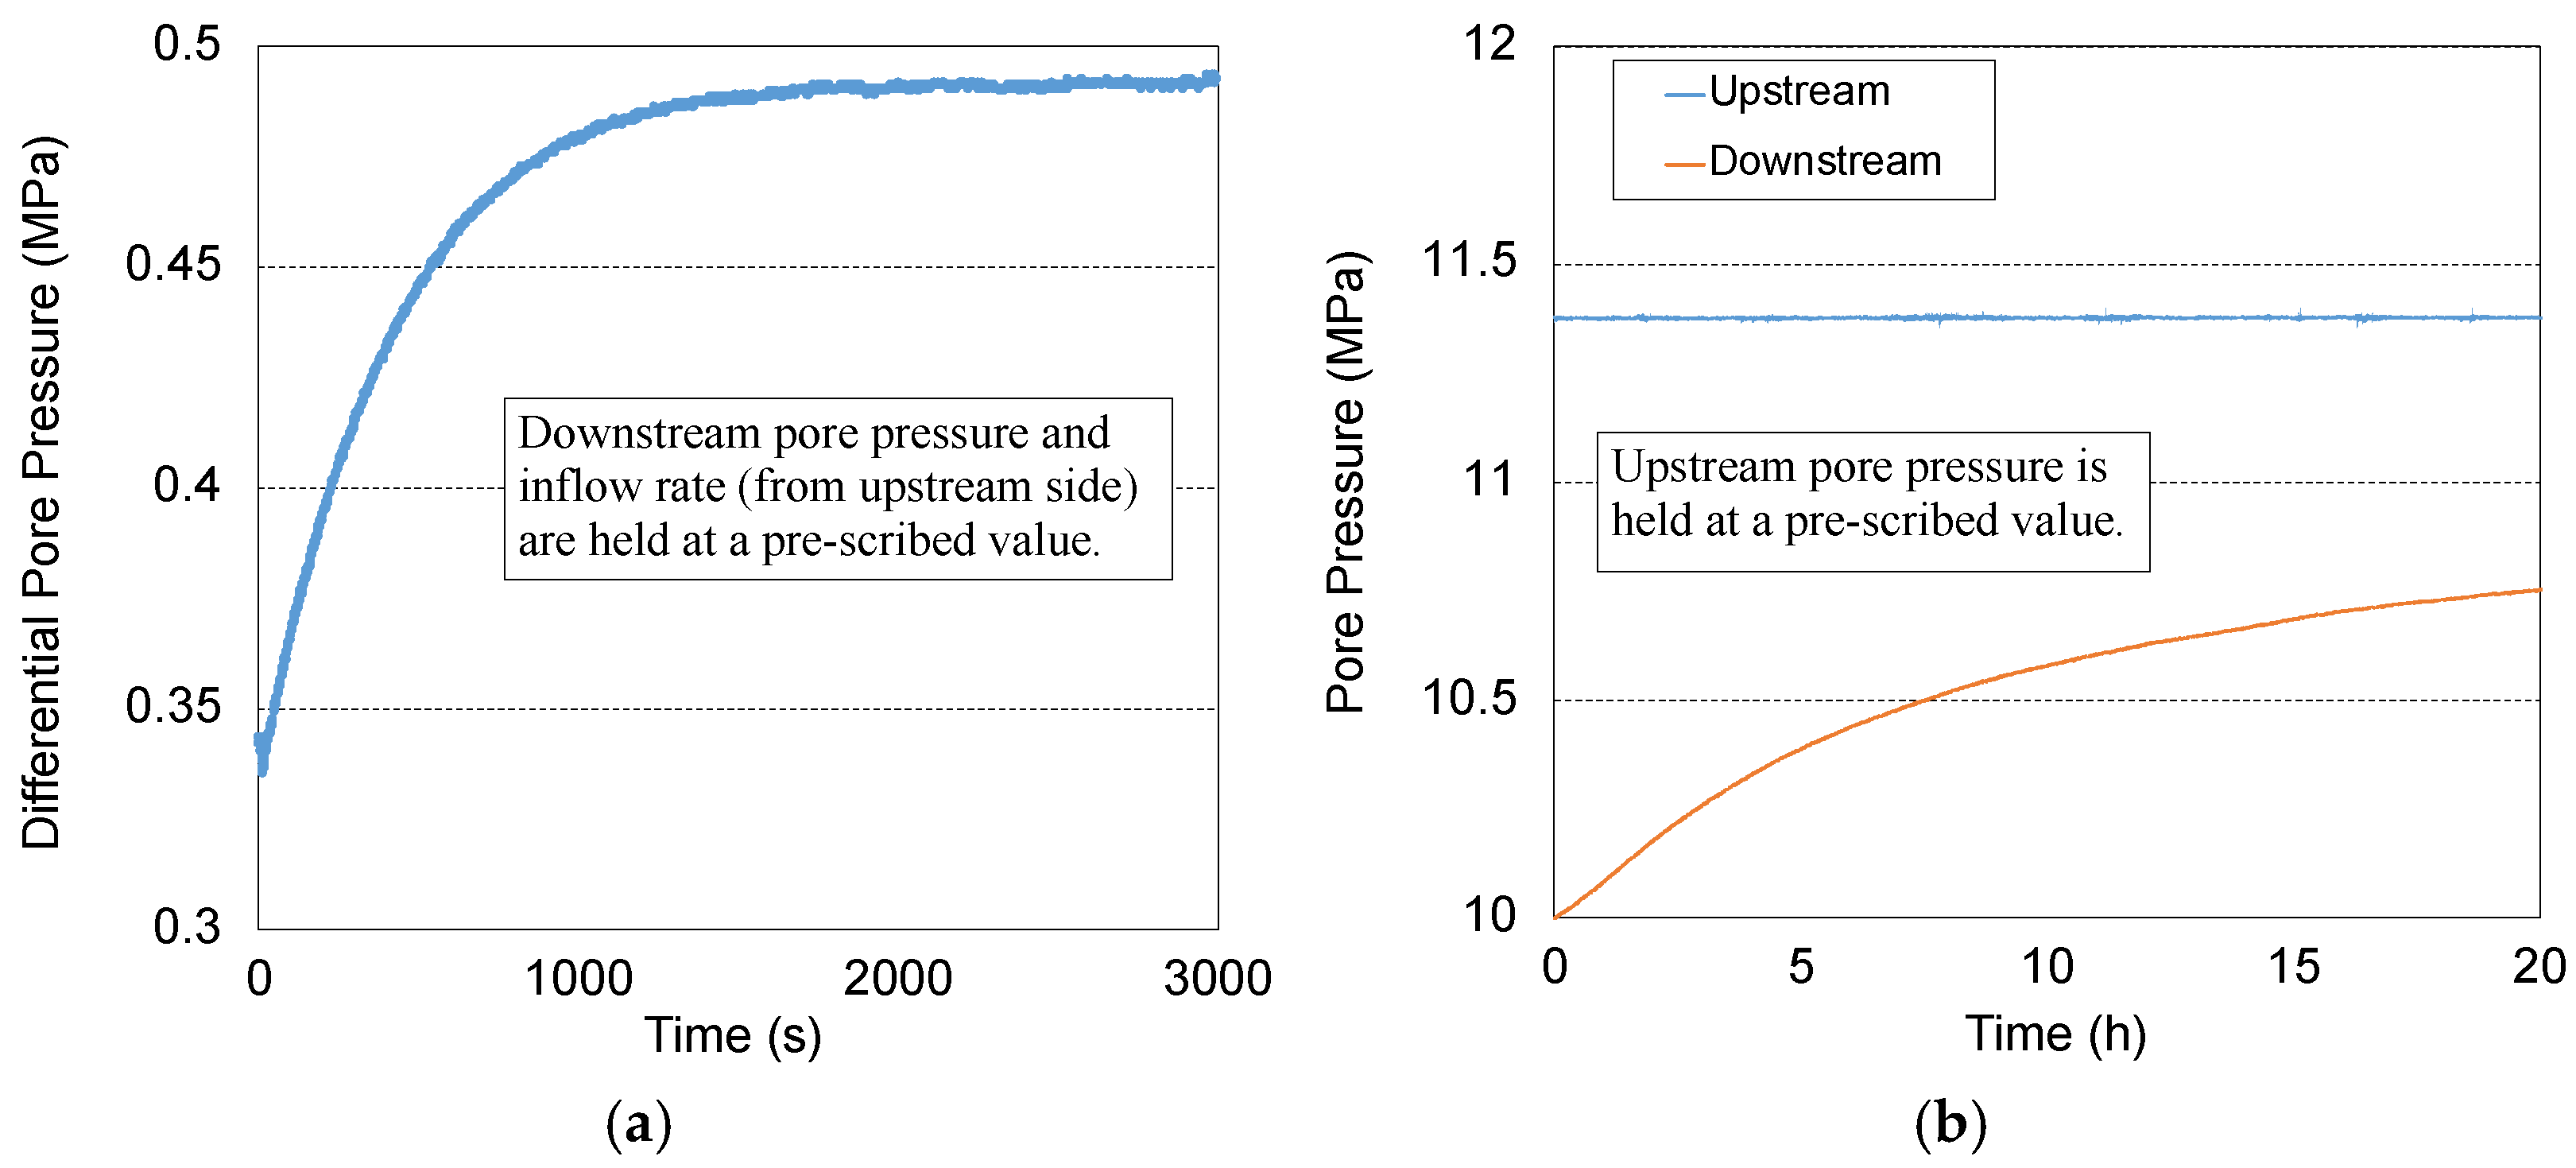
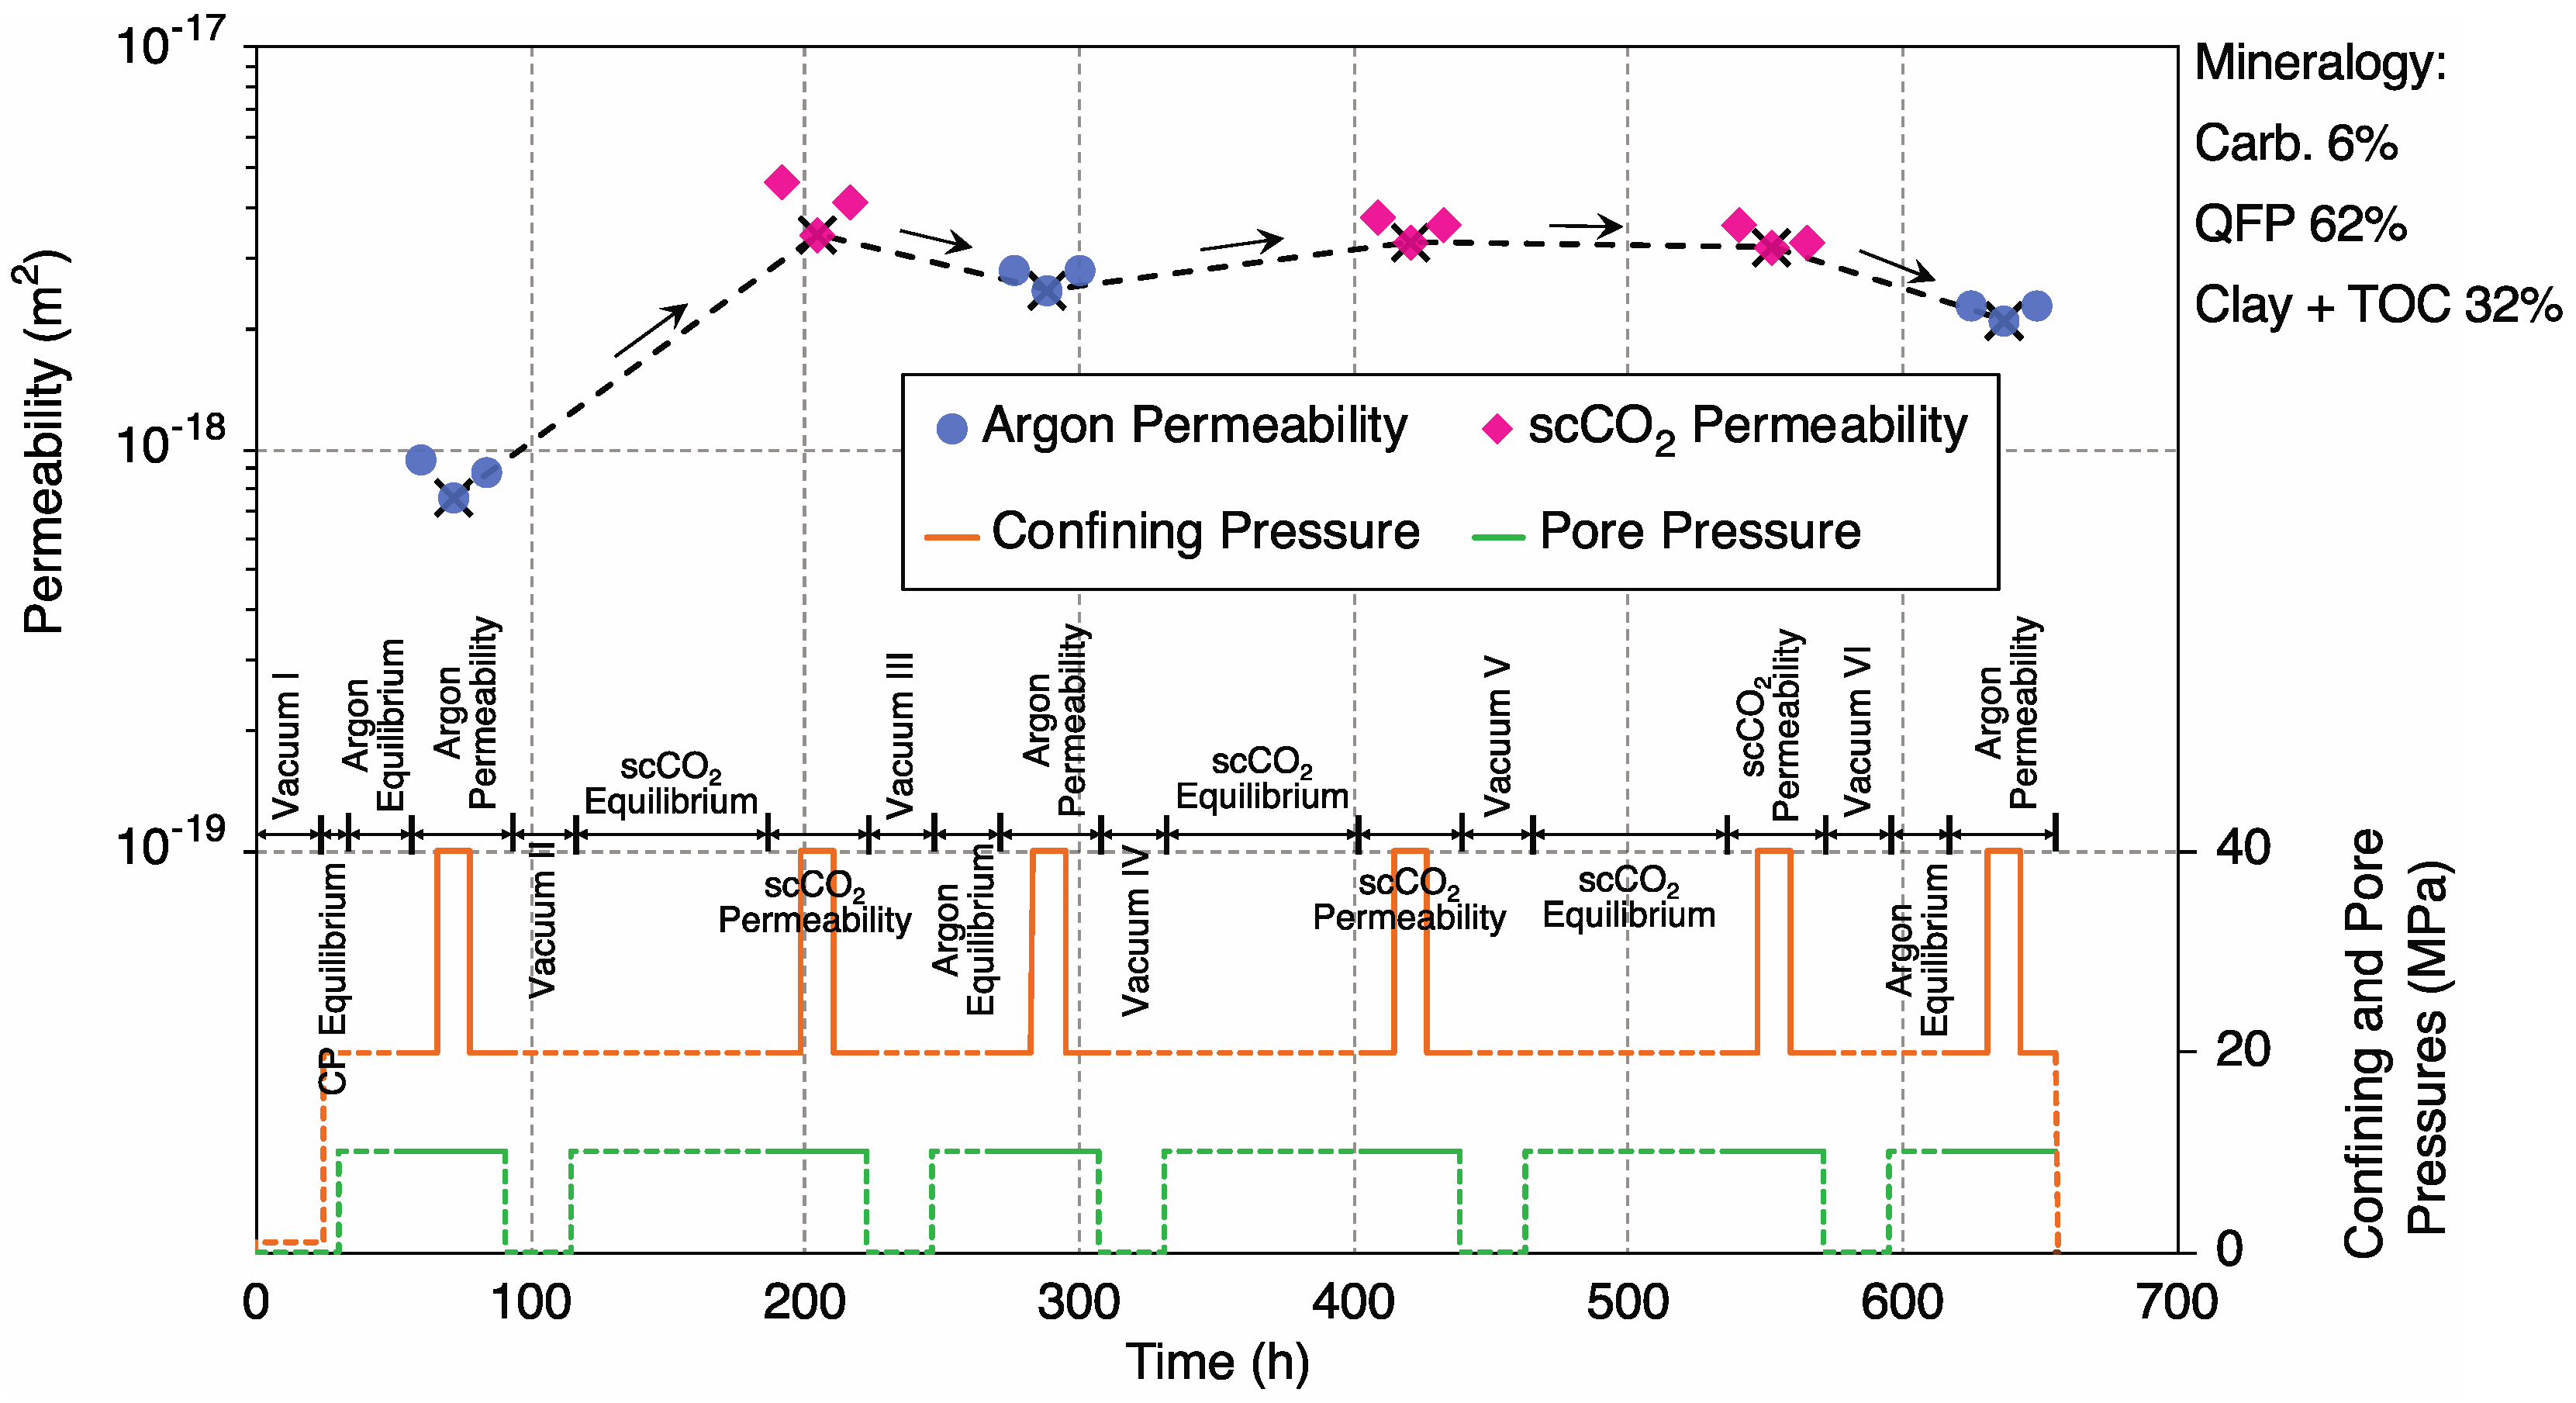
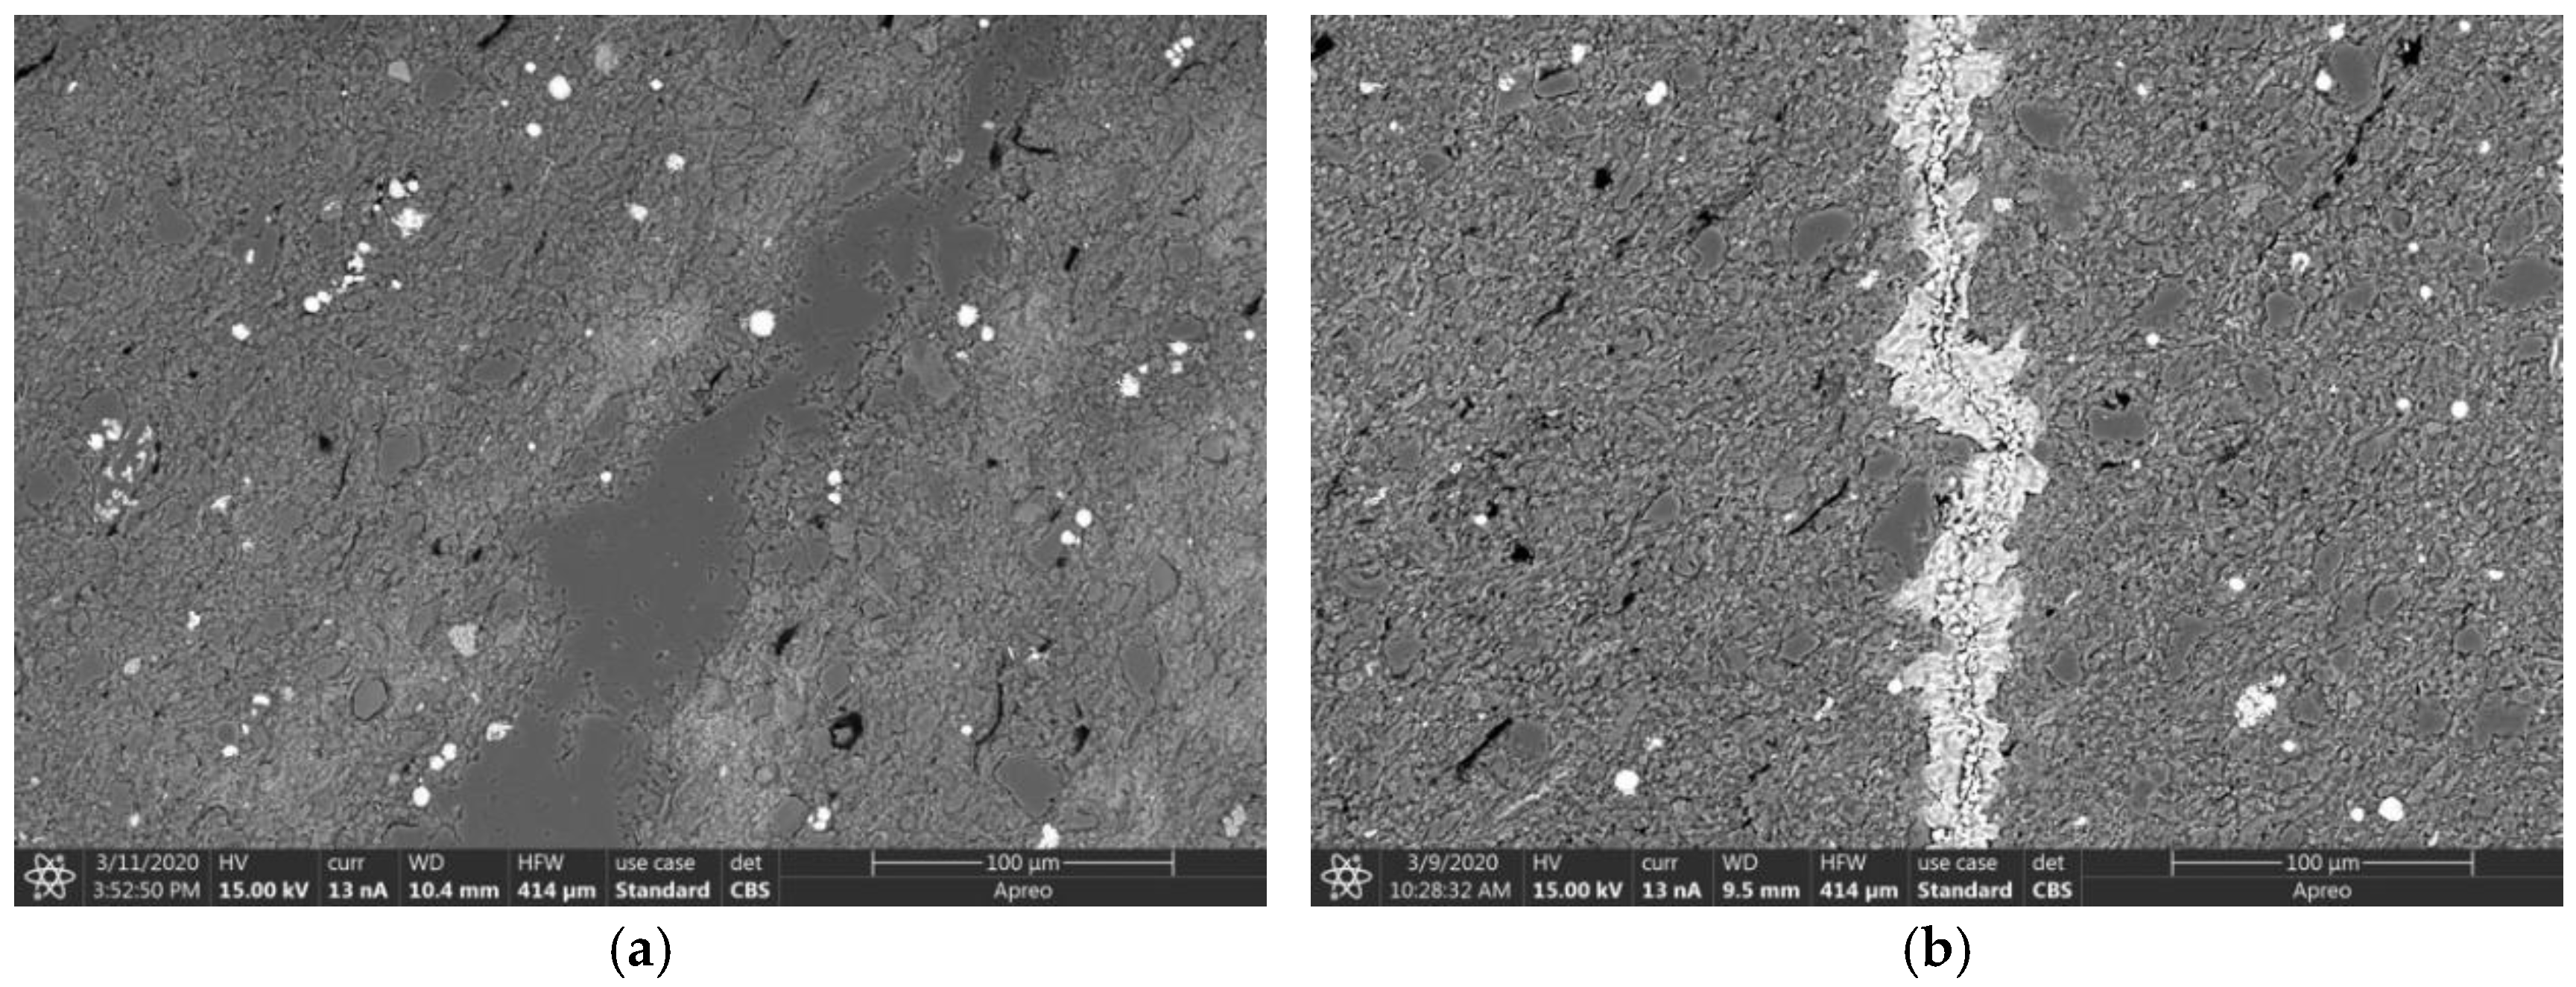
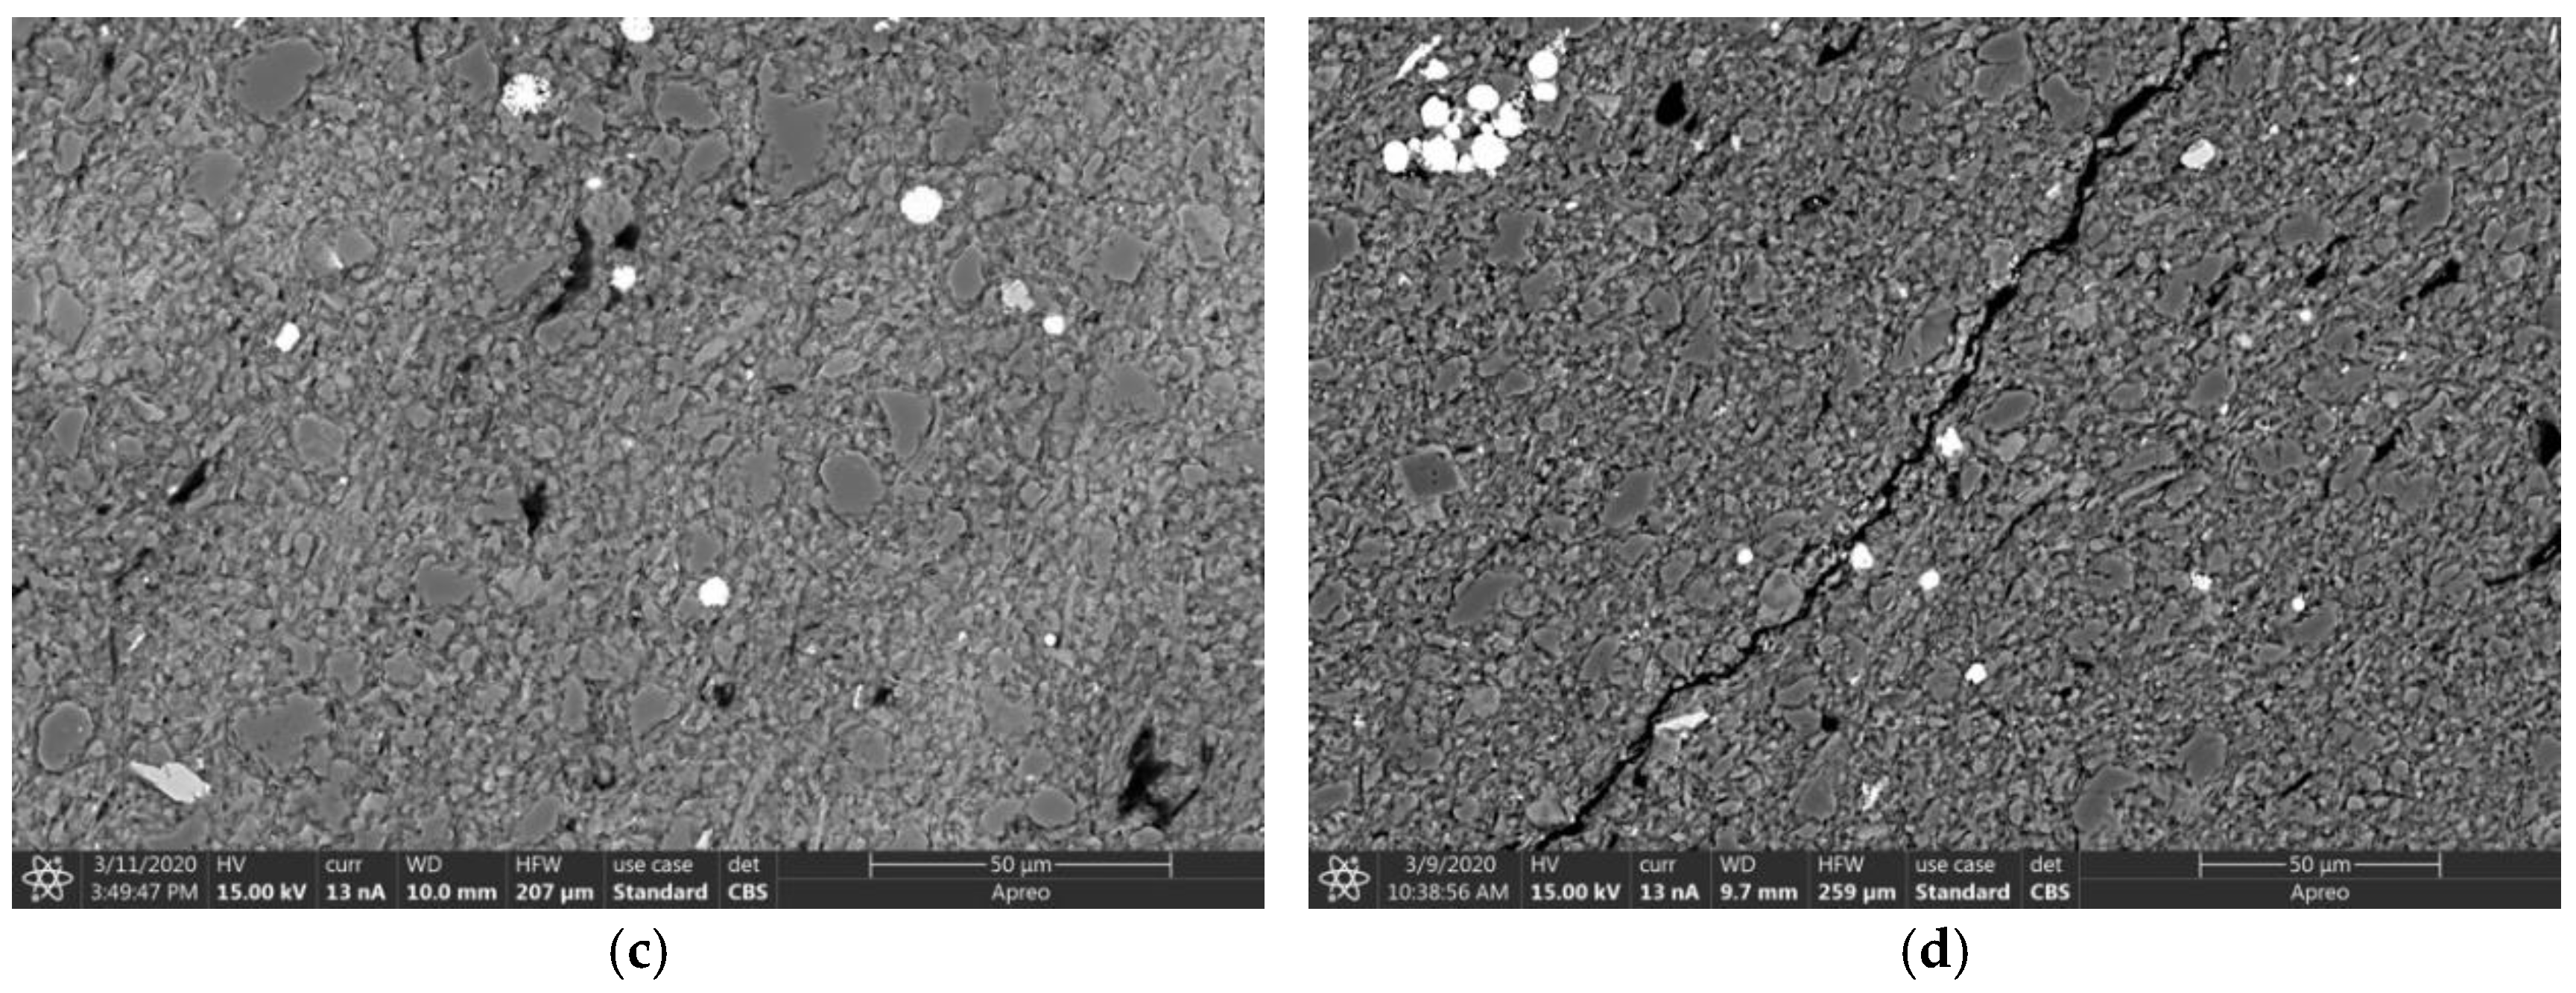
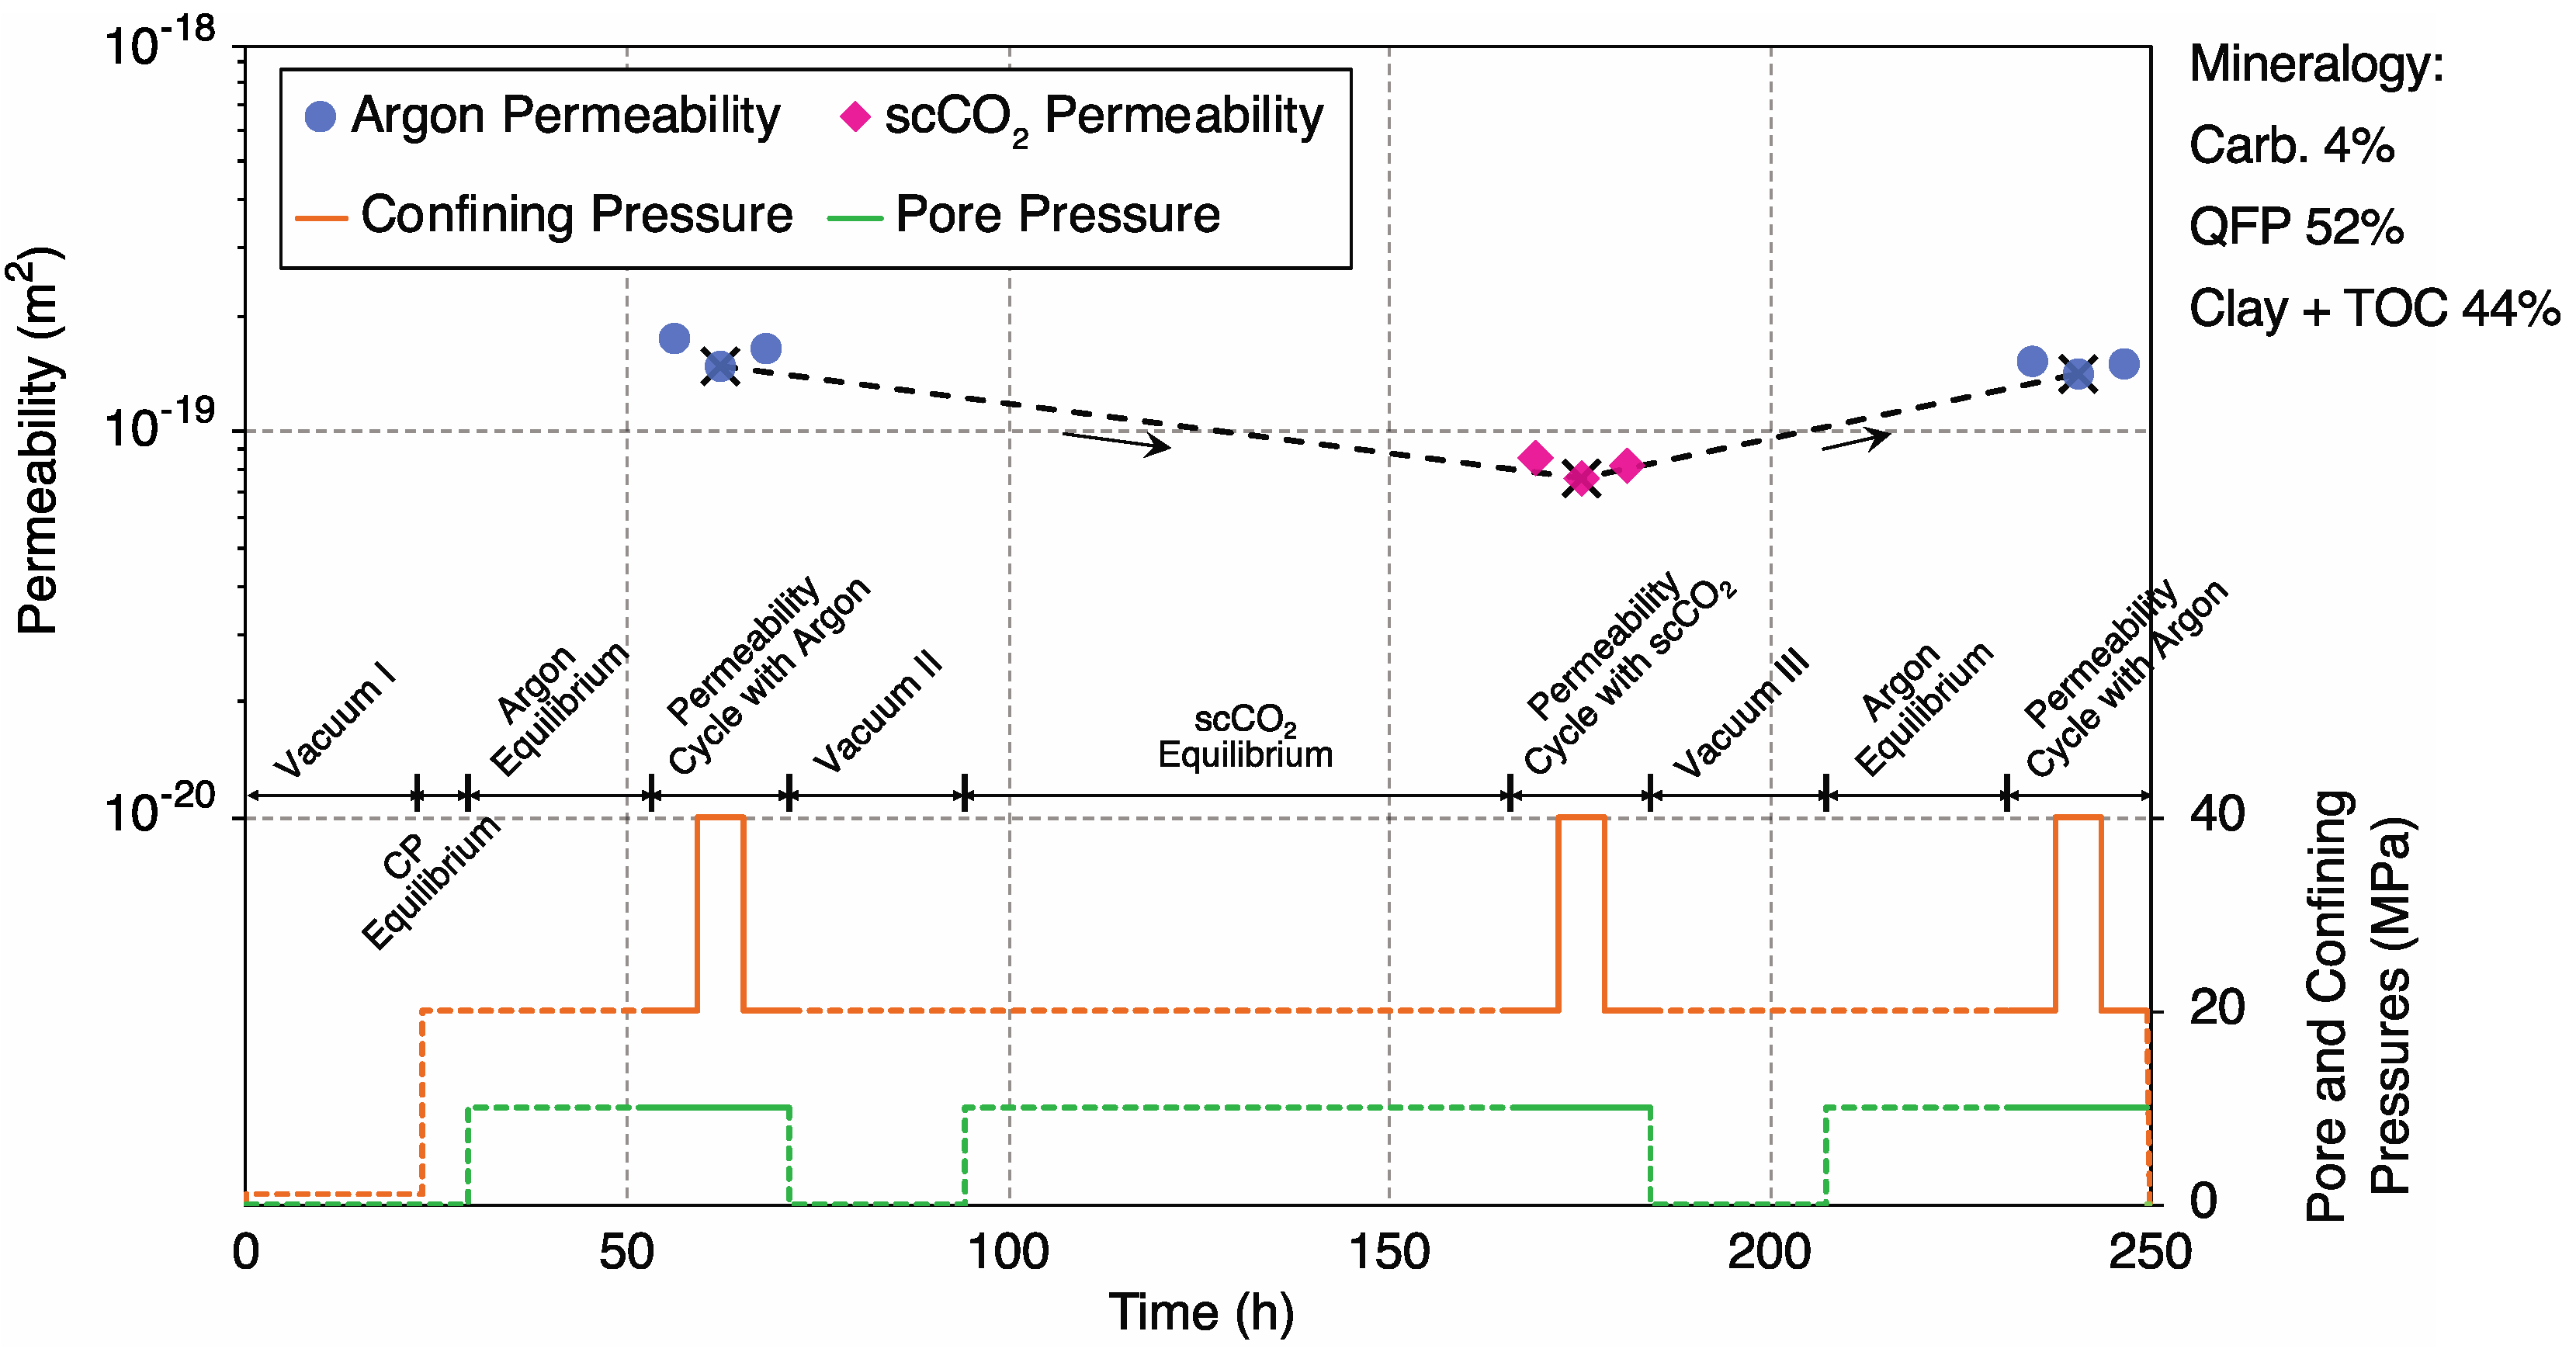
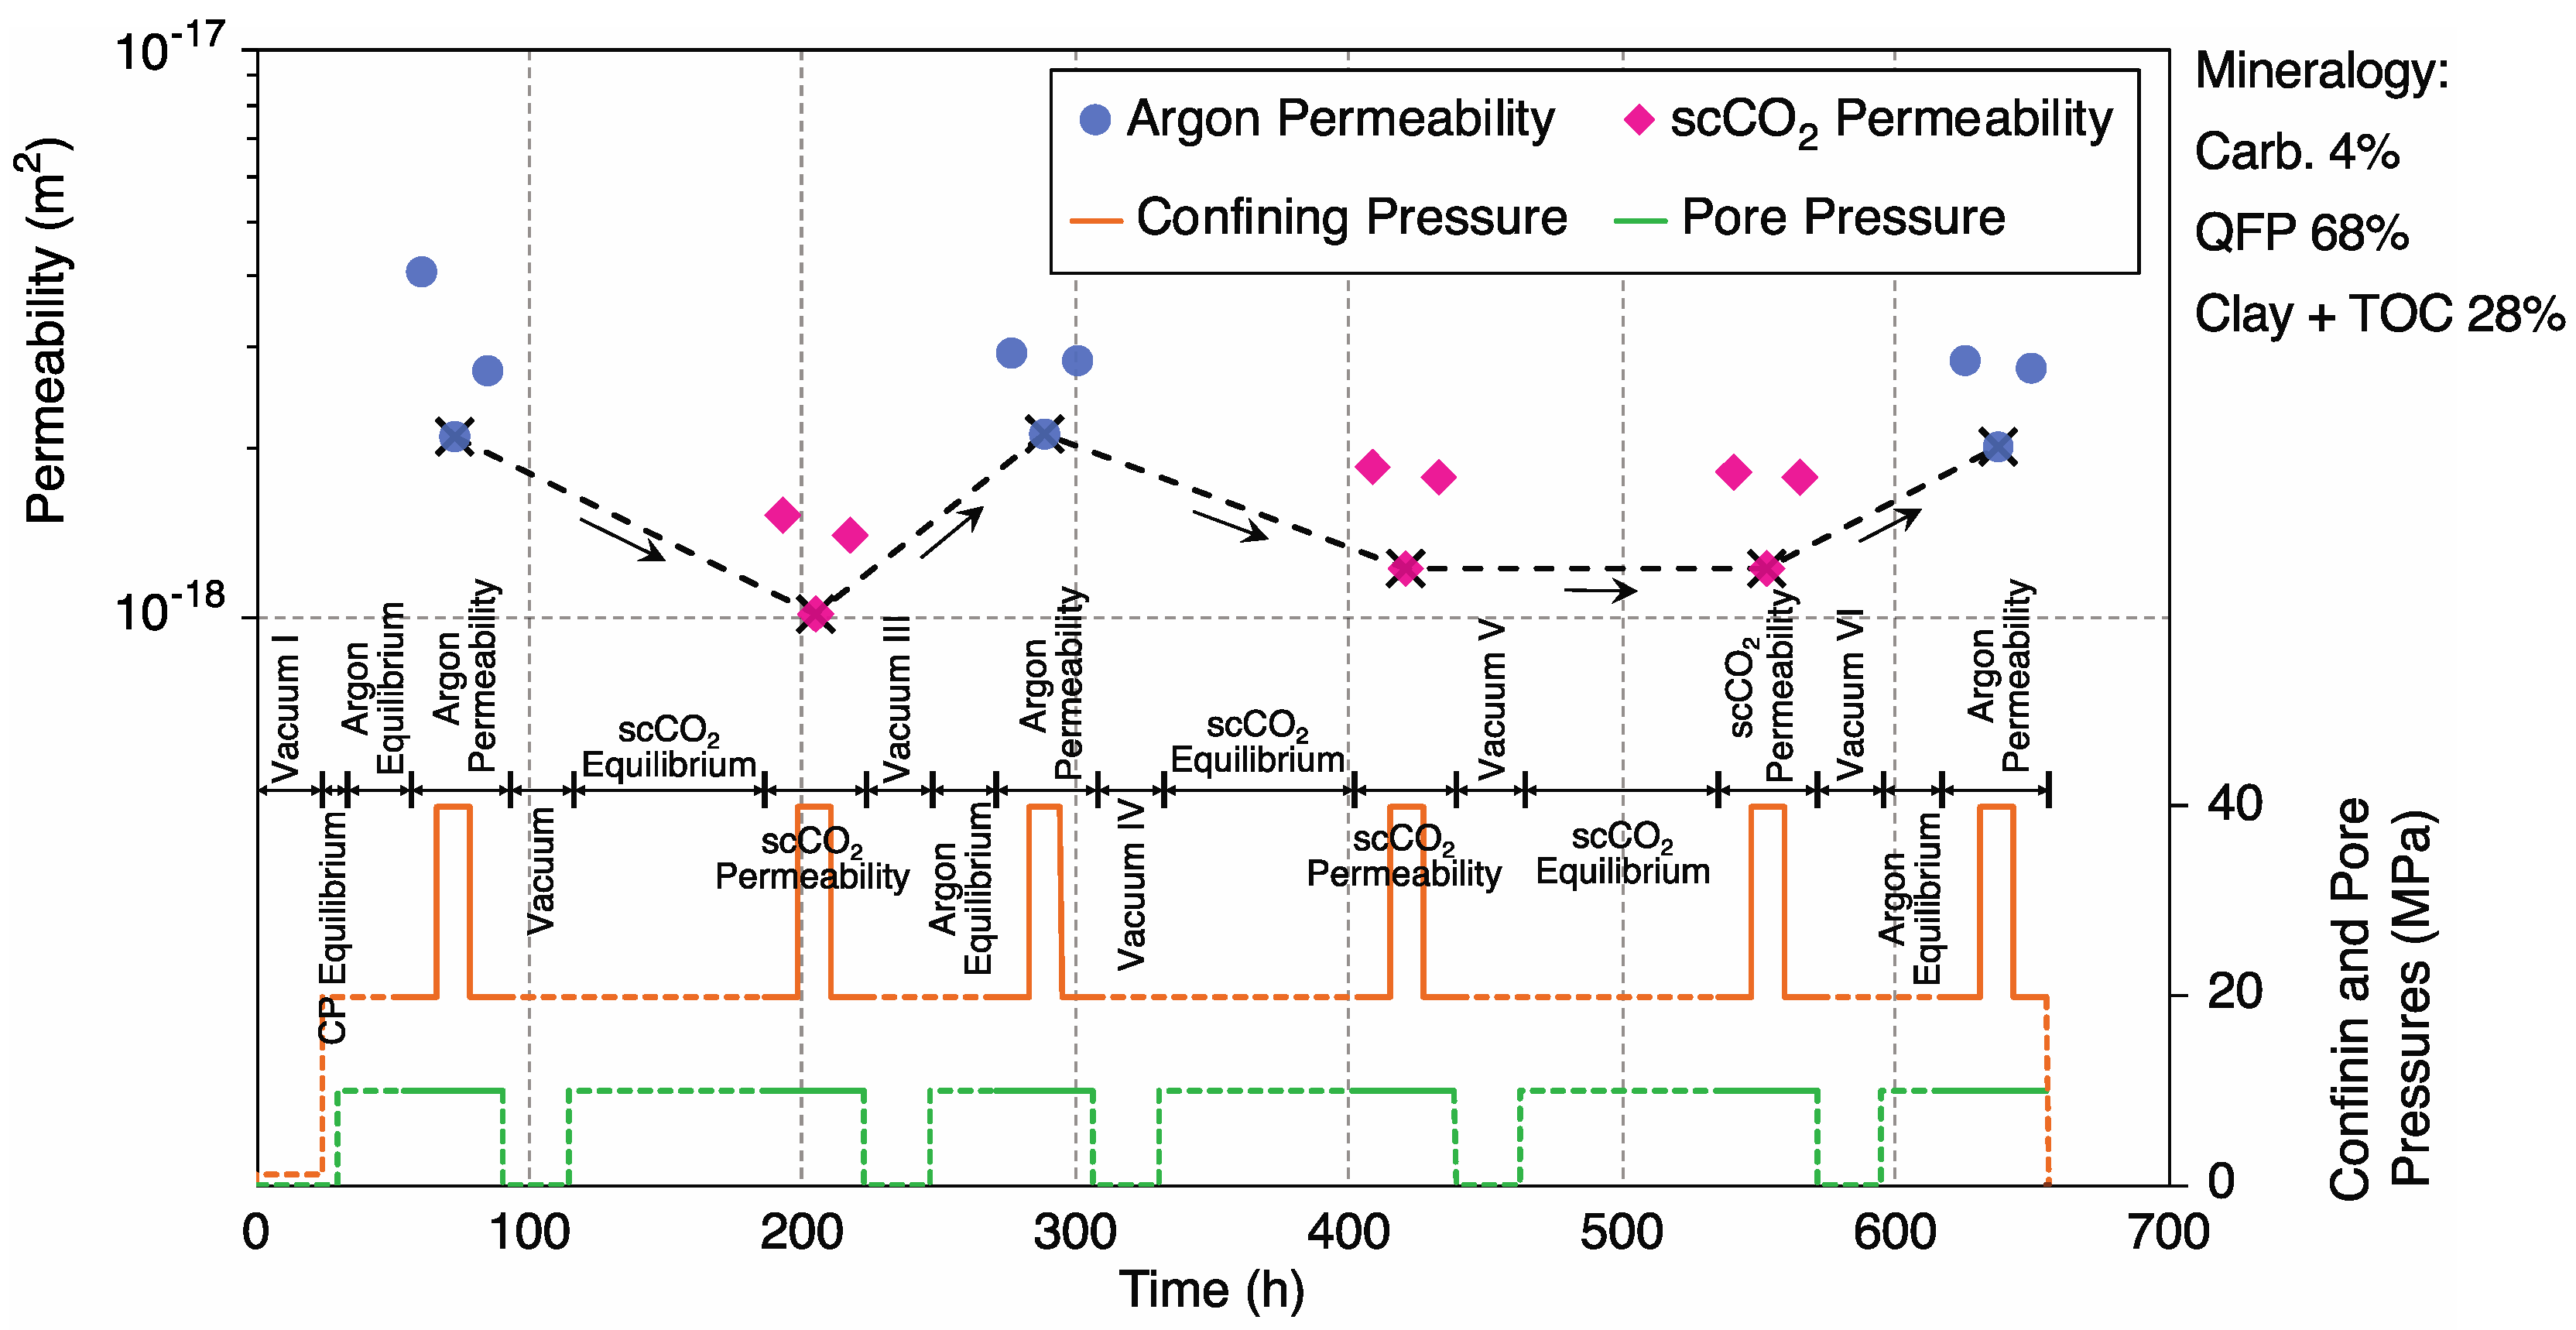
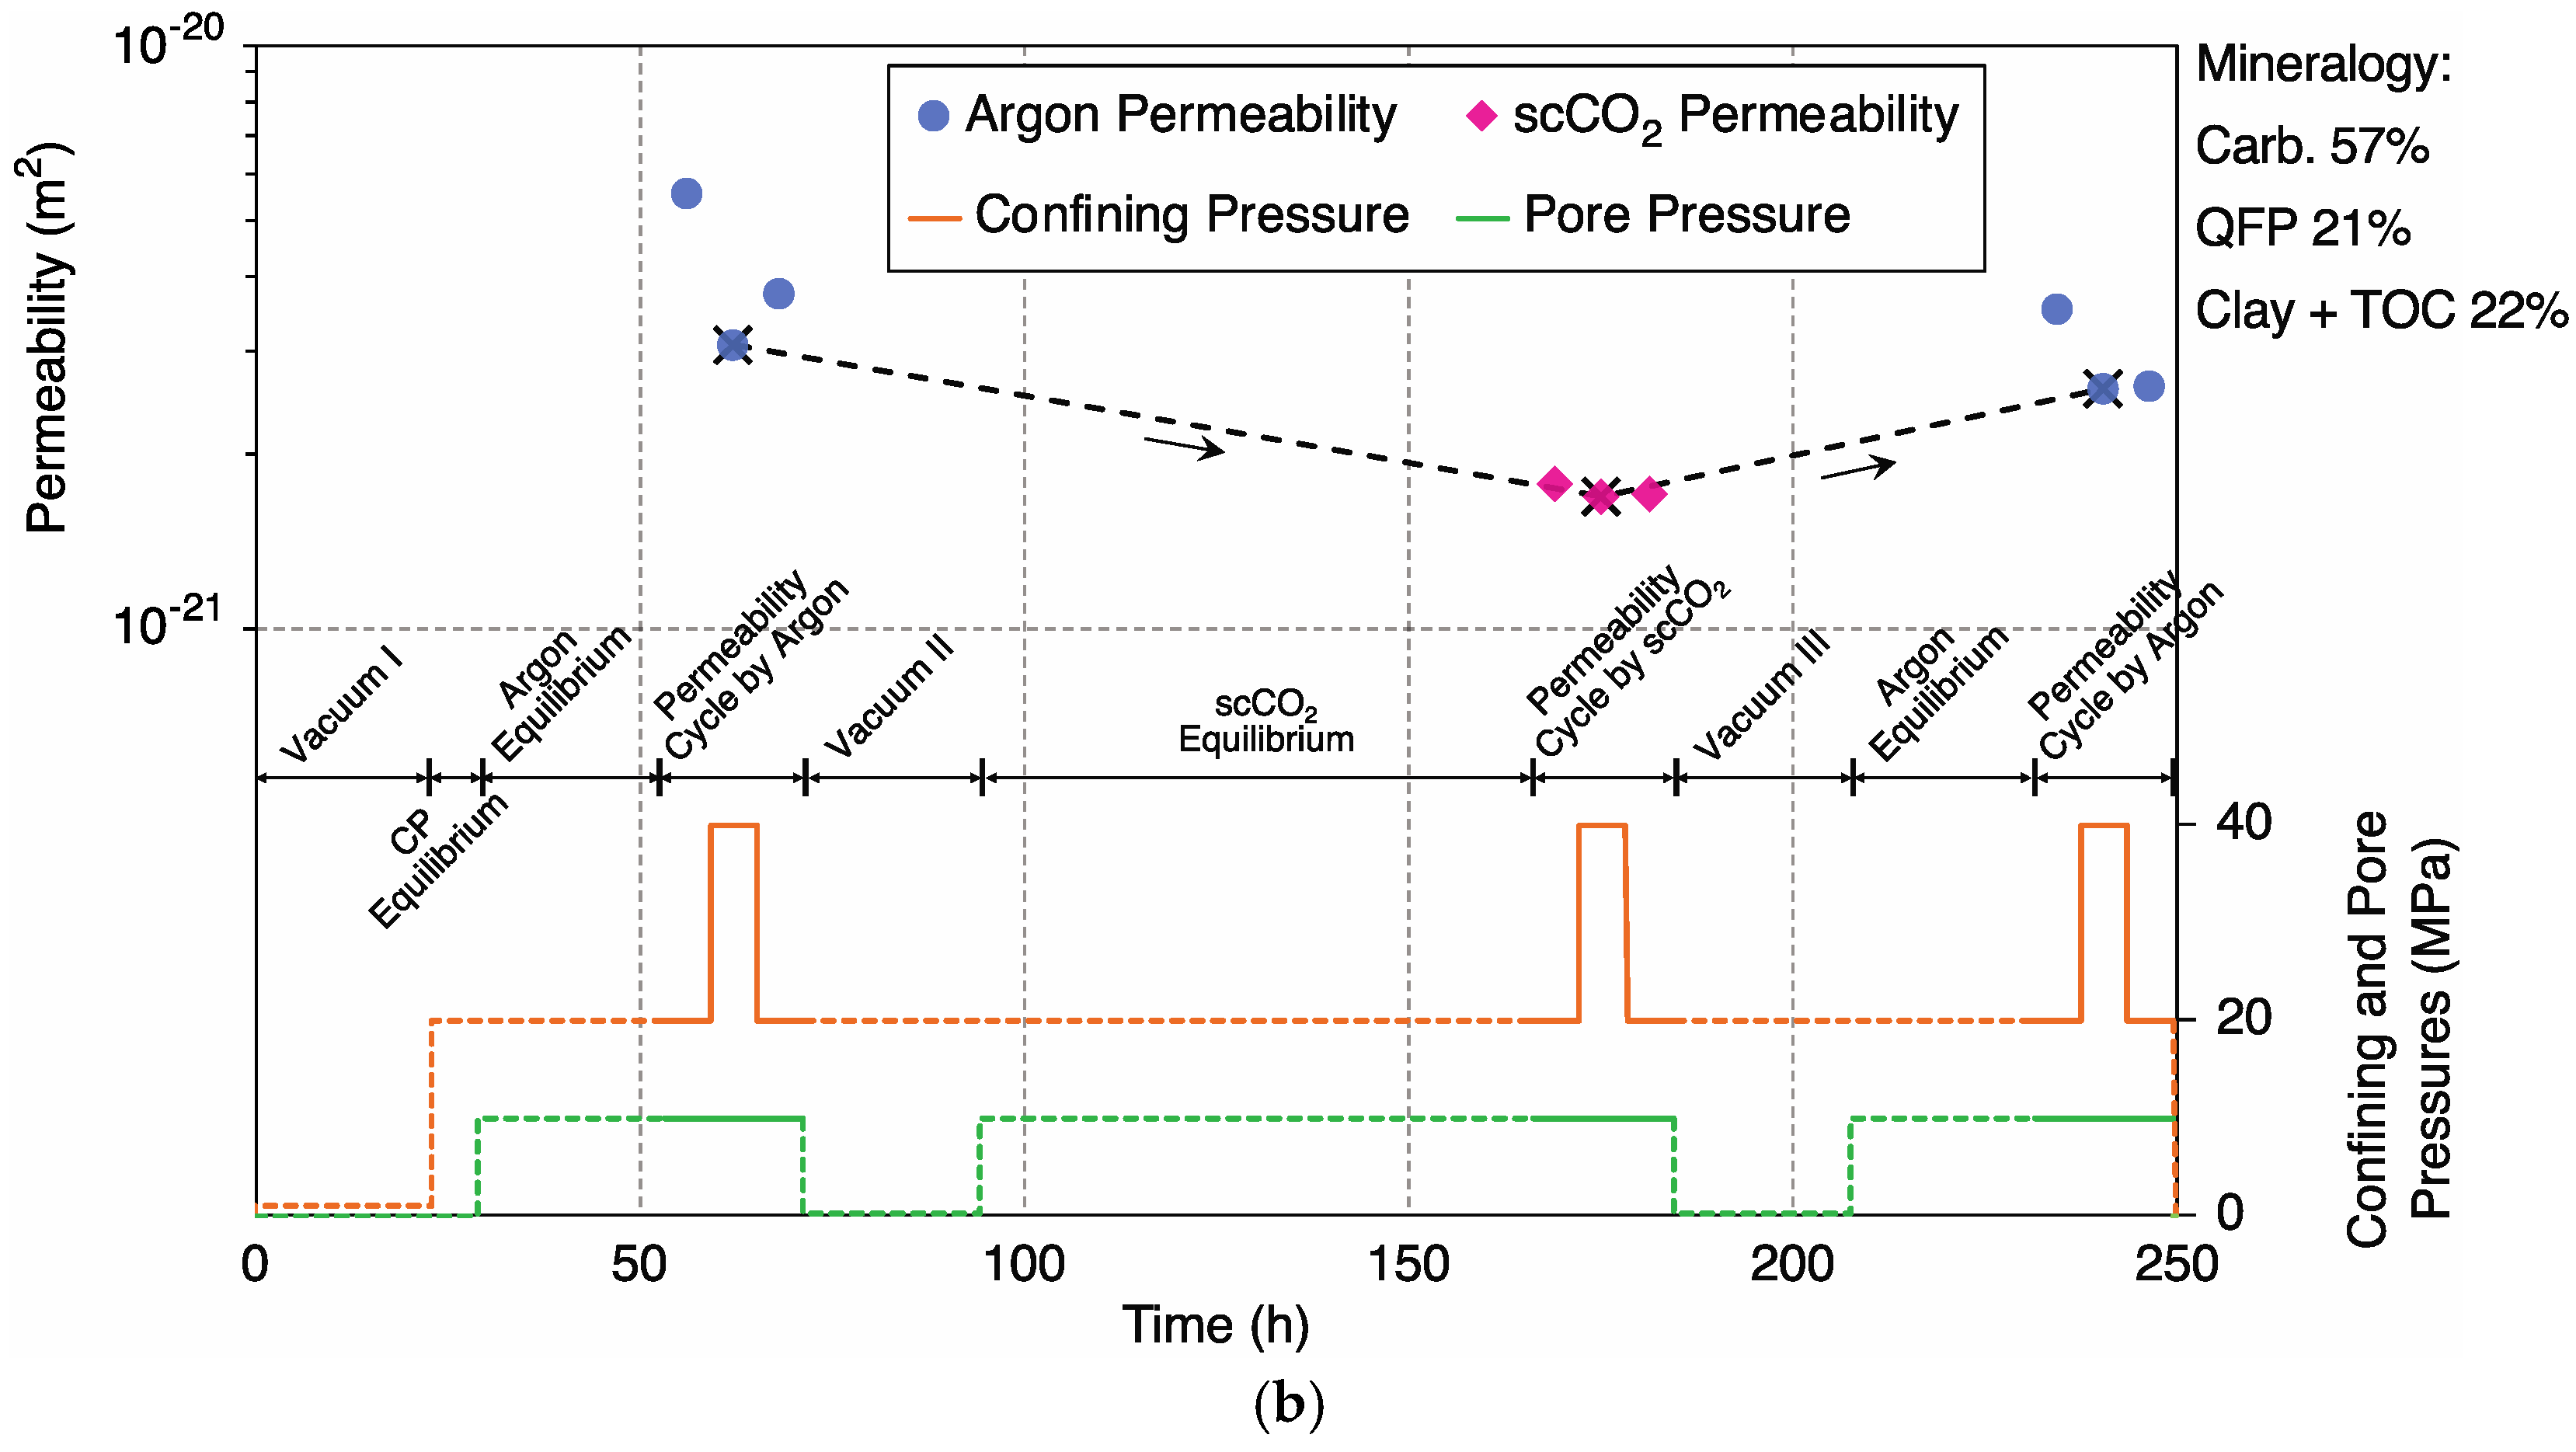
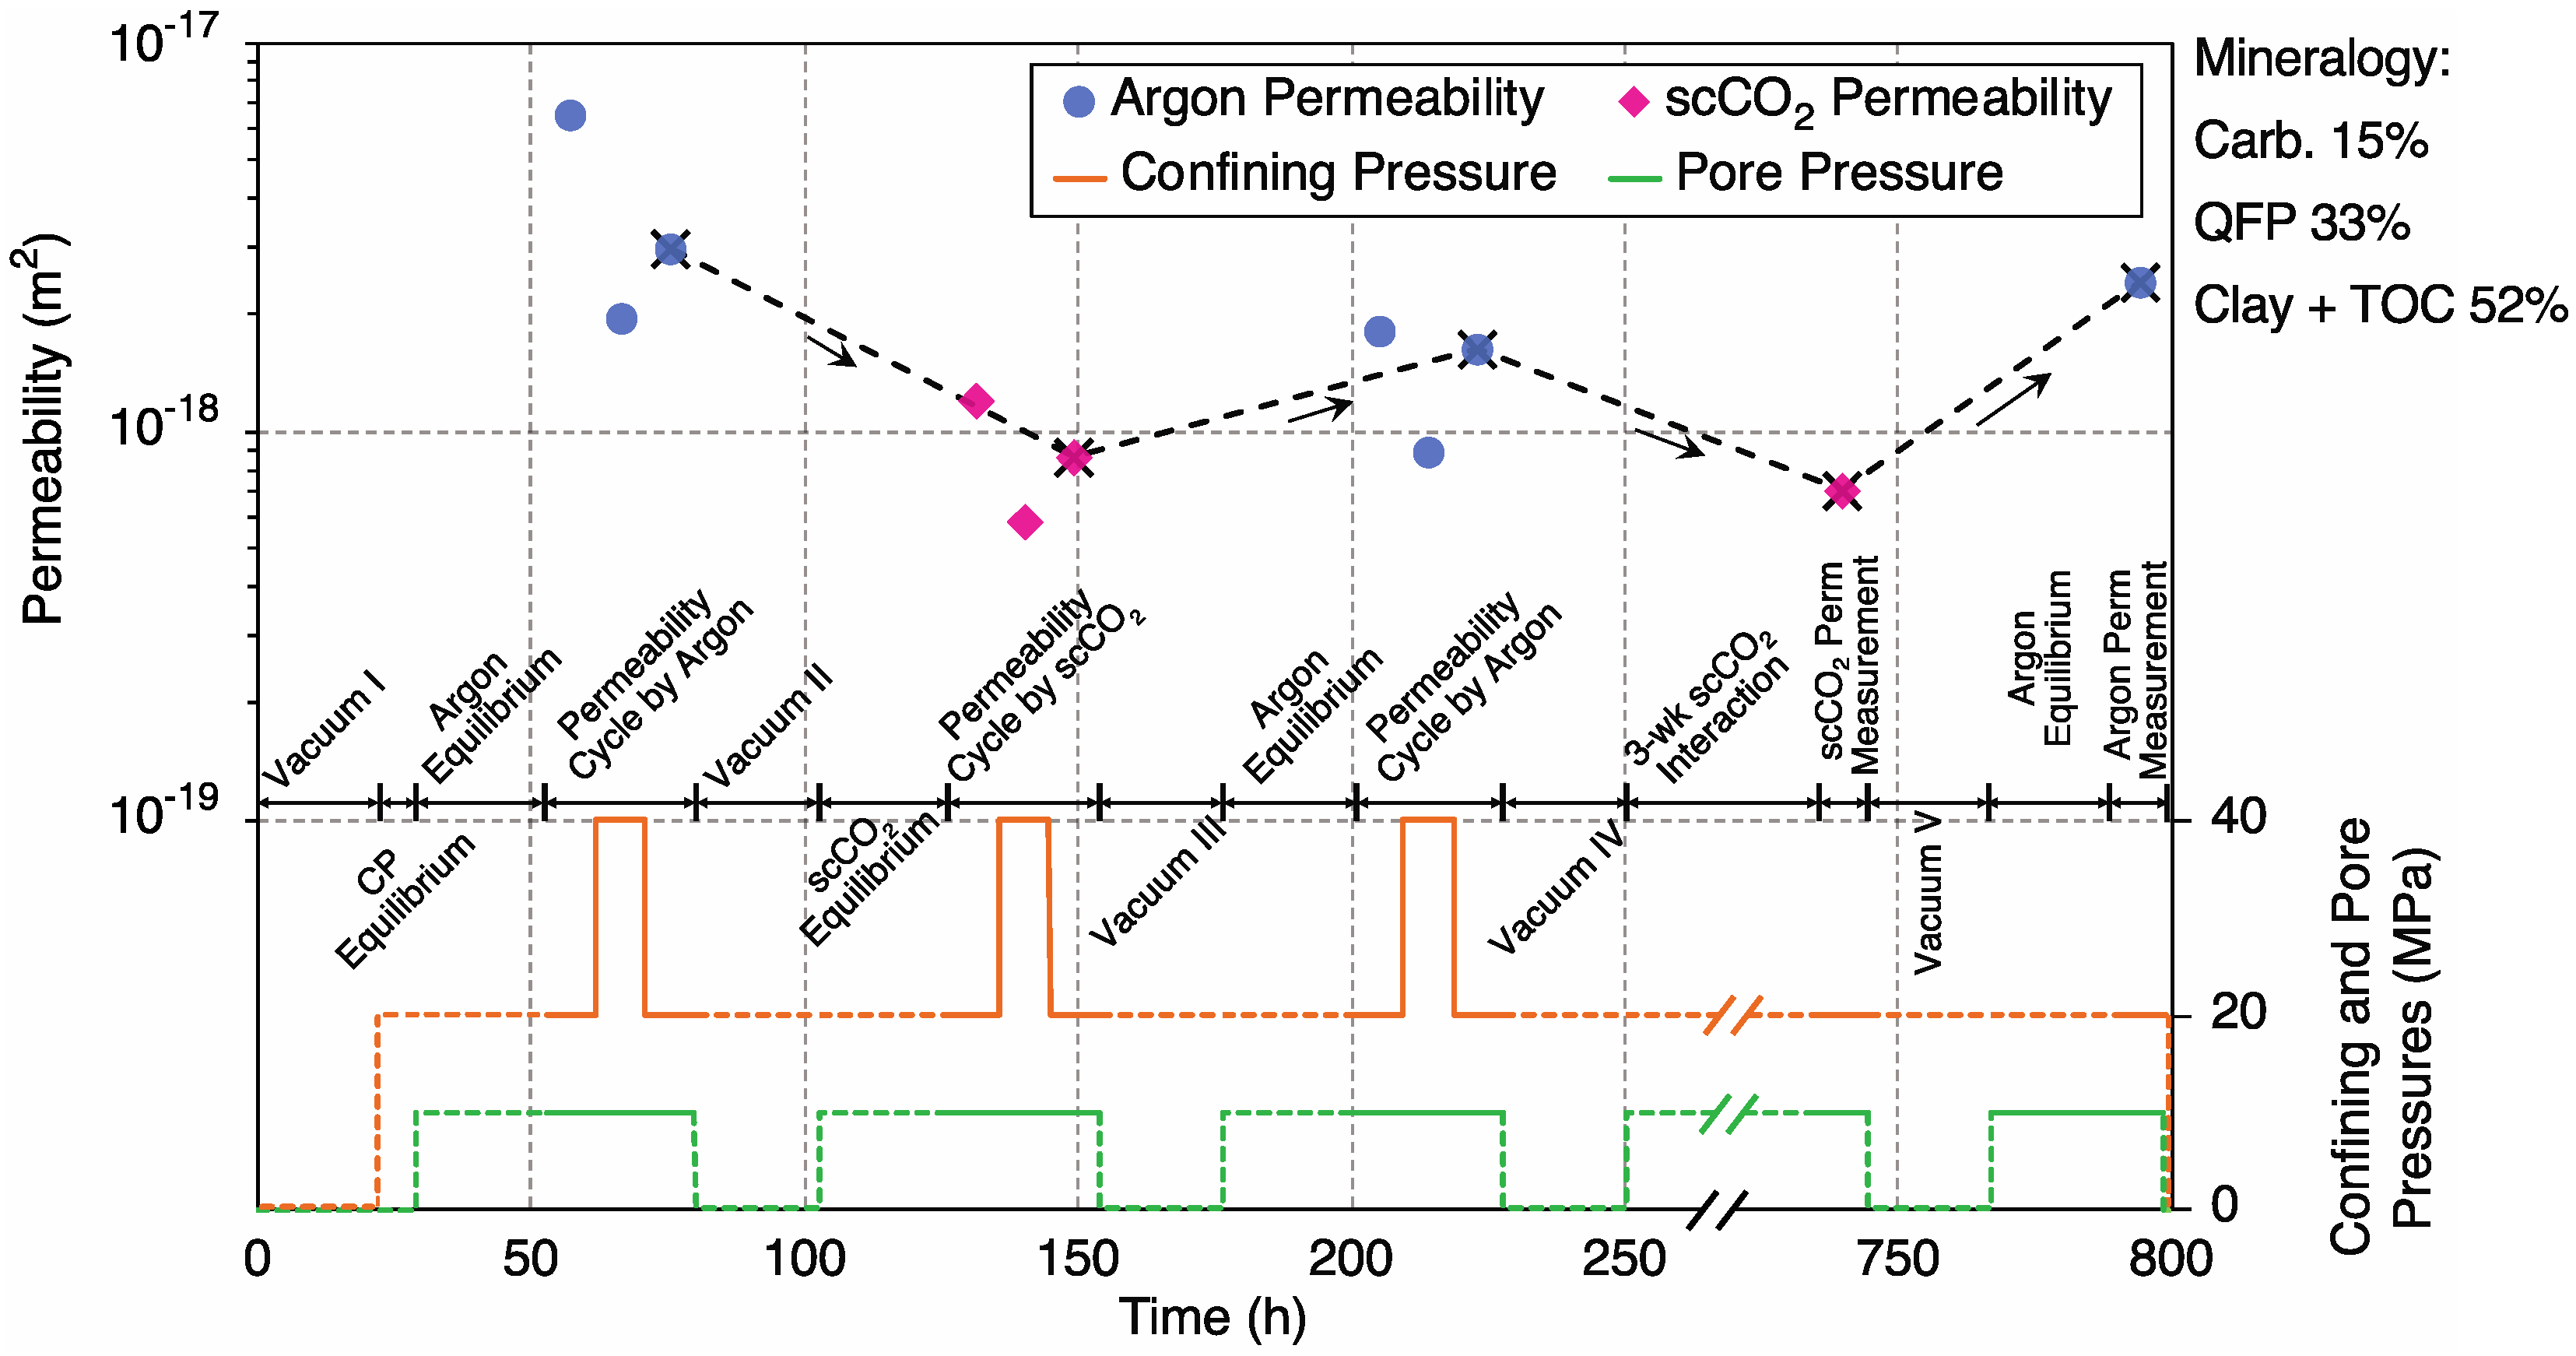
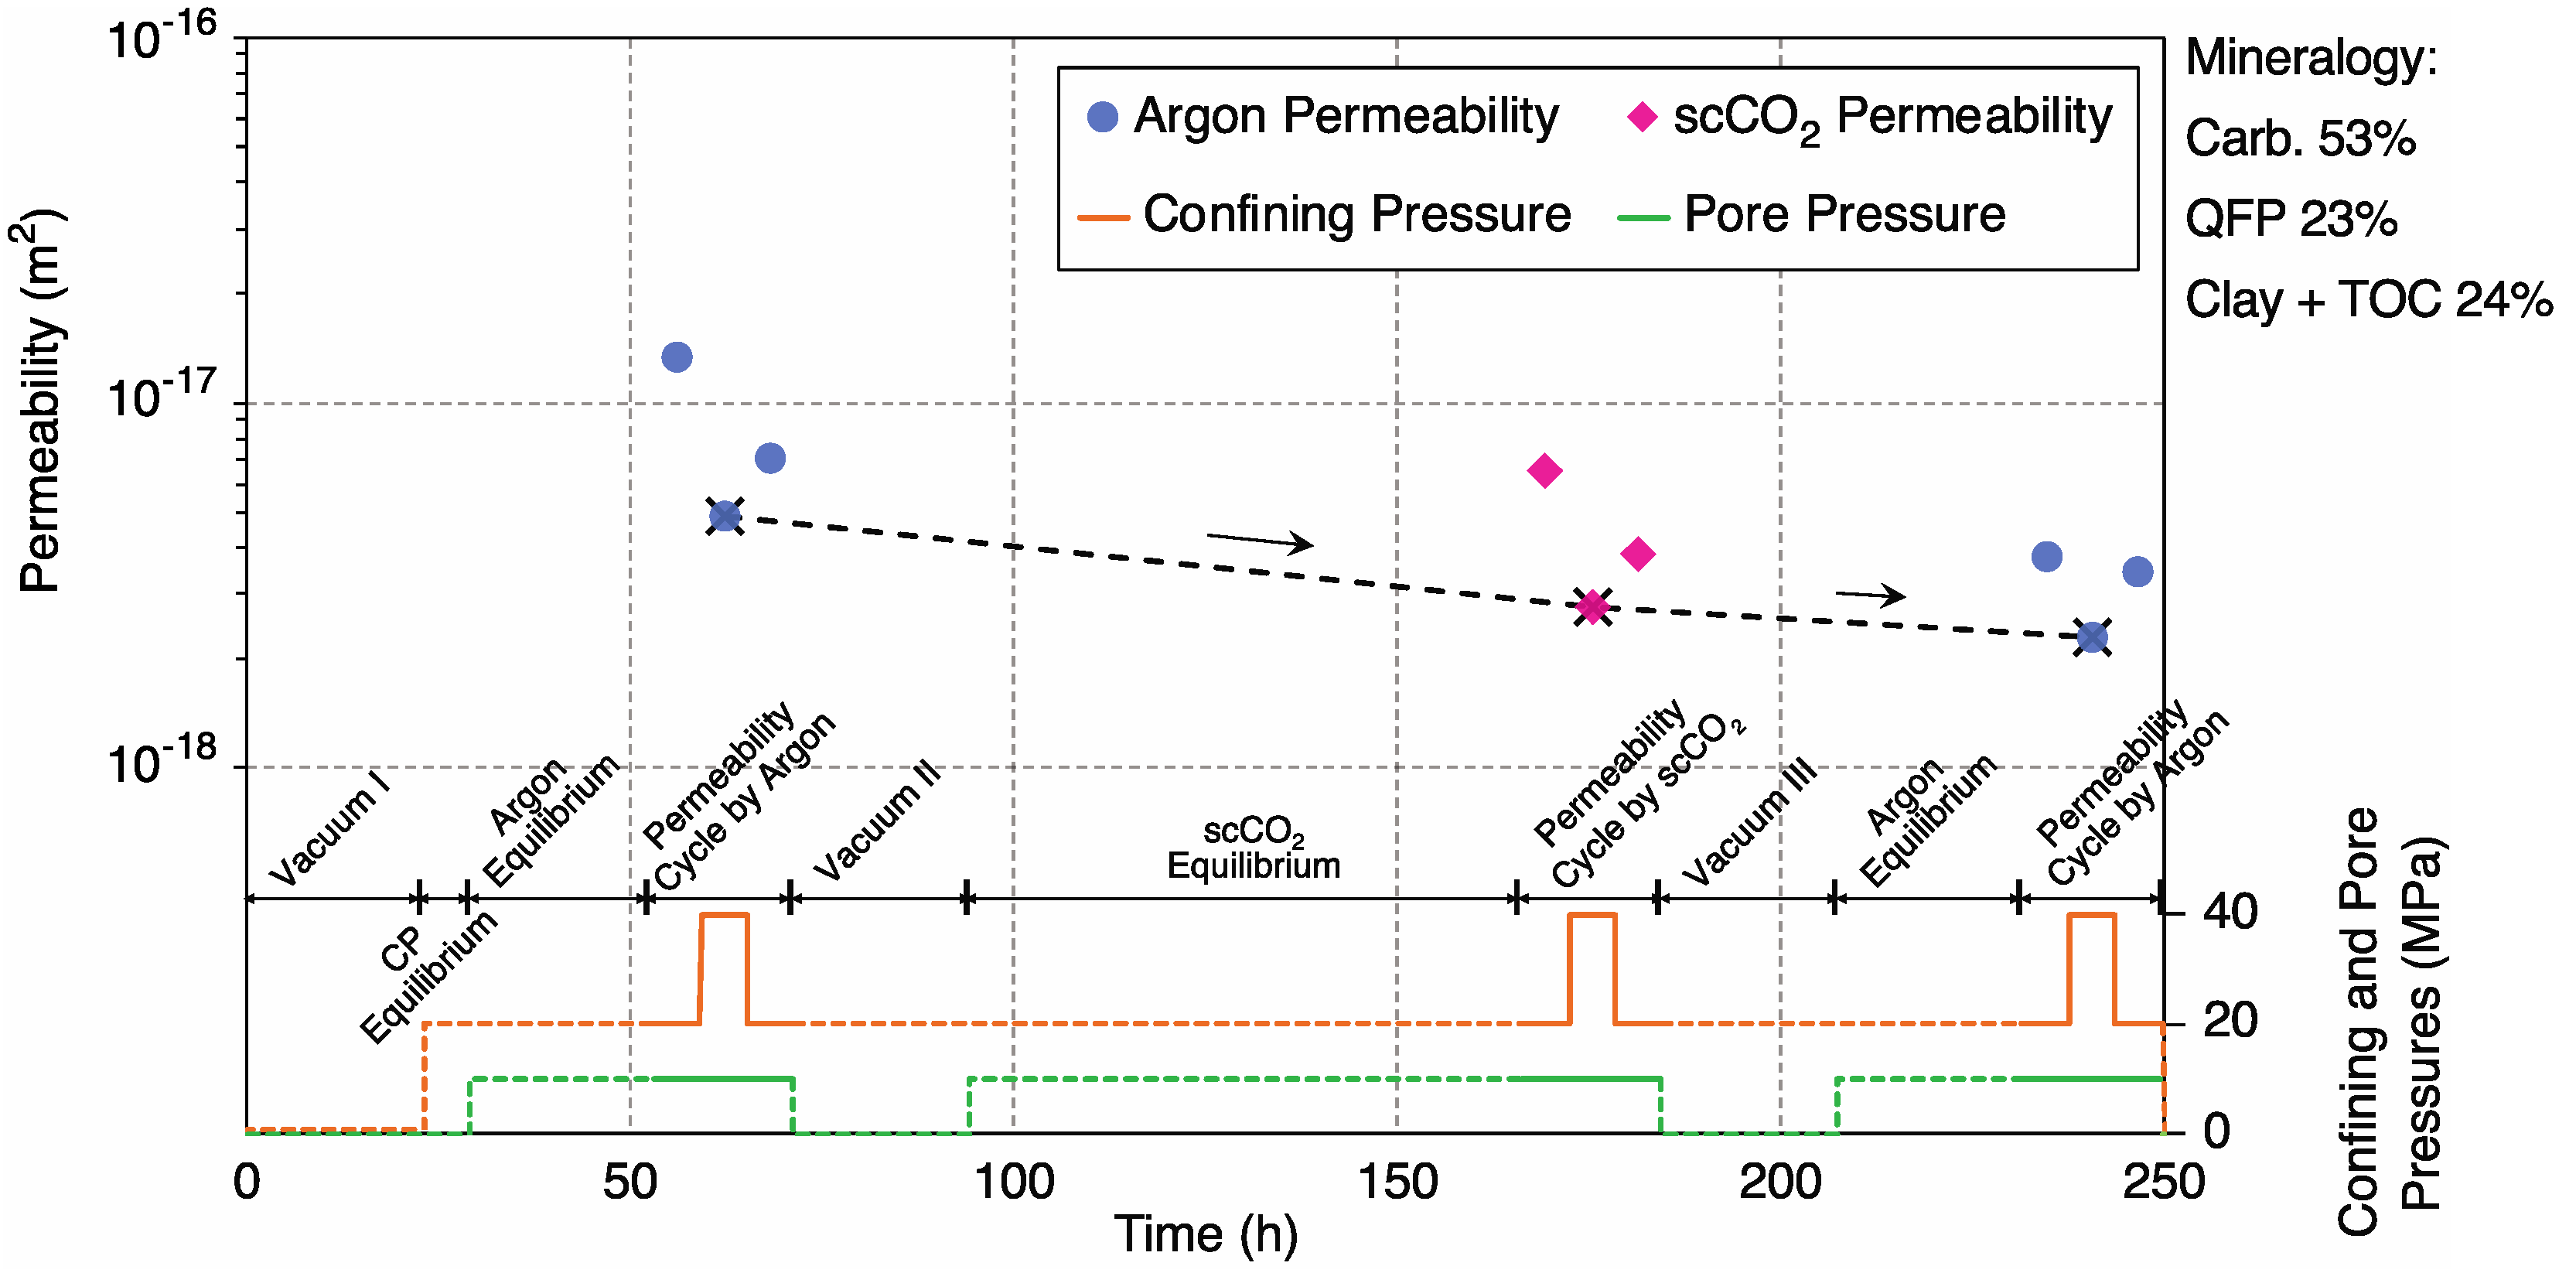
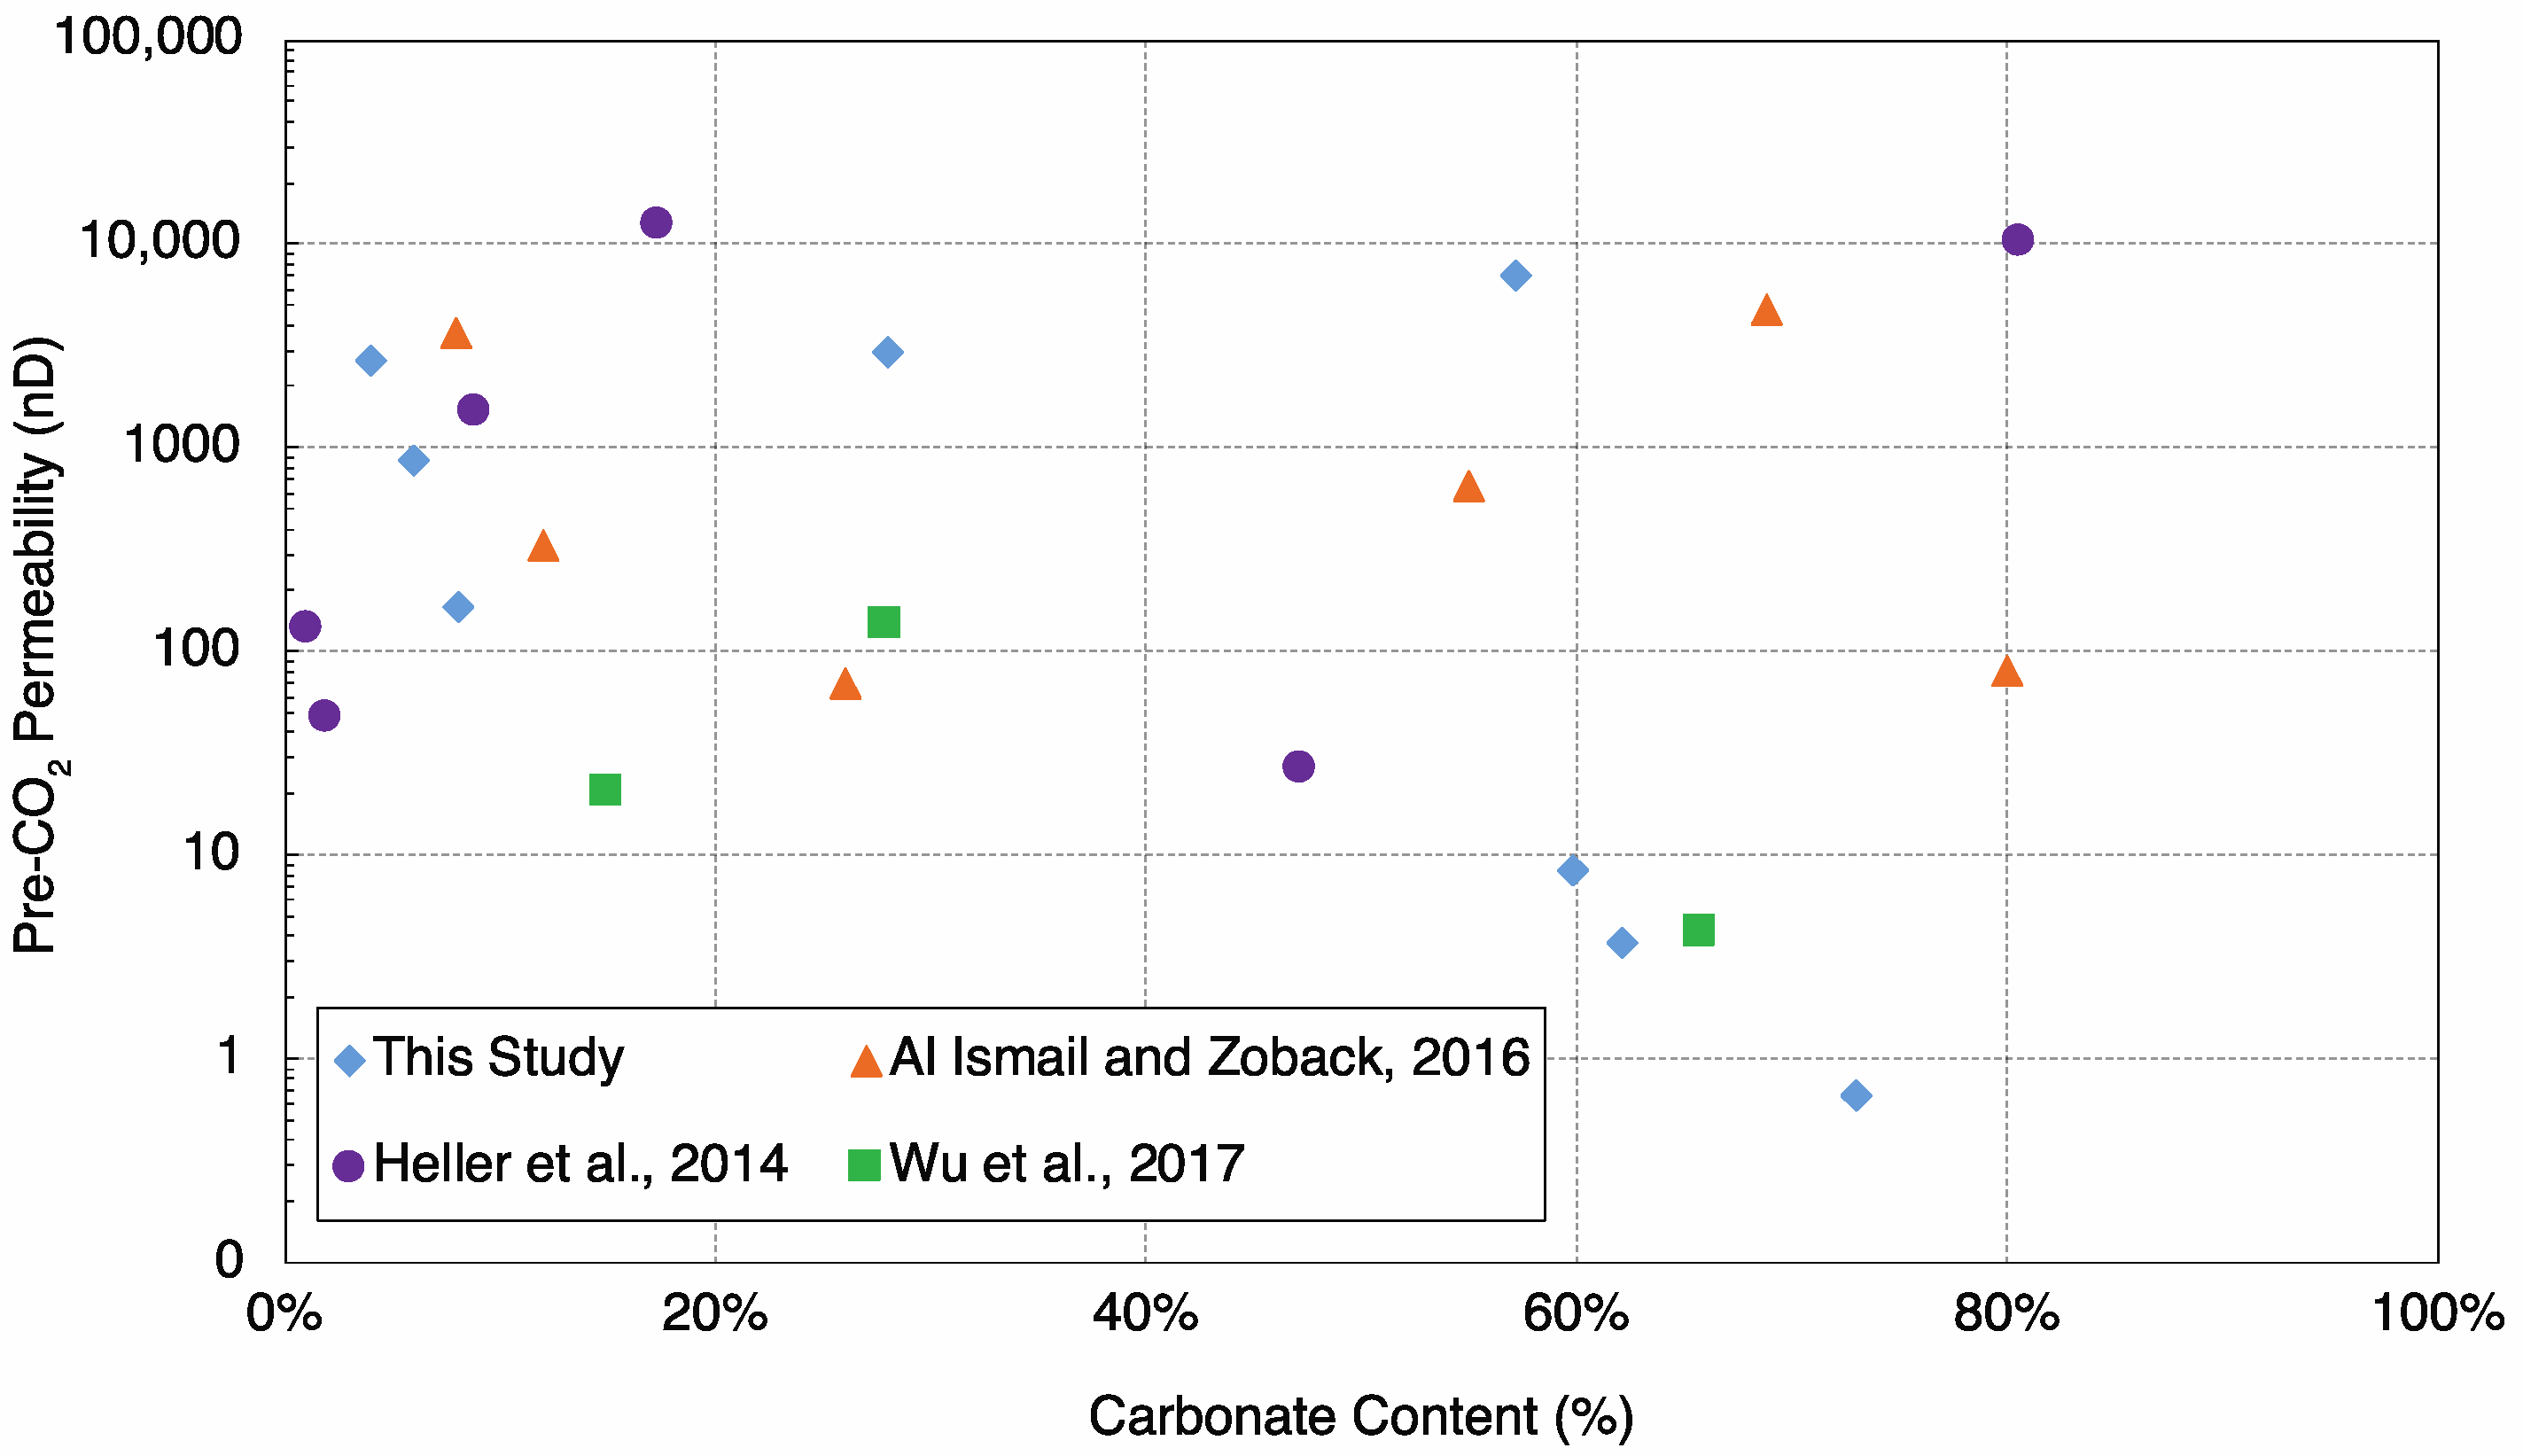
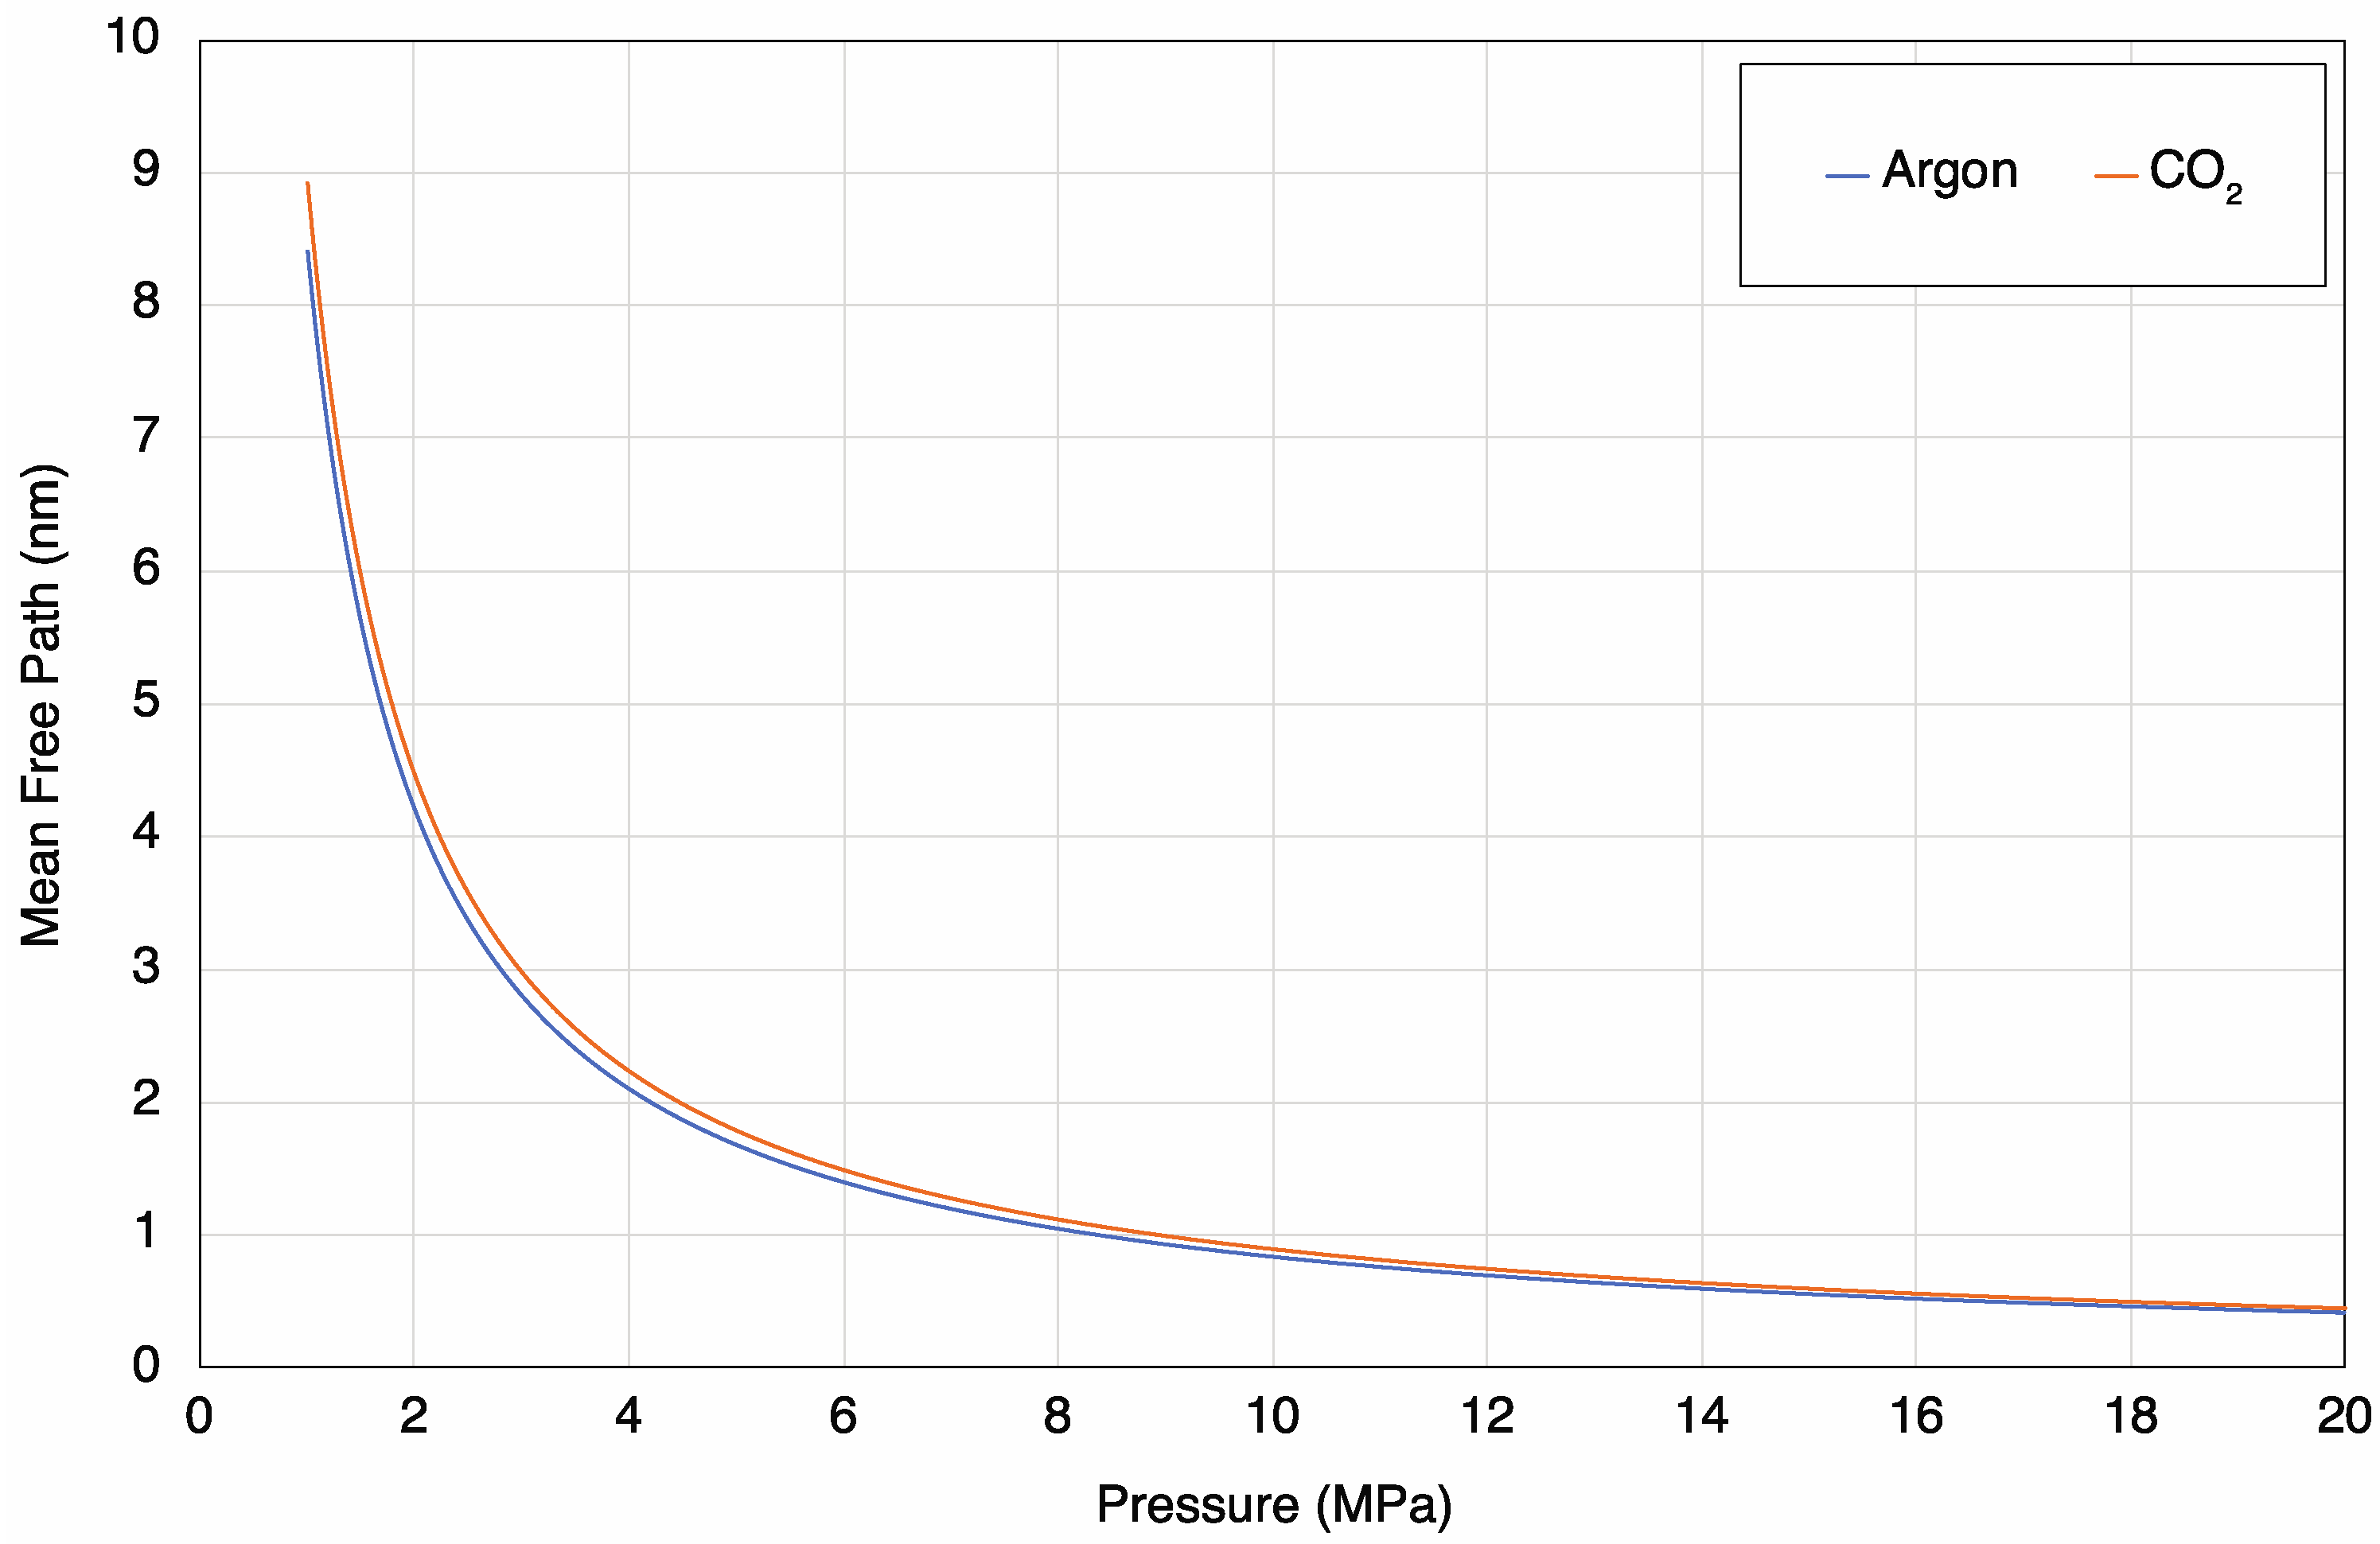
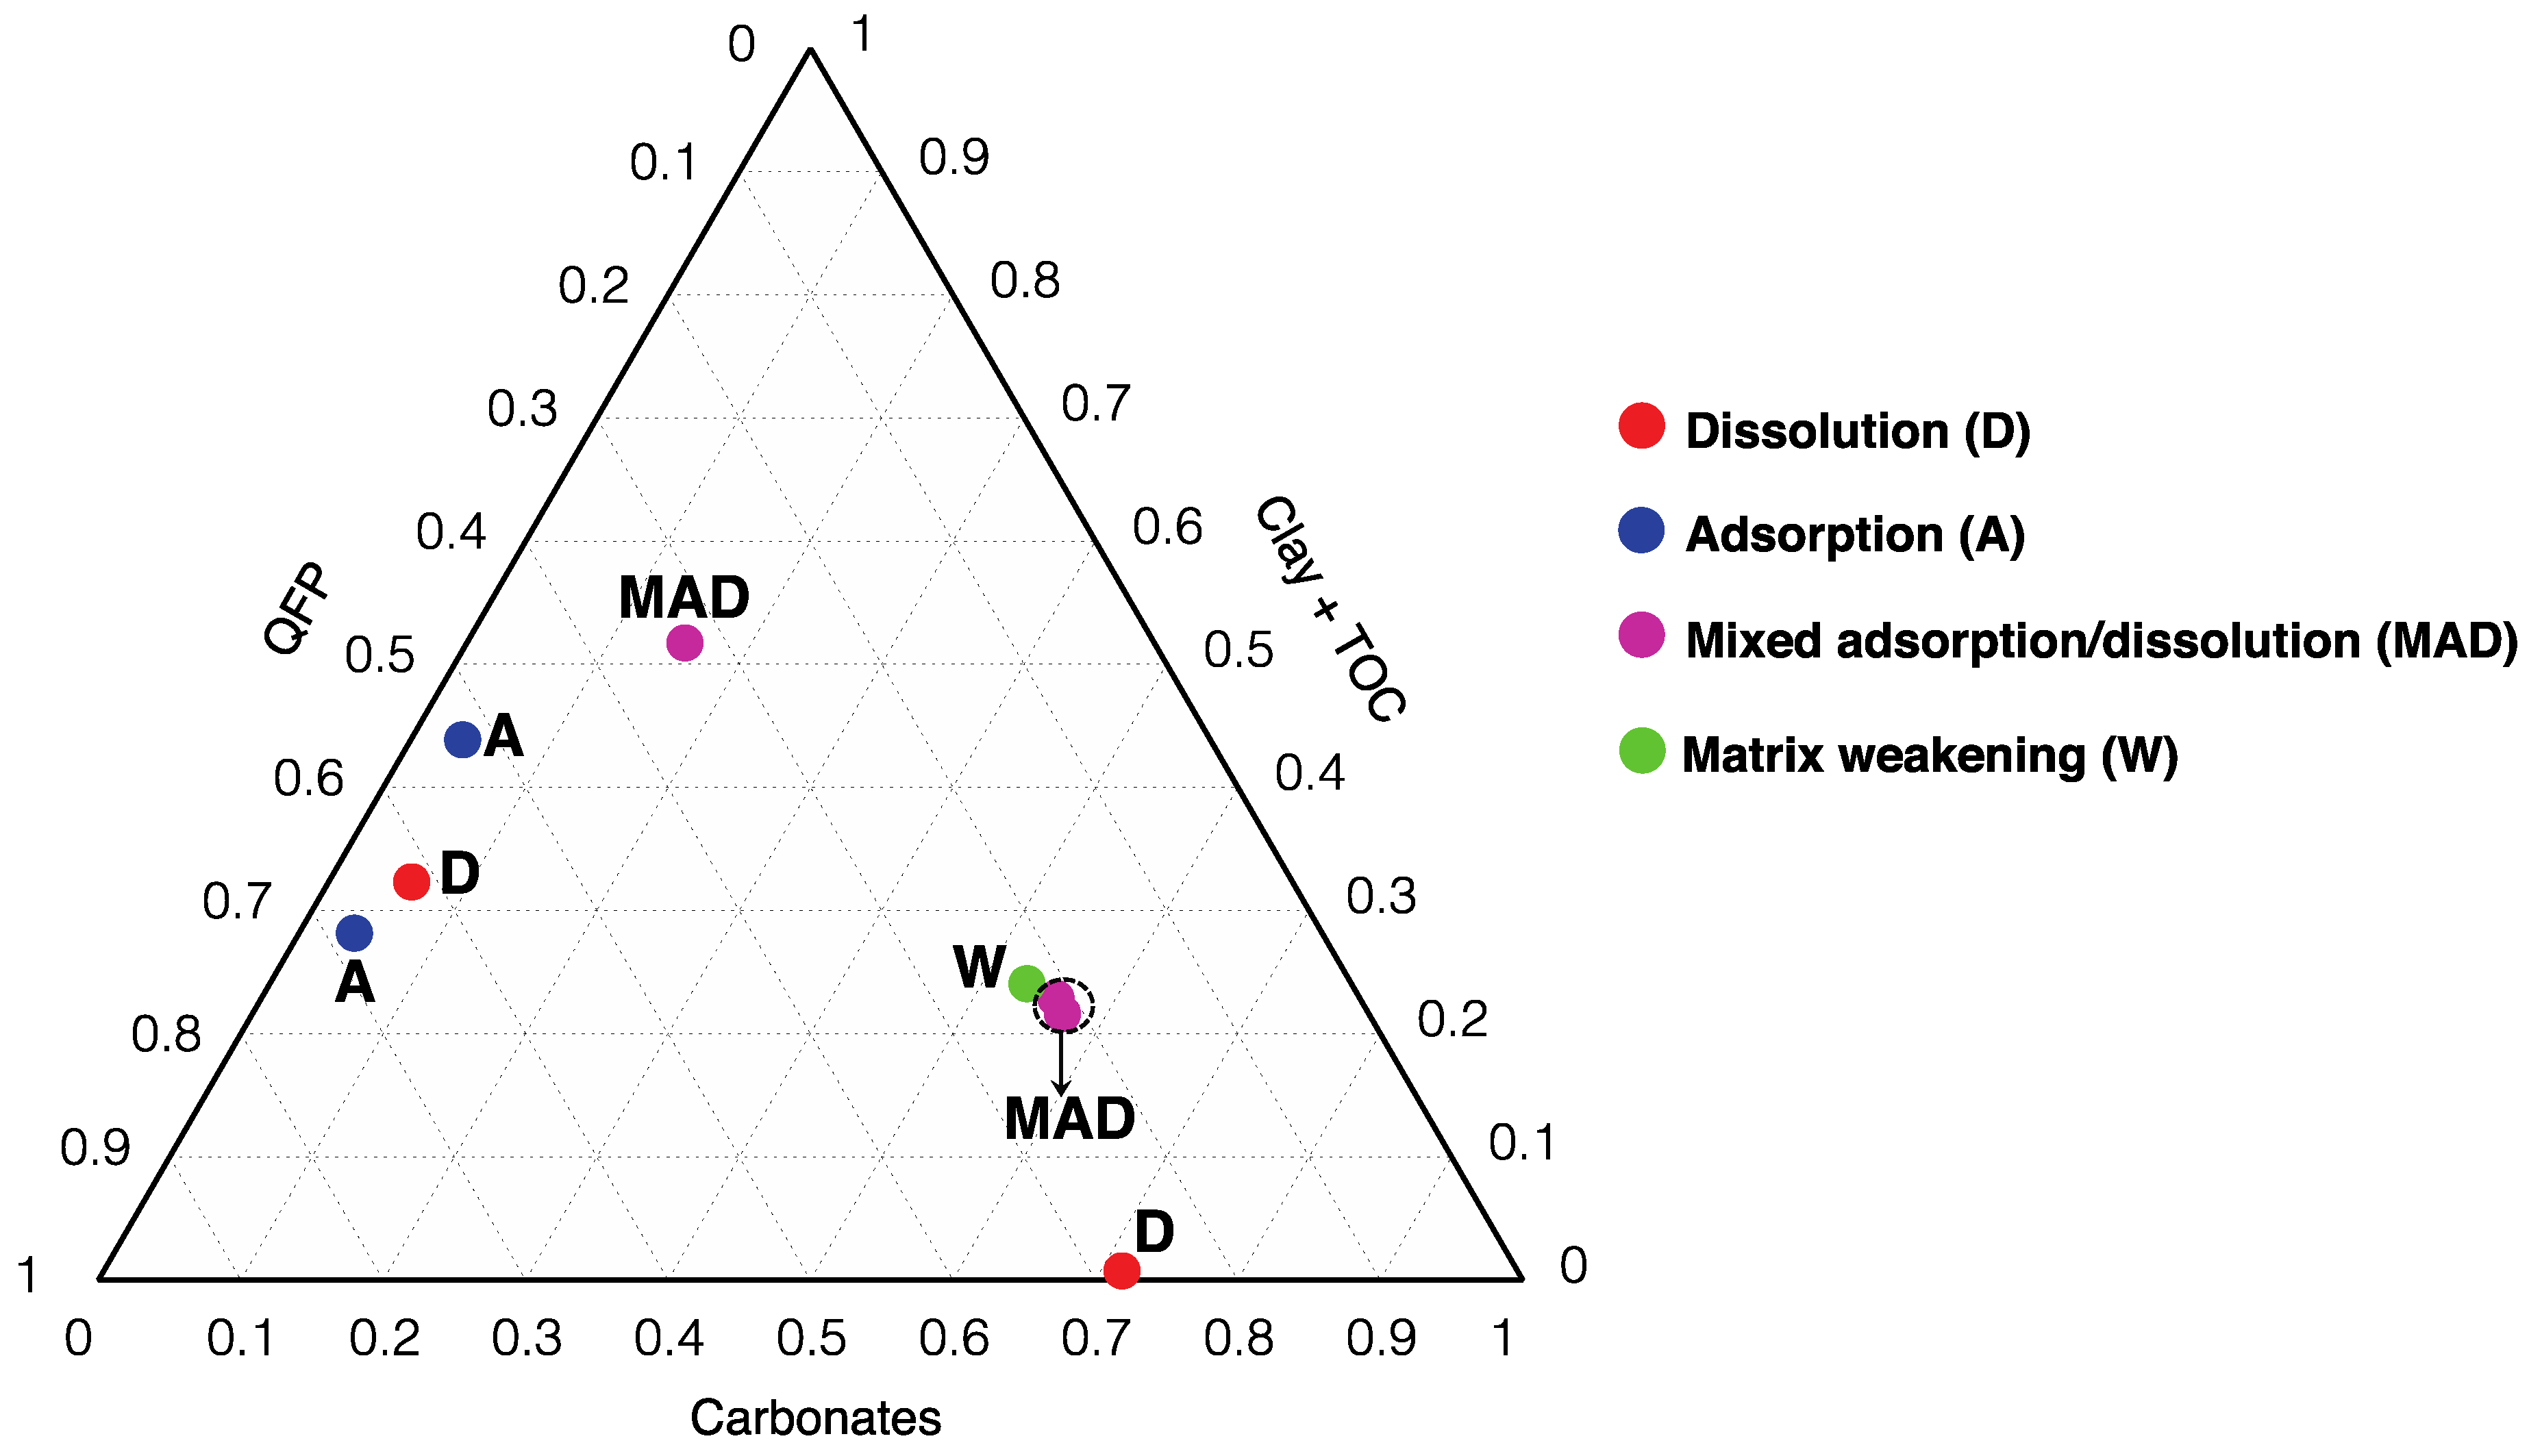
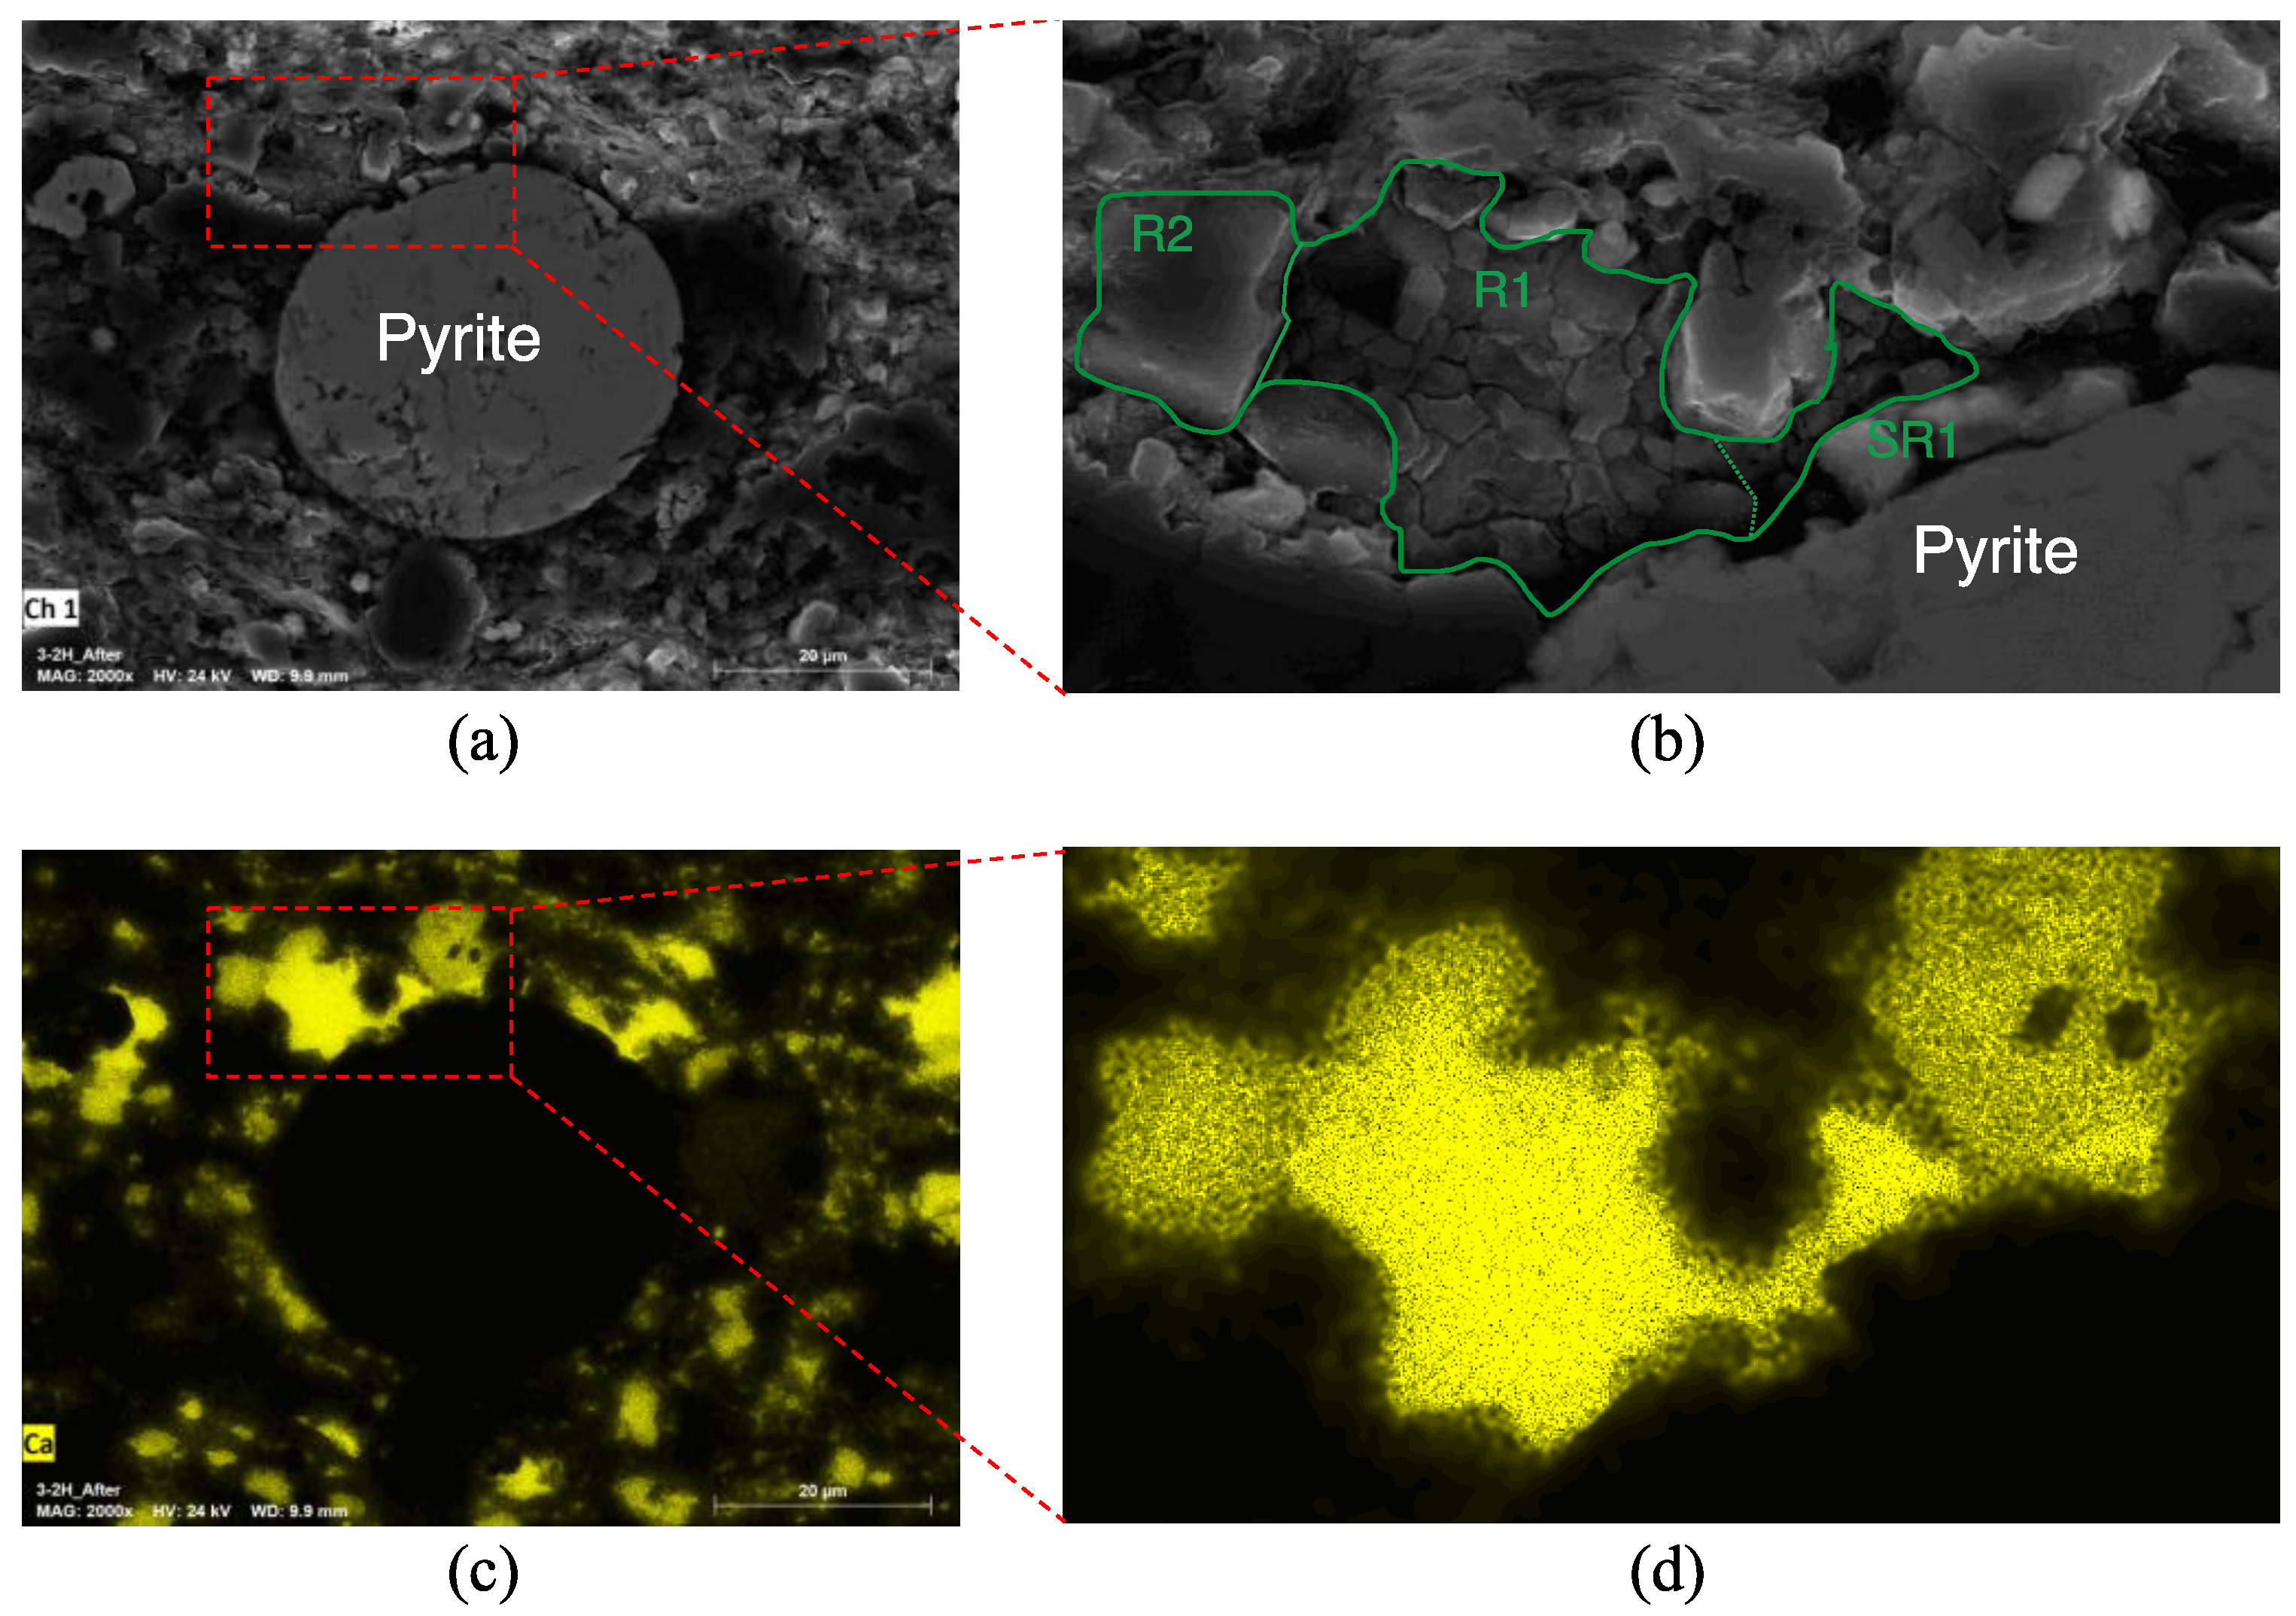
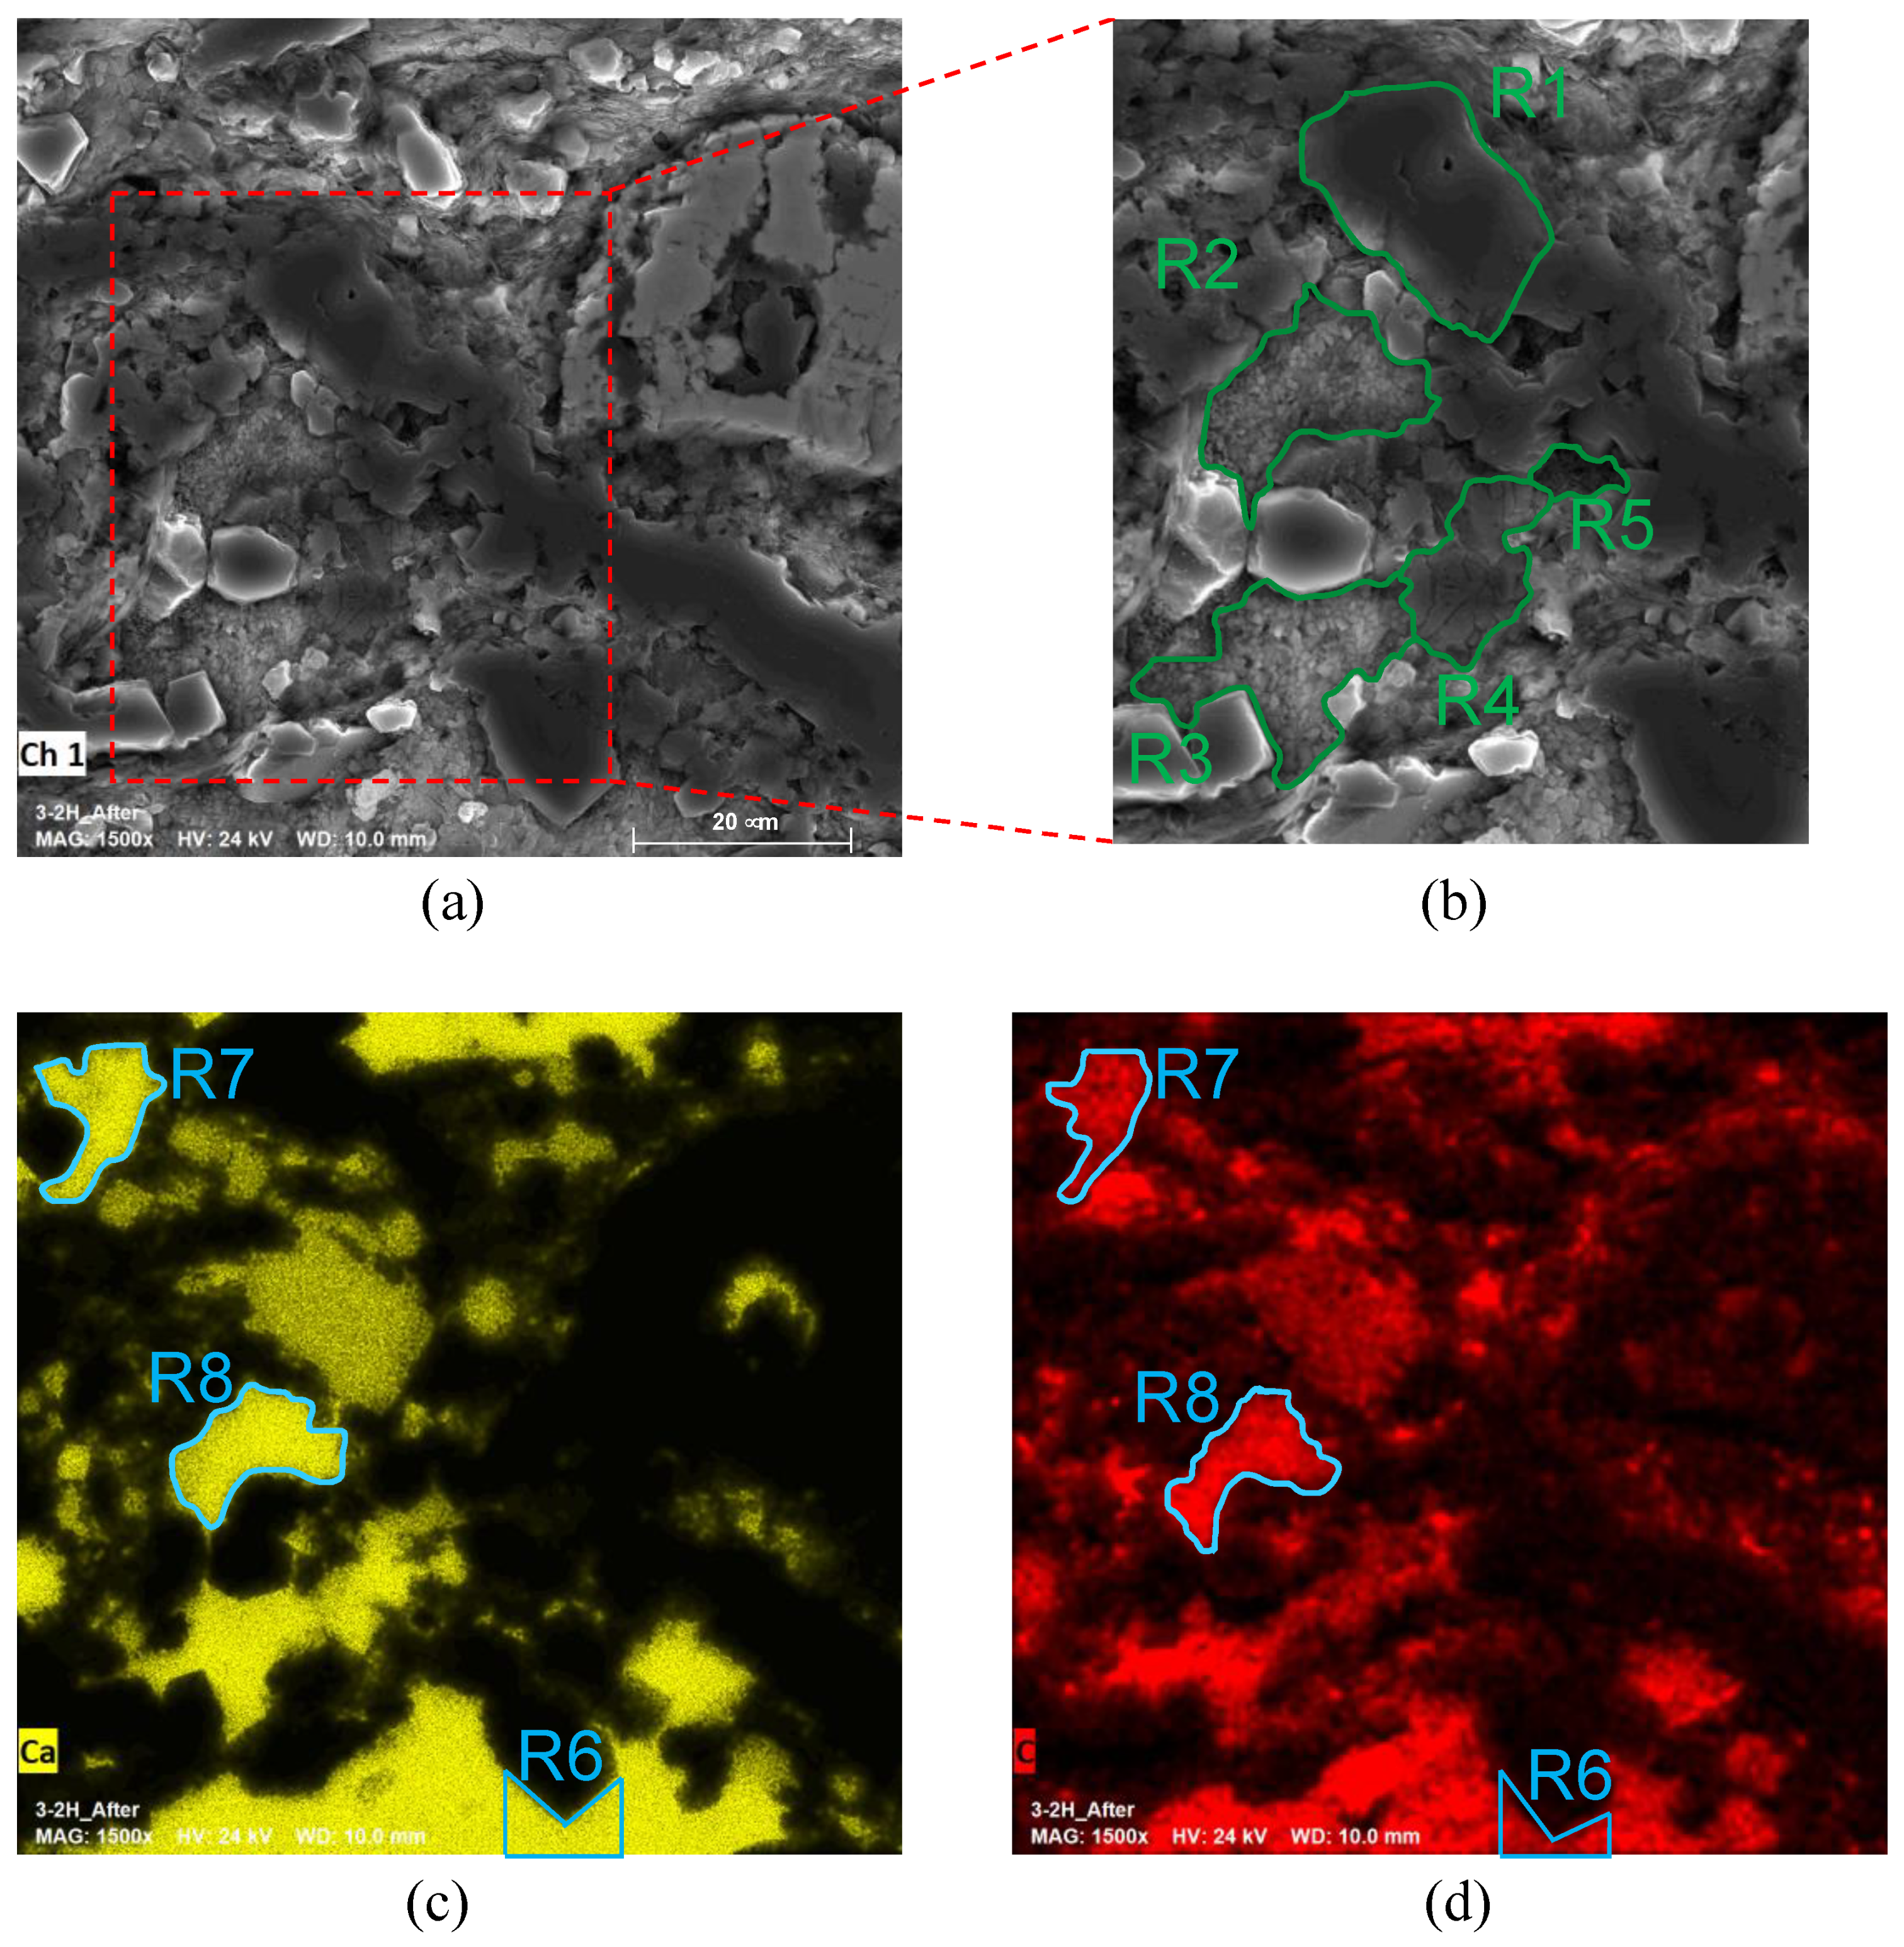
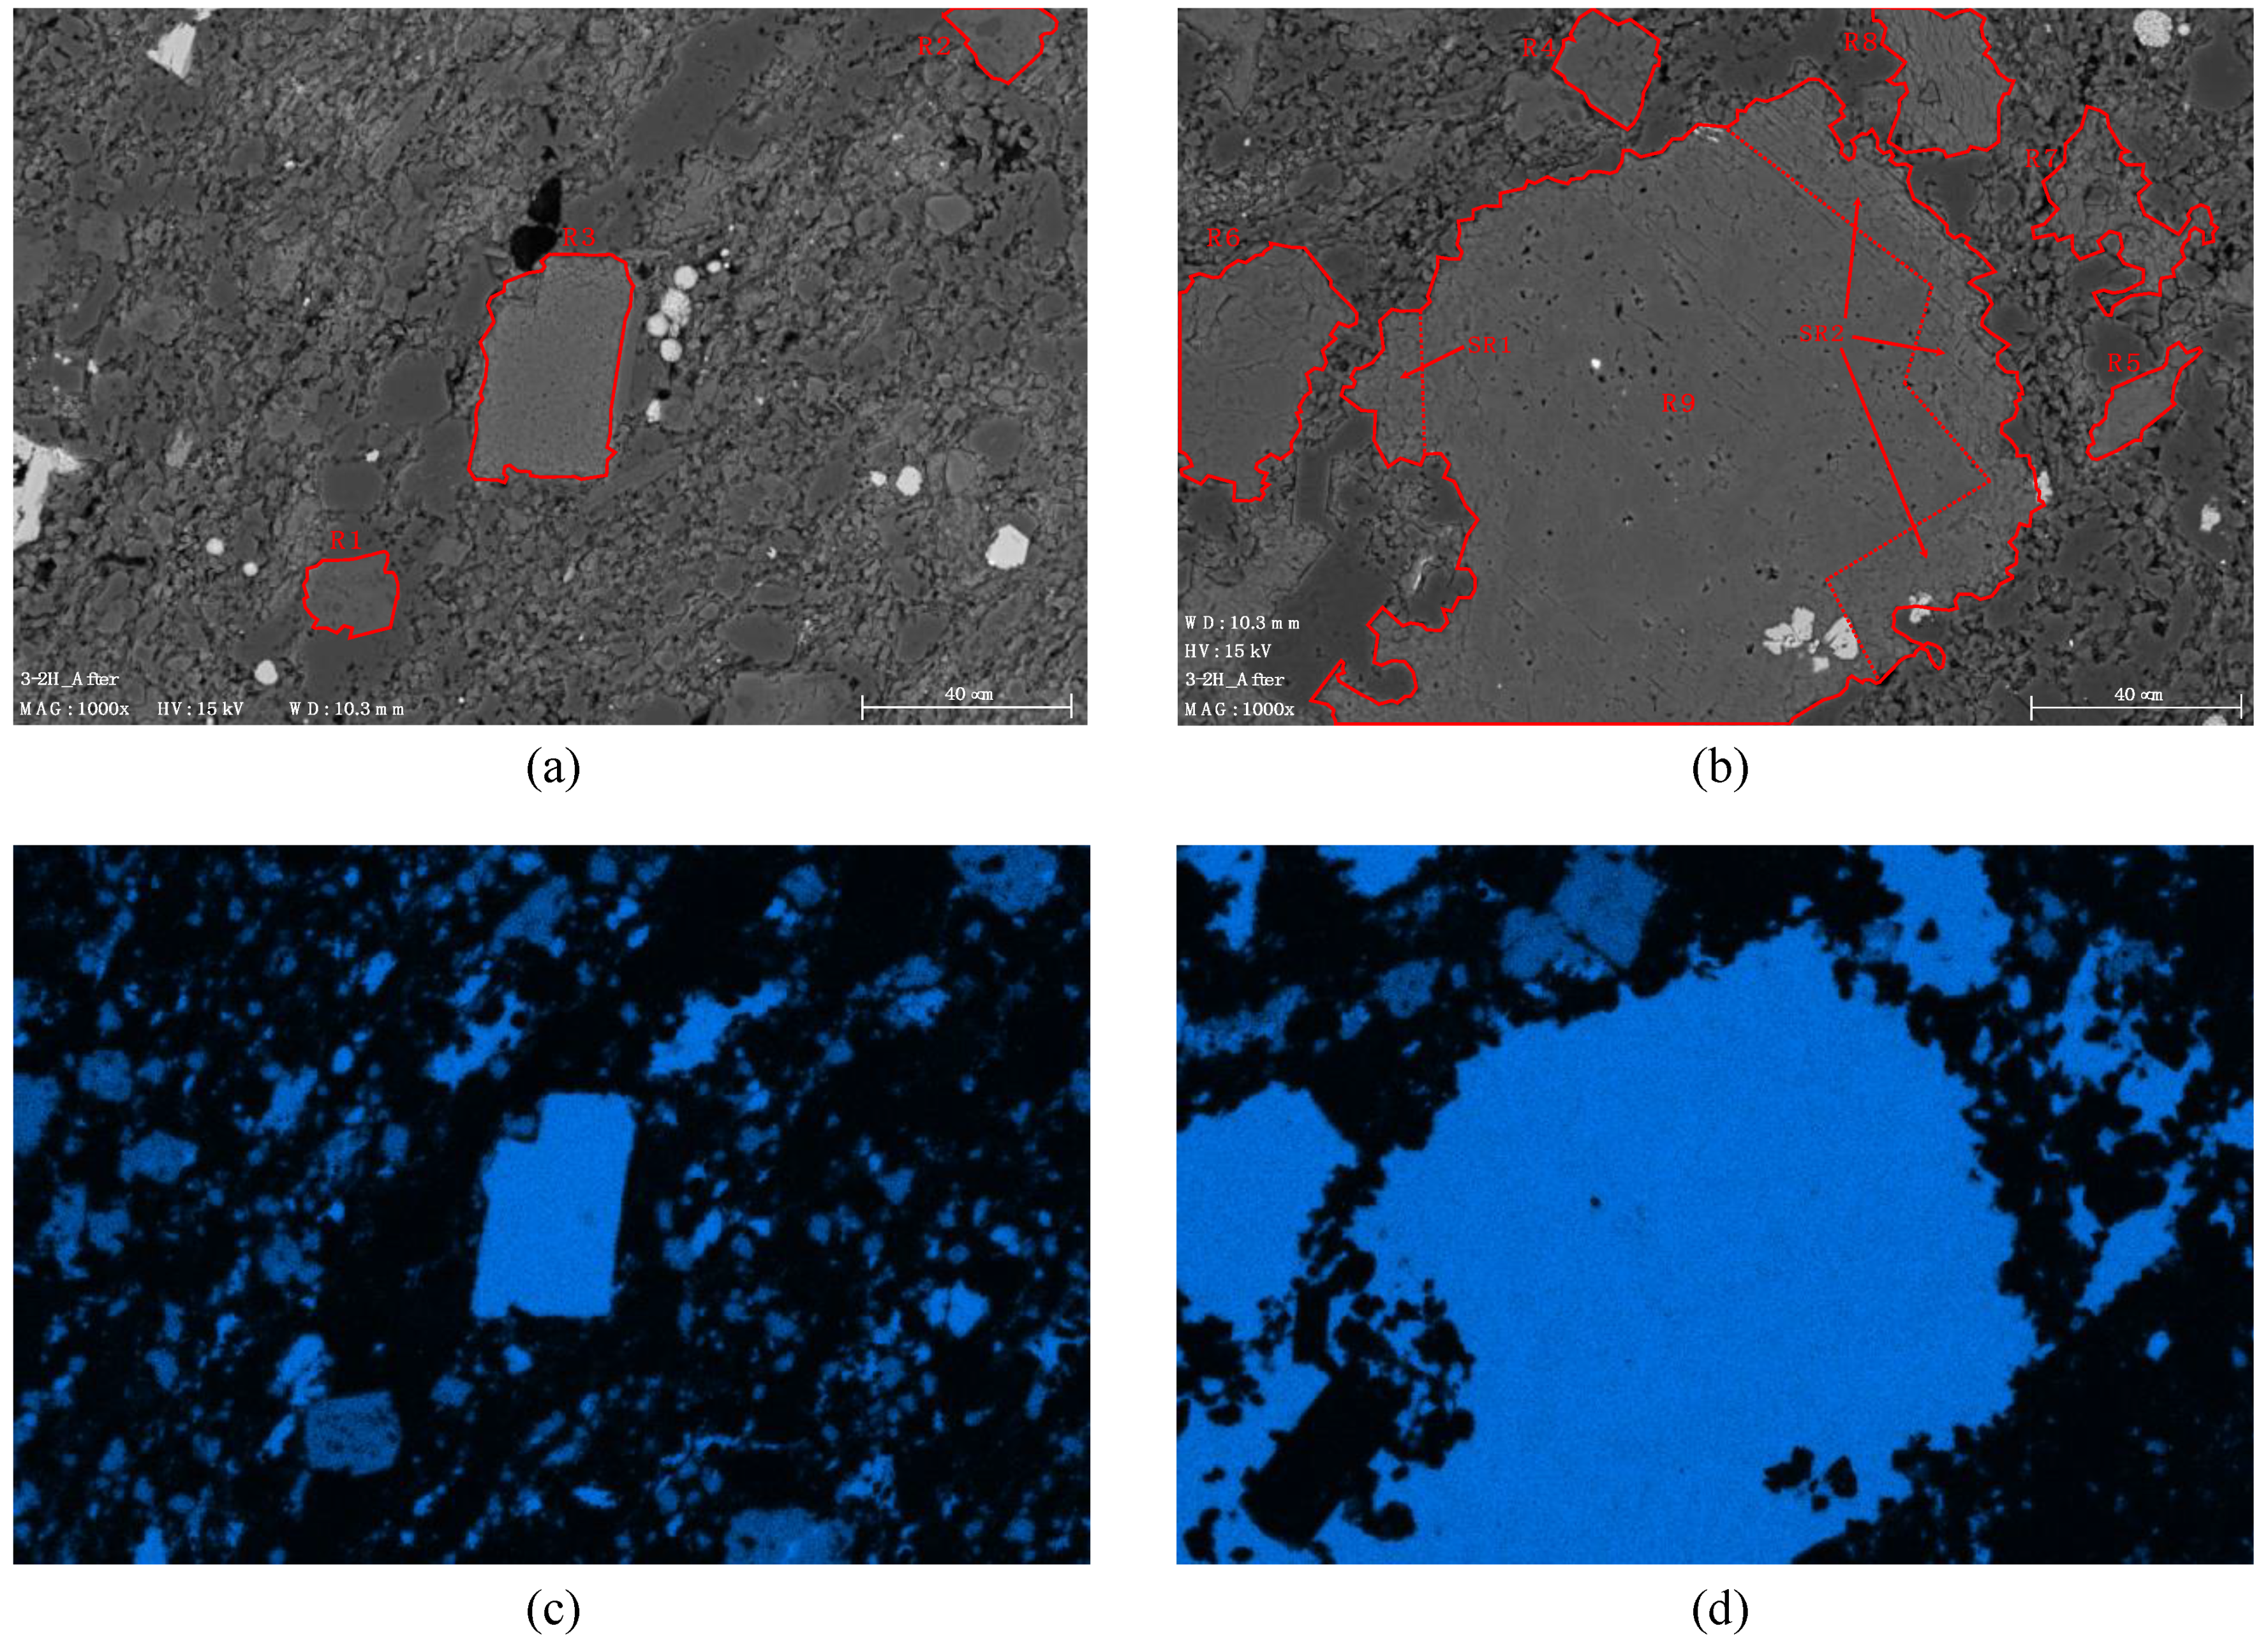
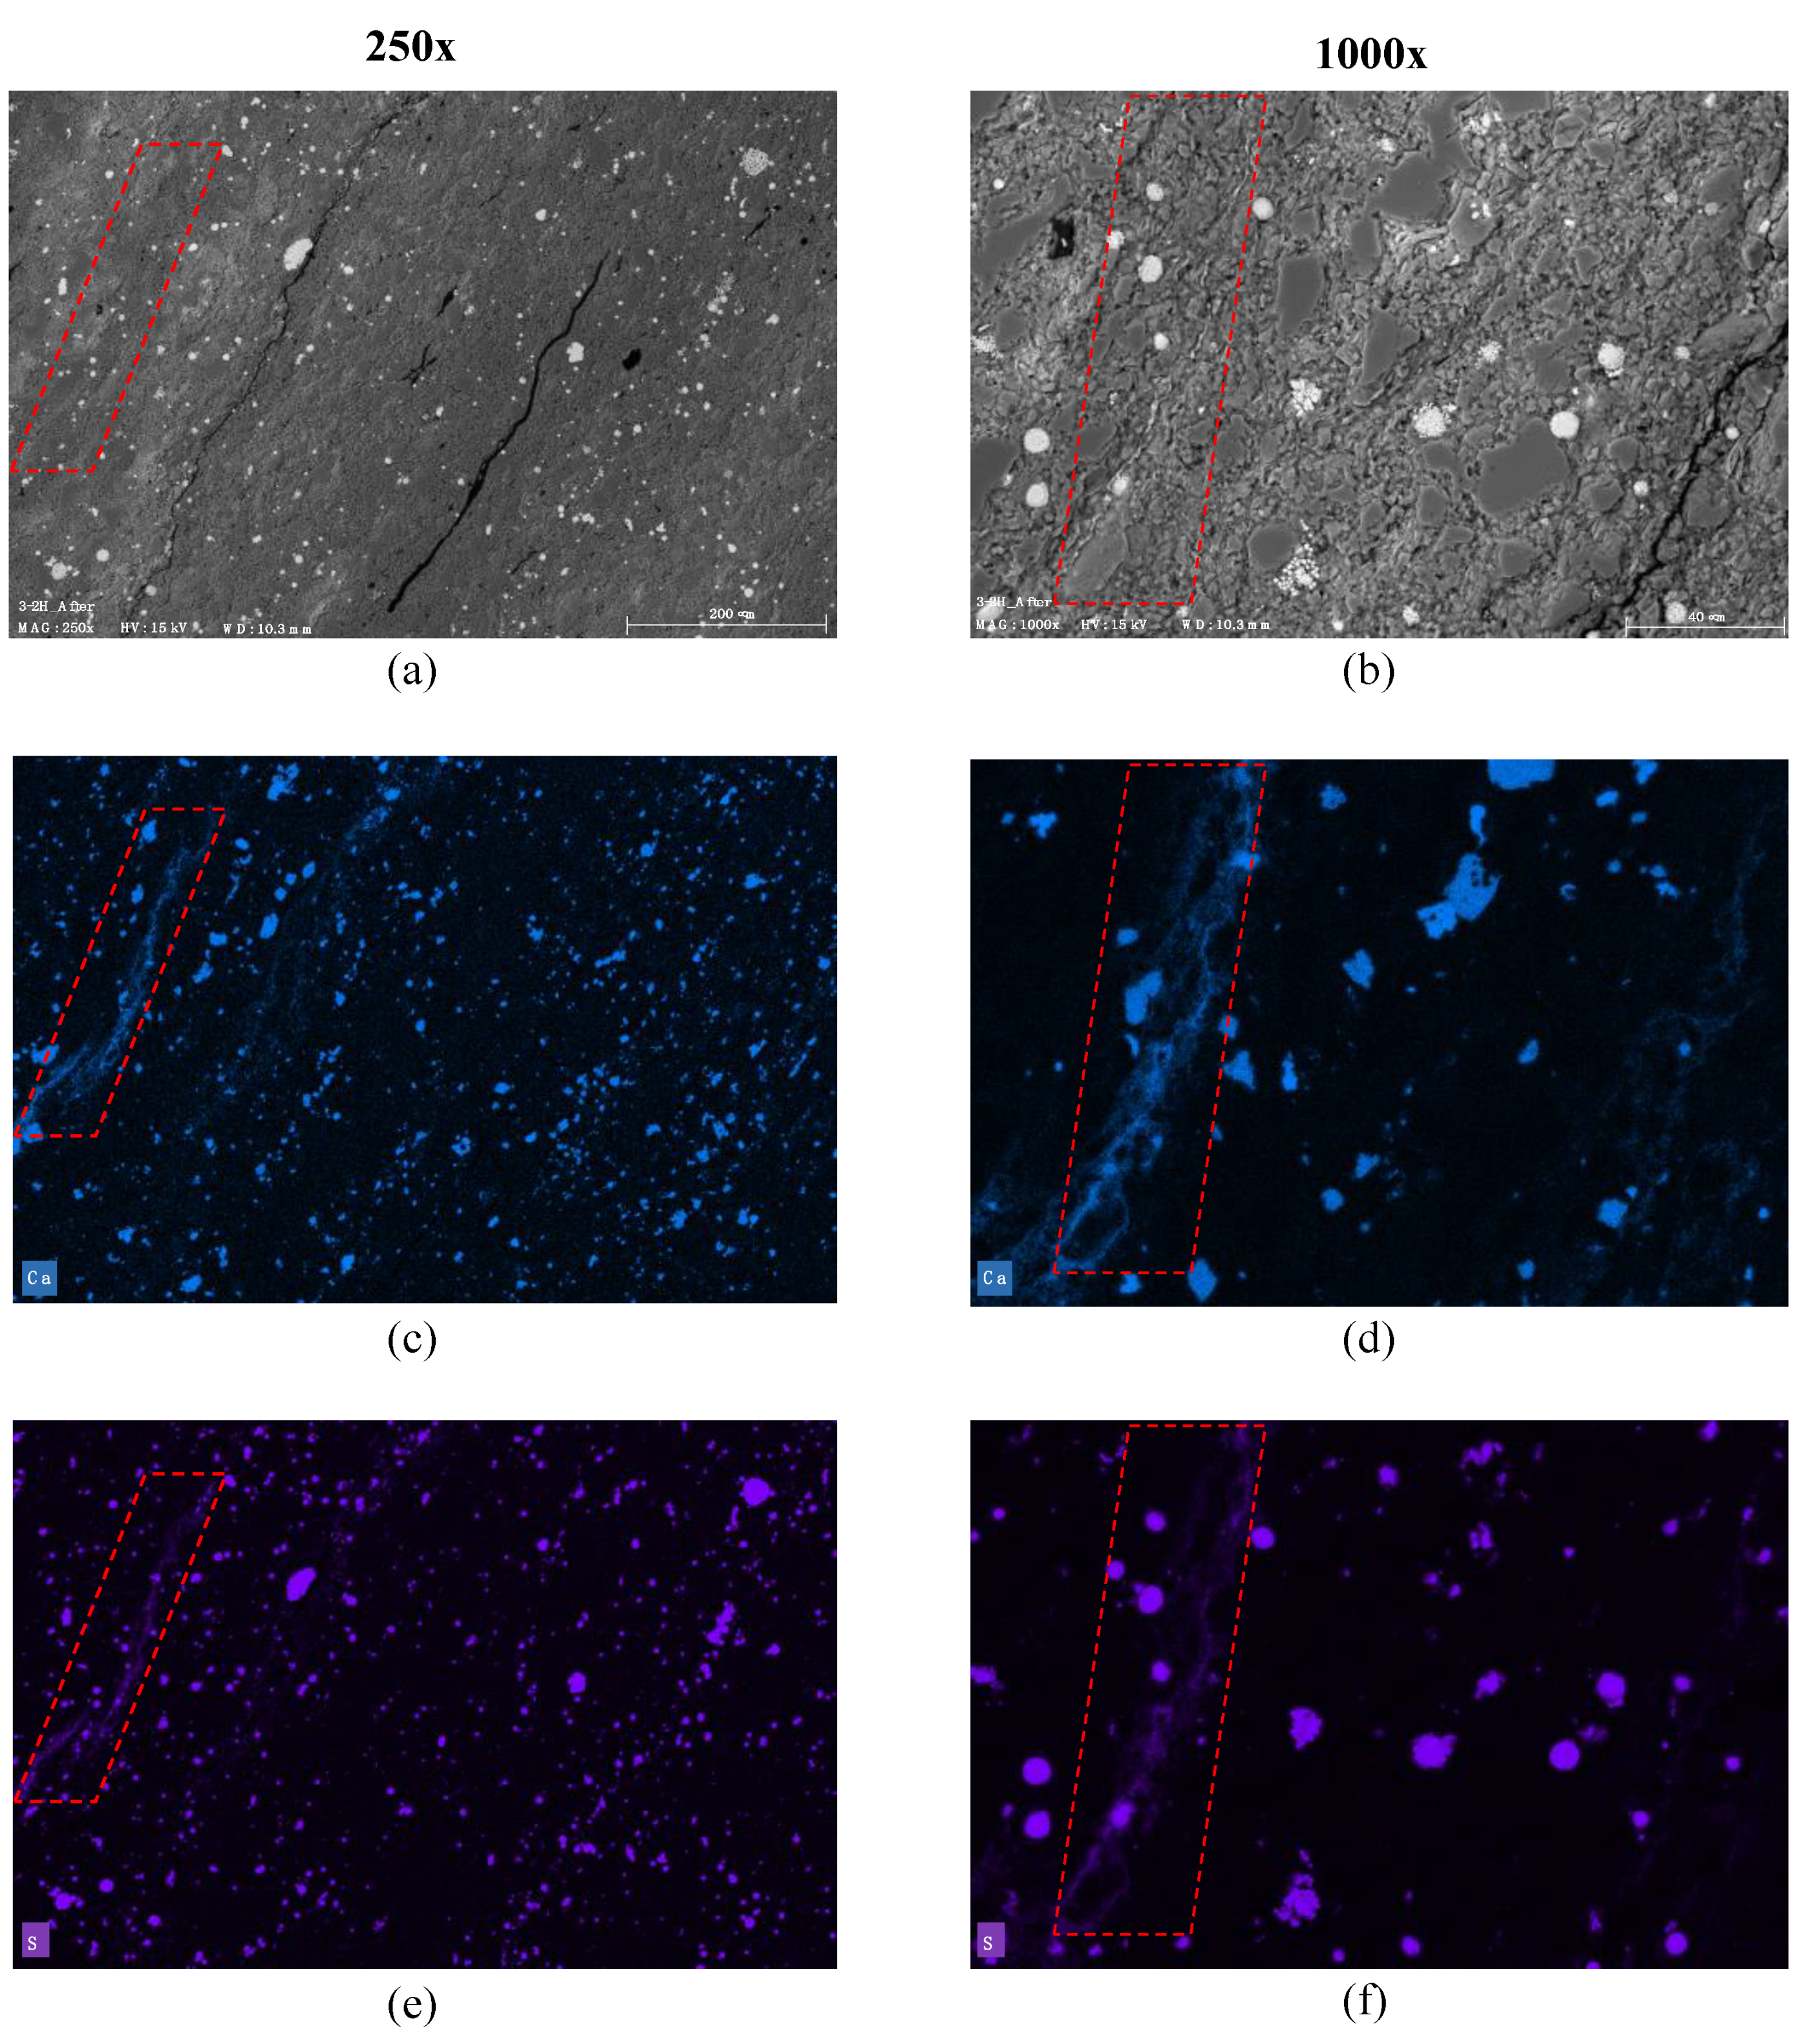
Table 1.
Mineralogical content, depth, and RockEval analysis for the samples in this study.
| Formation | Wolfcamp | Eagle Ford | Utica | |||||
|---|---|---|---|---|---|---|---|---|
| Sample ID | 2-1H | 3-2H | 4-2H | 4-4H | 1-63H | 3-110H | 4-6H | 1-42-3H |
| Diameter (mm) | 25.21 | 25.25 | 25.28 | 25.25 | 25.31 | 25.35 | 25.25 | 25.32 |
| Length (mm) | 9.55 | 8.02 | 6.62 | 7.32 | 6.06 | 6.41 | 6.03 | 7.34 |
| Depth (m) | 2859 | 2893 | 2943 | 2949 | 4281 | 4334 | 4348 | 1914 |
| Well Number | Sugg-A-171-6TW | Seidel-A-2MW | Lennington-1H/OH-HH-63992 | |||||
| Carbonate (%) | 71.5 | 3.9 | 5.8 | 3.6 | 55.8 | 56.9 | 53.1 | 15.3 |
| Calcite (%) | 71.5 | <bdl | <bdl | 1.1 | 55.8 | 56.1 | 53.1 | 15.3 |
| Dolomite (%) | <bdl | 3.9 | 5.8 | 2.5 | <bdl | 0.8 | <bdl | <bdl |
| QFP (%) | 27.7 | 67.9 | 61.8 | 52.5 | 21.3 | 21.5 | 22.8 | 32.9 |
| Feldspar (%) | <bdl | 7.2 | 7.2 | <bdl | <bdl | <bdl | <bdl | <bdl |
| Quartz (%) | 24.5 | 53.8 | 52.7 | 51.3 | 14.0 | 14.3 | 14.8 | 28.5 |
| Plagioclase (%) | <bdl | 11.0 | 7.2 | <bdl | 2.5 | 2.5 | 2.9 | <bdl |
| Pyrite (%) | 3.2 | 3.8 | 1.9 | 1.2 | 4.8 | 4.7 | 5.1 | 4.4 |
| Muscovite (%) | <bdl | 24.6 | 29.3 | <bdl | <bdl | <bdl | <bdl | <bdl |
| Illite (%) | <bdl | <bdl | <bdl | 39.5 | 9.7 | 8.5 | 9.9 | 47.2 |
| Mica (%) | <bdl | <bdl | <bdl | <bdl | 5.1 | 5.3 | 5.7 | <bdl |
| Chlorite (%) | <bdl | <bdl | <bdl | <bdl | 1.3 | 0.9 | 1.4 | <bdl |
| Total Clay (%) | <bdl | 24.6 | 29.3 | 39.5 | 16.1 | 14.7 | 17 | 47.2 |
| TOC (%) | 0.8 | 3.6 | 3.1 | 4.4 | 6.8 | 6.9 | 7.1 | 4.6 |
| S1 (mg/g) | 0.59 | 3.83 | 5.7 | 6.57 | 8.72 | 9.94 | 10.67 | N/A |
| S2 (mg/g) | 1.05 | 8.68 | 6.87 | 13.04 | 7.07 | 6.28 | 6.47 | N/A |
| S3 (mg/g) | 0.17 | 0.32 | 0.32 | 0.2 | 0.27 | 0.25 | 0.24 | N/A |
| Tmax (°C) | 442 | 444 | 445 | 446 | 350 | 470 | 479 | N/A |
| HI | 140 | 240 | 222 | 297 | 103 | 91 | 92 | N/A |
| OI | 23 | 9 | 10 | 5 | 4 | 4 | 3 | N/A |
| PI | 0.36 | 0.31 | 0.46 | 0.34 | 0.55 | 0.61 | 0.62 | N/A |
Note that S1 is free oil content, S2 is remaining generation potential, and S3 is CO2 yield. They are in units of mass per unit mass of the rock sample. Moreover, HI is hydrogen index, OI is oxygen index, and PI is production index defined as S1/(S1 + S2).
Table 2.
Summary of the results of 8 samples tested in this study, at an effective stress of 30 MPa, including initial permeability values and their changes by scCO2 along with the contributing processes.
Table 2.
Summary of the results of 8 samples tested in this study, at an effective stress of 30 MPa, including initial permeability values and their changes by scCO2 along with the contributing processes.
| Sample ID | Meas. Method | Initial Perm (m2) | kC2/kC1 | kC3/kC1 | Net Change | Processes/Phenomena |
|---|---|---|---|---|---|---|
| 2-1H | PD | 0.50 × 10⁻²¹ | 22.4 | 14.2 | Significant Increase | Irreversible dissolution of carbonate minerals (D) |
| 3-2H | SS | 2.08 × 10⁻¹⁸ | 0.49 | 1.01 | Constant | Reversible adsorption of scCO2 into clays and organic matter; Slight carbonate dissolution in micro-cracks (A) |
| 4-2H | SS | 0.76 × 10⁻¹⁸ | 4.50 | 3.25 | Significant Increase | Irreversible dissolution of calcite-filled micro-cracks (D);No observable adsorption despite high “clay+TOC” |
| 4-4H | PD | 1.47 × 10⁻¹⁹ | 0.52 | 0.95 | Slight Decrease | Reversible adsorption of scCO2 into clays and organic matter (A) |
| 1-63H | PD | 6.38 × 10⁻²¹ | 0.83 | 1.14 | Slight Increase | Dissolution dominates adsorption while both occur to a moderate degree (MAD) |
| 3-110H | PD | 3.08 × 10⁻²¹ | 0.55 | 0.84 | Slight Decrease | Adsorption dominates dissolution while both occur to a moderate degree (MAD) |
| 4-6H | SS | 4.87 × 10⁻¹⁸ | 0.57 | 0.47 | Decrease | Mechanical compaction of matrix surrounding micro-cracks overshadowing adsorption and dissolution (W) |
| 1-42-3H | SS | 1.97 × 10⁻¹⁸ | 0.30 | 0.45 | Decrease | Adsorption dominates over dissolution in both short and longer-term with enhanced dissolution in the latter (MAD) |
Note: kC1, kC2, and kC3 refer to pre-CO2 argon permeability, scCO2 permeability, and post-CO2 argon permeability, respectively. Moreover, in the column of “Meas. Method”, PD and SS refer to pulse-decay and steady-state methods, respectively.
Table 3.
Pressure dependency rates of argon permeabilities (C1, C3, and C6 cycles in the tests), before and after interaction with scCO2.
Table 3.
Pressure dependency rates of argon permeabilities (C1, C3, and C6 cycles in the tests), before and after interaction with scCO2.
| Sample ID | Clay + TOC | (k10U-k30)/k10U × 100 | ||
|---|---|---|---|---|
| C1 Cycle; before scCO2 | C3 Cycle; after scCO2 | C6 Cycle; after Extended scCO2 | ||
| 2-1H | 1% | 25.3% | 41.5% | N/A |
| 3-2H | 28% | 23.5% | 26% | 27.3% |
| 4-2H | 32% | 13.1% | 11.6% | 9.2% |
| 4-4H | 44% | 10.8% | 6.7% | N/A |
| 1-63H | 23% | 25.1% | 21.9% | N/A |
| 3-110H | 22% | 17.8% | 0.73% | N/A |
| 4-6H | 24% | 30.6% | 33.4% | N/A |
| 1-42-3H | 52% | 33.3% | 45.7% | N/A |
Note that k30 and k10U refer to the permeability values at confining pressures of 30 MPa and after unloading to 10 MPa, respectively.
Publisher’s Note: MDPI stays neutral with regard to jurisdictional claims in published maps and institutional affiliations. |
© 2021 by the authors. Licensee MDPI, Basel, Switzerland. This article is an open access article distributed under the terms and conditions of the Creative Commons Attribution (CC BY) license (http://creativecommons.org/licenses/by/4.0/).
Share and Cite
MDPI and ACS Style
Kamali-Asl, A.; Zoback, M.D.; Kohli, A.H. Effects of Supercritical CO2 on Matrix Permeability of Unconventional Formations. Energies 2021, 14, 1101. https://doi.org/10.3390/en14041101
AMA Style
Kamali-Asl A, Zoback MD, Kohli AH. Effects of Supercritical CO2 on Matrix Permeability of Unconventional Formations. Energies. 2021; 14(4):1101. https://doi.org/10.3390/en14041101
Chicago/Turabian StyleKamali-Asl, Arash, Mark D Zoback, and Arjun H. Kohli. 2021. "Effects of Supercritical CO2 on Matrix Permeability of Unconventional Formations" Energies 14, no. 4: 1101. https://doi.org/10.3390/en14041101
Note that from the first issue of 2016, this journal uses article numbers instead of page numbers. See further details here.