Modeling Adsorption in Silica Pores via Minkowski Functionals and Molecular Electrostatic Moments


1
Department of Mechanical Engineering, Stanford University, Stanford, CA 94305, USA
2
Department of Energy Resources Engineering, Stanford University, Stanford, CA 94305, USA
*
Author to whom correspondence should be addressed.
Energies 2020, 13(22), 5976; https://doi.org/10.3390/en13225976
Submission received: 28 September 2020
/
Revised: 6 November 2020
/
Accepted: 13 November 2020
/
Published: 16 November 2020
(This article belongs to the Special Issue Multiscale and Multiphysics Processes in Unconventional Formations 2020)
Abstract
:Capillary condensation phenomena are important in various technological and environmental processes. Using molecular simulations, we study the confined phase behavior of fluids relevant to carbon sequestration and shale gas production. As a first step toward translating information from the molecular to the pore scale, we express the thermodynamic potential and excess adsorption of methane, nitrogen, carbon dioxide, and water in terms of the pore’s geometric properties via Minkowski functionals. This mathematical reconstruction agrees very well with molecular simulations data. Our results show that the fluid molecular electrostatic moments are positively correlated with the number of adsorption layers in the pore. Moreover, stronger electrostatic moments lead to adsorption at lower pressures. These findings can be applied to improve pore-scale thermodynamic and transport models.
1. Introduction
Phase behavior of fluids under confinement is a key process for many natural phenomena and engineering applications [1,2,3,4,5,6,7]. In porous media, this behavior is driven by capillary processes that control the transport and thermodynamic properties of fluids. One example is capillary condensation, the transition of a gas under tight confinement into a condensed phase at a pressure lower than the bulk vapor pressure [8]. This phenomenon is important for estimating hydrocarbon reserves in unconventional reservoirs [1,9] and understanding geologic carbon storage [1,2]. However, translating the impacts of capillary condensation across length- and timescales remains an open area of research [10]. The continuum-scale models become invalid in micropores, and molecular simulations become too expensive to be applied to entire pore networks. In this paper, we explore how integral geometry can effectively be applied as a scale translation approach. We show that a mathematical framework based on Minkowski functionals, using information about the pore morphology, can accurately describe the adsorption behavior of real fluids under tight confinement.
The mechanism behind capillary condensation has been the subject of numerous investigations [1,11,12,13]. This mechanism is strongly influenced by both fluid–fluid interactions and fluid–solid interactions. First, a layer of adsorbed gas forms on the pore walls as a second-order phase transition. In order for this layer of adsorbed gas to transition into a pore-filling condensed phase, the fluid needs to form a liquid bridge in the pore. This formation requires overcoming a nucleation barrier before capillary condensation proceeds as a first-order phase transition. Desgranges and Delhommelle [13] explored the nucleation of liquid bridges and vapor bubbles in confined carbon dioxide (CO2) and discovered a negative relationship between the chemical potential of coexistence and the fluid–wall interaction. Due to the high density of the condensate, once capillary condensation occurs, the pore can store significantly more fluid molecules. Chen et al. [9] suggested that unconventional gas reserves could be up to six times larger than previously believed because of capillary condensation. In an attempt to better represent phase behavior under confinement, Yang et al. [10] proposed a modified Kelvin equation that reproduces experimental data for the suppressed capillary condensation pressure of various fluids, including CO2 and hydrocarbon mixtures. Their decomposition showed that the most significant contribution in the shift comes from the fluid–wall interaction. Singh and Mehta [14] studied how two models for the shale solid matrix—graphite and mica—influence capillary condensation in n-alkanes. They showed that mica confinement shrinks the phase envelope of alkanes more than graphite confinement.
The shale solid matrix is heterogeneous and its composition varies widely from one formation to another. Clay minerals, kerogen, and quartz comprise the majority of tight shale. Quartz has been reported to constitute between 30% and 70% of the solid matter of shale [15,16]. Therefore, it is often employed to model shale rock in both experimental and computational studies [1,11,12,17,18,19,20,21]. Capillary condensation—and more broadly adsorption behavior—in quartz pores has been explored for multiple fluids, including water (H2O) [22,23,24], CO2 [12,13,20,21], methane (CH4) [20,21], and nitrogen (N2) [17,18,25], as common gases found in unconventional gas formations. Burgess et al. [12] reported on adsorption/desorption hysteresis loops for CO2 in Vycor and connected the hysteresis critical temperature to capillary condensation theory. They also showed that confinement shrinks the phase envelope. Morishige et al. [17,18] employed the volumetric approach to study gas adsorption, including N2 and CO2, in silica-based materials. They showed that the hysteresis loop of capillary condensation disappears at higher temperatures, but the point where this occurs is different from the pore critical temperature of the fluid. Raju et al. [26] computationally studied the phase transition of water in graphene nanocapillaries and carbon nanotubes. They related multilayer formation to hydrogen bonding patterns and identified multiple phase transition regimes leading to different crystal structures of confined ice. Kim et al. [27] employed atomic force microscopy to probe the validity of Kelvin’s equation for water between a quartz microscope tip and a mica surface, finding that this thermodynamically derived expression holds for nanopores if the curvature dependence of the surface tension is appropriately accounted for. Water in silica nanopores was also examined by Bonnaud et al. [24]. These researchers, via grand canonical Monte Carlo (GCMC) simulations, observed the adsorption/desorption hysteresis loop and its collapse with smaller pore size. They also employed molecular dynamics (MD) simulations to show that the self-diffusion coefficient of water decreases under confinement, because water molecules adopt an H-down orientation due to the hydrophilic tendency of silica. This layering of the adsorbate in silica pores has been reported for other fluids too. In particular, Jin and Firoozabadi [28] investigated the composition of adsorption layers in clay pores. Studying mixtures of CH4, CO2, and H2O, they reported water forms the layer closest to the pore wall, CO2 can form multiple adsorption layers (of diminishing adsorption stability), and CH4 fills in the middle of the pore. Similar behavior was observed by Sun et al. [20] in quartz pores, where they studied the effects of pressure and surface functionaliztion on competitive adsorption of CH4 and CO2. Aljamaan et al. [15] experimentally observered multilayer sorption of CO2 in shale, and suggested that the number of layers depends on the quadrupole moment of the molecule.
The disordered porous nature of the rock substantially impacts the thermophysical properties of confined fluids, introducing large deviation from the properties of bulk fluids. A number of mathematical models have been developed to describe phase behavior under confinement [25,29,30]. Gommes and Roberts [31] proposed a multiphase extension to the standard Gaussian random field model of disordered materials and used this new model to explore capillary condensation. Their findings show that metastable states of adsorption are only found in the most ordered systems considered in that study. Importantly, disorder acts as an environmental noise source. Spagnolo et al. [32] demonstrated that environmental noise affects metastable states in condensed matter systems. These findings are significant for understanding confined fluid behavior in real geologic formations at larger scales; however, the adsorption physics is still unknown at the molecular level. In our work, cylindrical pores are used as a stepping stone in understanding the effects of fluid–solid interactions. The extensions and limitations of our model are also discussed.
Capillary condensation can also be described via Minkowski functionals [29], a mathematical concept for characterizing the morphology and topology of spatial patterns [33], including porous materials. Early studies on this issue have focused on two-dimensional (2D) problems. For a 2D system, there are three Minkowski functionals, representing area, circumference, and signed curvature. Mecke and Arns [34] applied Minkowski functionals to study capillary condensation in a system consisting of overlapping spheres and ellipsoids, successfully reproducing the shift of the critical point under confinement. Boelens and Tchelepi [25] showed that the grand potential (also known as the Landau free energy [35]) and the excess adsorption can be expressed via empirically-augmented formulas based on Minkowski functionals. They adapted Hadwiger’s theorem and classical density functional theory (DFT) calculations with a Lennard-Jones potential. Employing the Minkowski functionals mathematical formalism, they successfully reproduced the phase behavior of nitrogen in 2D smooth Vycor pores.
We extend the work of Boelens and Tchelepi [25] and examine the validity of their approach for more complex interatomic potentials, rough surfaces, and four different compounds with different molecular size and polarity. We show that the Minkowski functionals can accurately describe the phase behavior of real fluids in SiO2 nanopores despite the competing effects of the various molecular interactions. Our results demonstrate that Minkowski functionals can be used to translate information from the molecular level to pore scale. In exploring the impact of molecular size and polarity on adsorption, we find that the adsorption behavior of a fluid is strongly influenced by the dipole and quadrupole moments of the fluid molecules. The dipole moment is a measure of the polarity of a chemical bond. The quadrupole moment describes the effective shape of the molecular charge distribution. A perfectly spherically symmetric charge distribution has zero quadrupole moment. In this work, we show that stronger electrostatic moments lead to early onset of adsorption and to the formation of multiple adsorption layers across the pore.
The remainder of this paper is organized as follows. Section 2 discusses how Minkowski functionals can be applied to three-dimensional (3D) systems and outlines our molecular simulations. Section 3 presents the findings of our study and discusses their scientific significance. Section 4 summarizes the main results and discussed their implications for geologic carbon storage and gas production from unconventional formations.
2. Methods
2.1. Mathematical Framework
Following the approach of Boelens and Tchelepi [25], we aim to express the grand potential in terms of Minkowski functionals. The grand potential is an extensive quantity that depends on the geometric properties of the system X, the chemical potential , and the temperature T. Thermodynamically, we can completely describe a system if we know its appropriate thermodynamic potential, that is, the grand potential in the case of the grand canonical ensemble. By separating variables and assuming linearity, the grand potential can be written as:
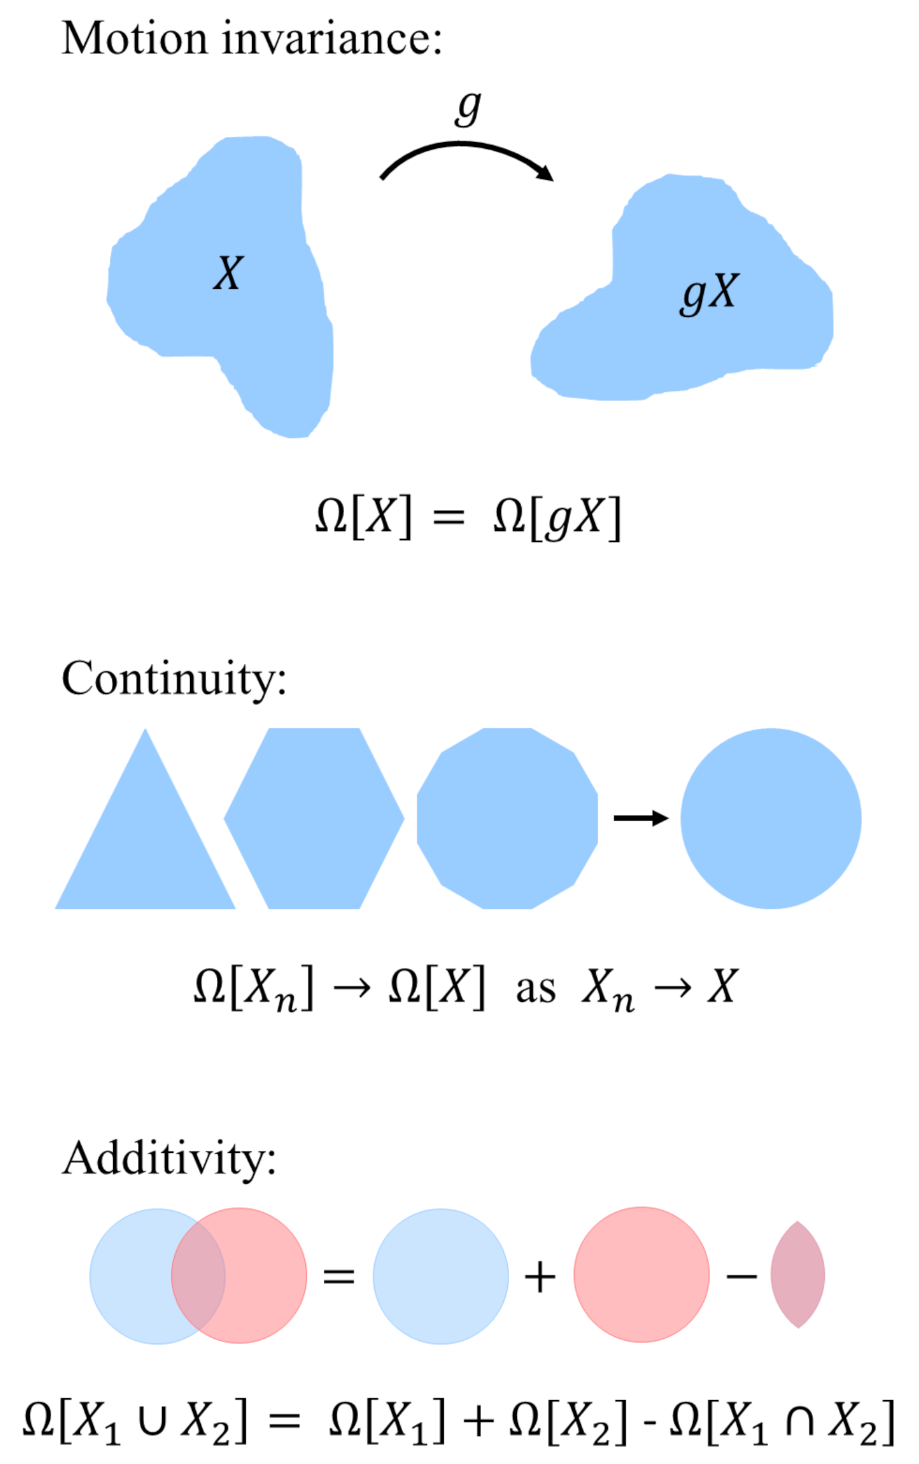
where is an intensive thermodynamic quantity and is the volume of the system. For the grand potential, is the negative of the pressure of the system. Equation (1) is valid only for bulk systems. For systems under confinement, the dependence of on the shape of the system X is an integral over the phase space of the system. For real pores, this integral can only be approximated [36]. To overcome this limitation, König et al. [36] suggested three physical restrictions on this dependence (shown in Figure 1):
- Motion invariance: The thermodynamic potential is independent of the system’s location and orientation in space. For any translation or rotation g:
- Continuity: If a sequence of convex sets converges to X for , then . This property states that an approximation of the convex domain also yields an approximation of the grand potential.
- Additivity: The functional union of two domains and is the sum of the functional of the individual domains subtracted by their intersection:
Enforcing these properties, one can invoke Hadwiger’s theorem [34,36], stating that any motion-invariant, continuous, and additive functional can be written as a linear combination of the corresponding Minkowski functionals. Specifically, for a 3D system the Minkowski functionals are defined as [29]:
where V is the volume of a pore space X, A is the surface area of the pore, H is the integral mean curvature, and is the Euler characteristic of the pore. Using Hadwiger’s theorem, Mecke et al. [34,36] give the grand potential as:
where is the surface tension and and are bending rigidities. These coefficients are properties of the fluid and fluid–wall interactions, but are independent of the geometry of the wall.
We note that for an infinite cylinder, the integral mean curvature , where R is the pore radius, and the Euler characteristic is equal to zero. Therefore, we use the following expressions for the Minkowski functionals of the cylindrical pores in our study: , , , and . Thus, the last term in Equation (8) is zero for the geometries investigated in our work. In these expressions, L is the length of the simulation box along the pore central axis. Based on numerical results, Boelens and Tchelepi [25] augmented this expression for Lennard-Jones fluids by adding two additional terms. One of these terms is proportional to and the other term is proportional to . Due to the non-linearity, these two terms are not additive when studying pore networks [25,29]. In contrast to the 2D DFT simulations of Boelens and Tchelepi [25], our GCMC approach models the pore as a cylinder in 3D. Therefore, we translate their empirical terms to 3D and rewrite the augmented version of Equation (8) as:
The coefficients of the last two terms are named pseudo-pressure and pseudo-surface tension [25]. All coefficients in this expression are functions of the chemical potential and temperature, but not the geometry. Therefore, for each fluid, there is a single set of coefficients independent of pore size. These coefficients are obtained, following the approach of Boelens and Tchelepi [25], by performing a least-squares fit for all our numerical data to Equation (9).
All relevant thermodynamic properties in the grand canonical ensemble can be computed from the grand potential [37]. In laboratory experiments, for example, a more commonly measured quantity is the excess adsorption . To calculate this quantity, we first use the grand potential to find the interfacial tension:
as a measure of the change in the grand potential introduced by the wall per unit area. Here, is the pressure in the bulk phase. In terms of Minkowski functionals, we can express as [25]:
Finally, using Gibbs theorem, we obtain the excess adsorption [25]:
where the coefficients in front of the Minkowski functionals are the derivatives with respect to chemical potential of the coefficients in Equation (9). In this paper, we explore how effectively this analytical model captures observations from molecular simulation.
2.2. Numerical Simulations
The numerical results presented in this work are obtained with the Large-Scale Atomic/Molecular Massively Parallel Simulator (LAMMPS) software package [38,39]. All simulations are performed in the grand-canonical () ensemble and are based on Monte Carlo exchanges with an ideal gas reservoir of the fluid at the specified temperature and chemical potential. The temperature is controlled using a Nosé-Hoover thermostat with a damping constant of 50 fs. The temperature of the simulations is , where is the bulk critical temperature of the fluid. This value was chosen based on the convention of studying adsorption with nitrogen at 77 K [40]. In Kelvin, the simulations’ temperature is 116.8, 77, 185.3, and 389.5 K, for simulations involving methane, nitrogen, carbon dioxide, and water, respectively. For each of the four fluids, we vary the chemical potential between and . A non-dimensional interval of , dimensionally is 0.23, 0.15, 0.37, 0.77 kcal/mol for methane, nitrogen, carbon dioxide, and water, respectively.
The bulk simulations are done in a simulation box of Å. The confined simulations are done in pores with diameters d = {5, 10, 15, 20, 40} Å. Each pore is 31.8 Å long. In both bulk and confined simulations, periodic boundary conditions are used. The number of particles in the pores varies between 0 and 1800 molecules. All simulations are equilibrated for at least 400,000 steps, and statistics are collected over 200,000 steps.
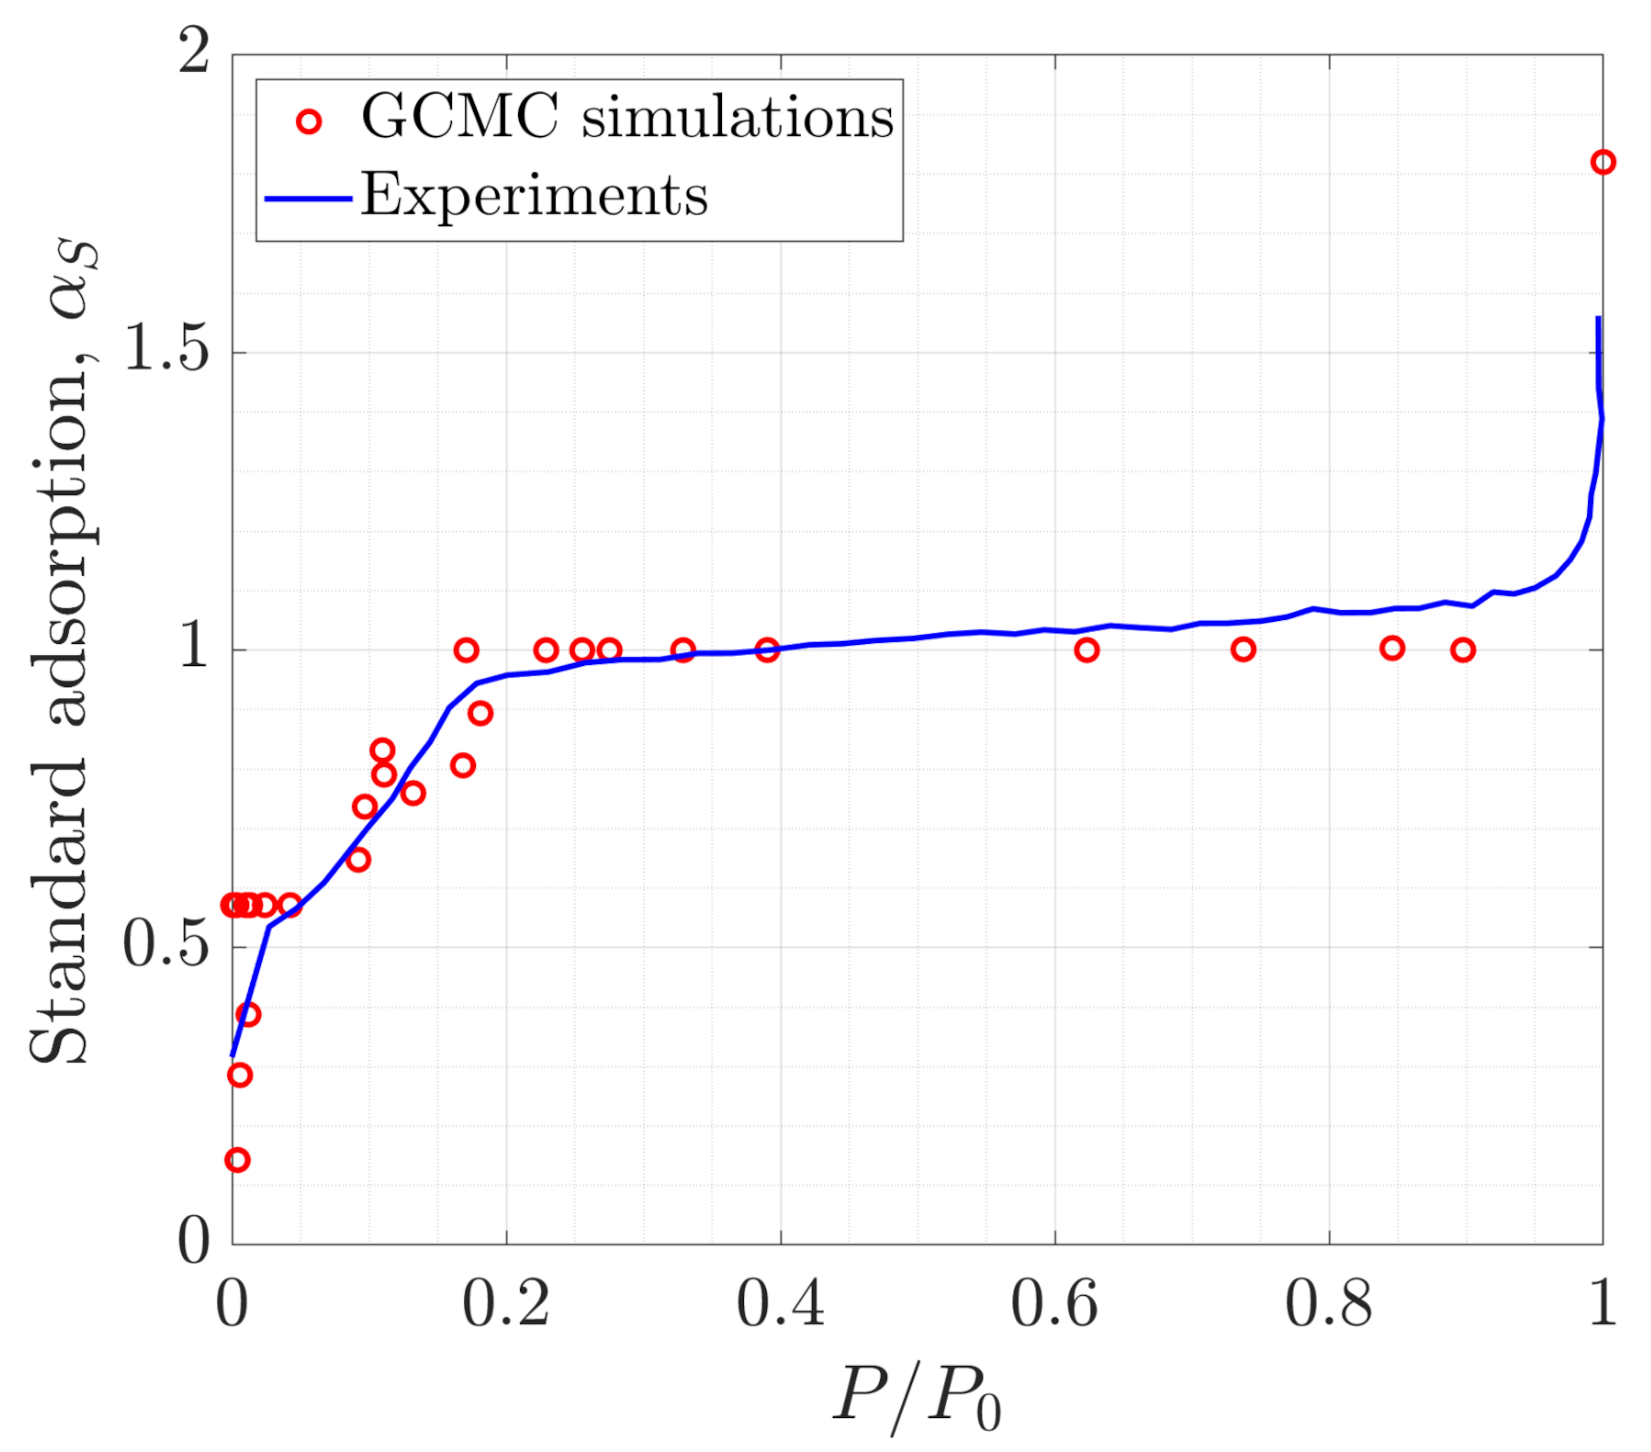
The interactions between particles are represented using the TraPPE-UA force field for methane [41], TraPPE for carbon dioxide and nitrogen [42], SPC/E for water [43], and ClayFF for the SiO2 pores [44]. TraPPE treats CO2 and N2 as rigid bodies, while the bond distances and bond angles of SPC/E H2O are constrained via the SHAKE algorithm. TraPPE-UA CH4 is represented via the unified-atom approach. The force field parameters used are summarized in Table 1. The non-bonded interactions are given by the Lennard-Jones potential and Coulombic electrostatic interactions. A 12 Å cut-off radius is used for both potentials. The long-range electrostatic interactions are calculated with the Ewald summation method with relative tolerance of for forces. To validate that these potentials are appropriate for studying adsorption, in Figure 2, we compare the adsorption isotherm of N2 at 77 K in a 20-Å-diameter silica pore obtained with our GCMC simulations to an experimental measurement by Morishige et al. [17]. There is a good agreement between the two adsorption isotherms. Moreover, similar combinations of force fields have been used previously for studying the transport and thermodynamics of confined fluids [45,46,47,48], further validating the choice of potentials.
3. Results and Discussion
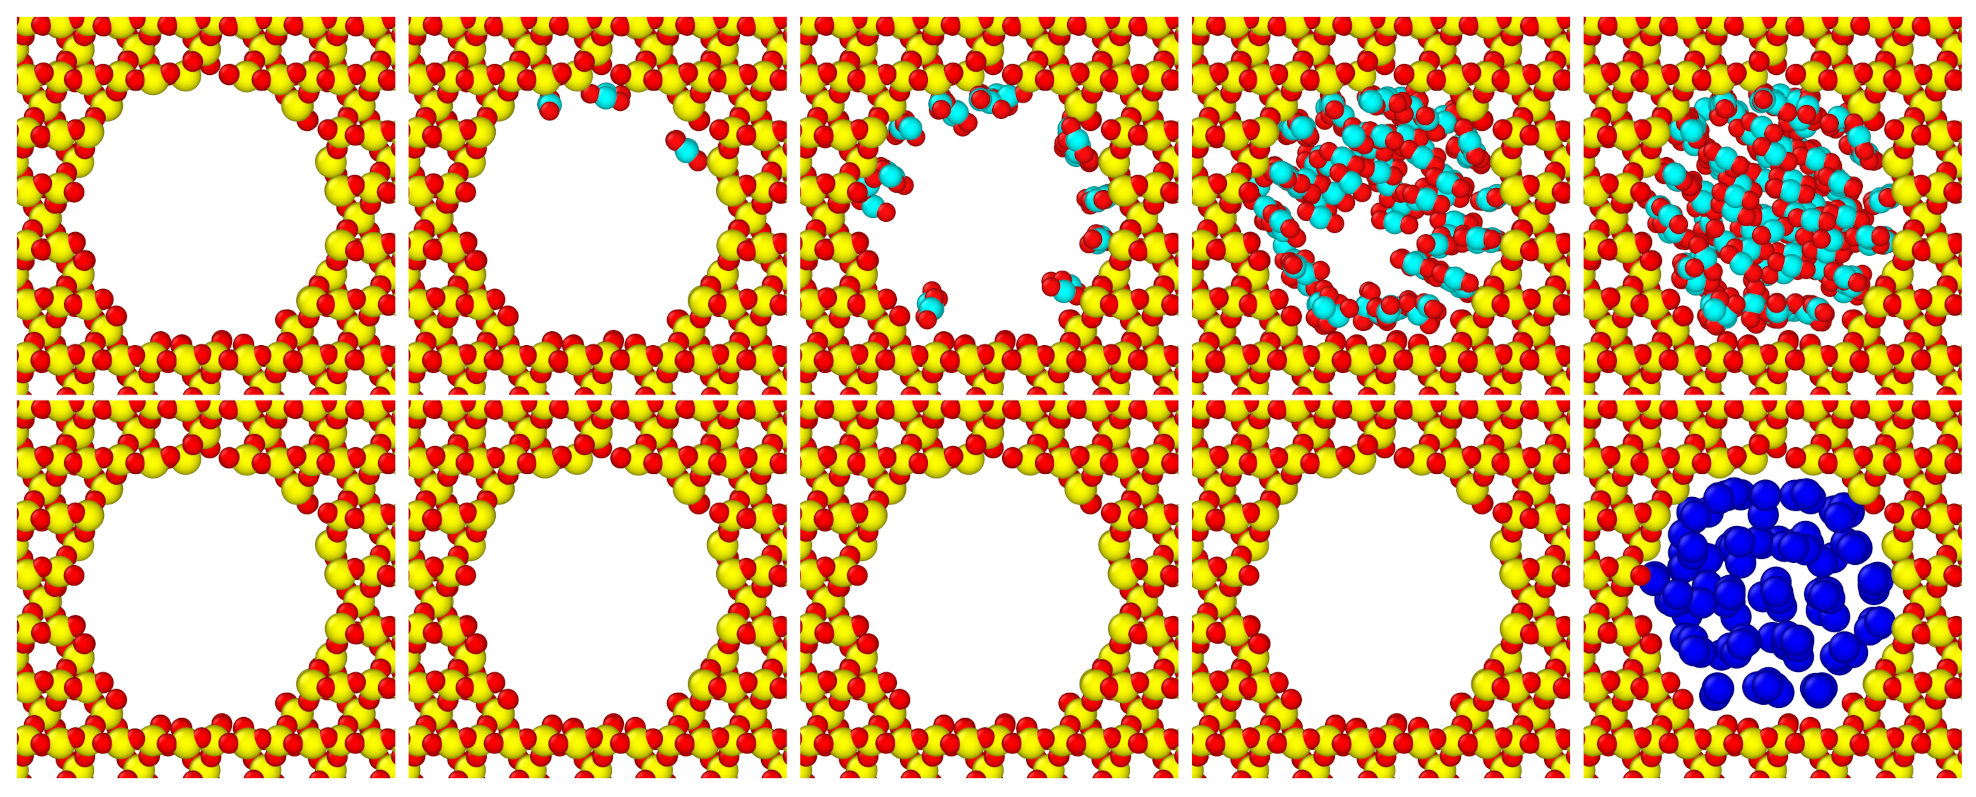
We study the phase behavior under tight confinement of four fluids (CH4, N2, CO2, and H2O) with different electrostatic moments, which are summarized in Table 2. These fluids commonly occur in shale formations. For our study, the fluids are confined in cylindrical SiO2 pores with diameters ranging between 5 and 40 Å, representative of tight shale rocks. Analyzing the molecular trajectories of GCMC simulations, we show that the onset of capillary condensation is uniquely defined by pore morphology. As shown in Figure 3, fluid molecules form one or multiple adsorption layers on the pore surface before filling up the entire pore. The number of layers formed depends on the electrostatic moments of the molecule. Finally, we connect the thermodynamics and pore morphology by extending the Minkowski functionals expression proposed by Boelens and Tchelepi [25] to a wider range of fluids and to 3D systems.
3.1. Influence of Molecular Polarity on Adsorption
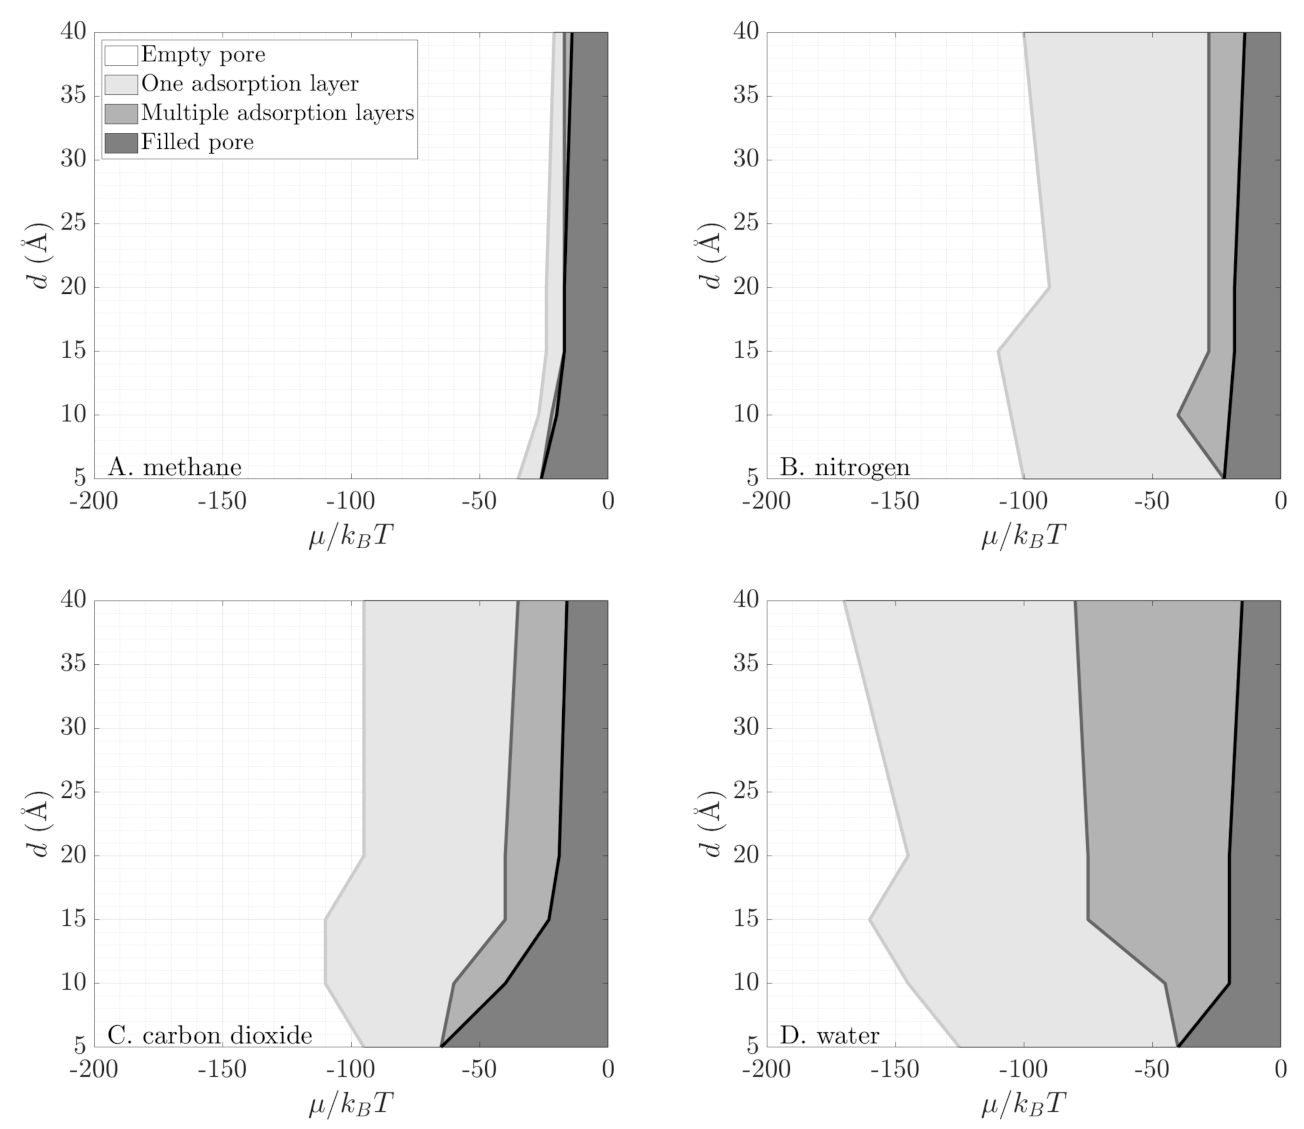
Figure 3, Figure 4 and Figure 5 show that molecules with large electrostatic moments form more adsorption layers near the pore surface. For each fluid, Figure 4 shows a map of the observed phase behavior in GCMC simulations. In particular, the region where multi-layer adsorption occurs broadens going from methane (no molecular electrostatic moments) to water (polar molecule). Larger molecular electrostatic moments lead to stronger interaction between the silica pore and the fluid, which in turn leads to a more stable physisorption of fluid molecules on the pore walls. Generally, in each map we observe four regions: an empty pore, adsorption in a single layer near the pore wall, forming multiple adsorption layers near the pore wall, and an entirely filled pore. On one hand, the region of entirely filled pore does not evolve significantly with the polarity of different species. On the other hand, the regions of single-layer adsorption and multi-layer adsorption grow considerably for increasing molecular electrostatic moments. These two regions are very limited for methane, where we typically see immediate filling of the entire pore (second row of Figure 3); yet, they span a broad range of chemical potential values for water, where we see gradual formation of adsorption layers before the pore is entirely filled.
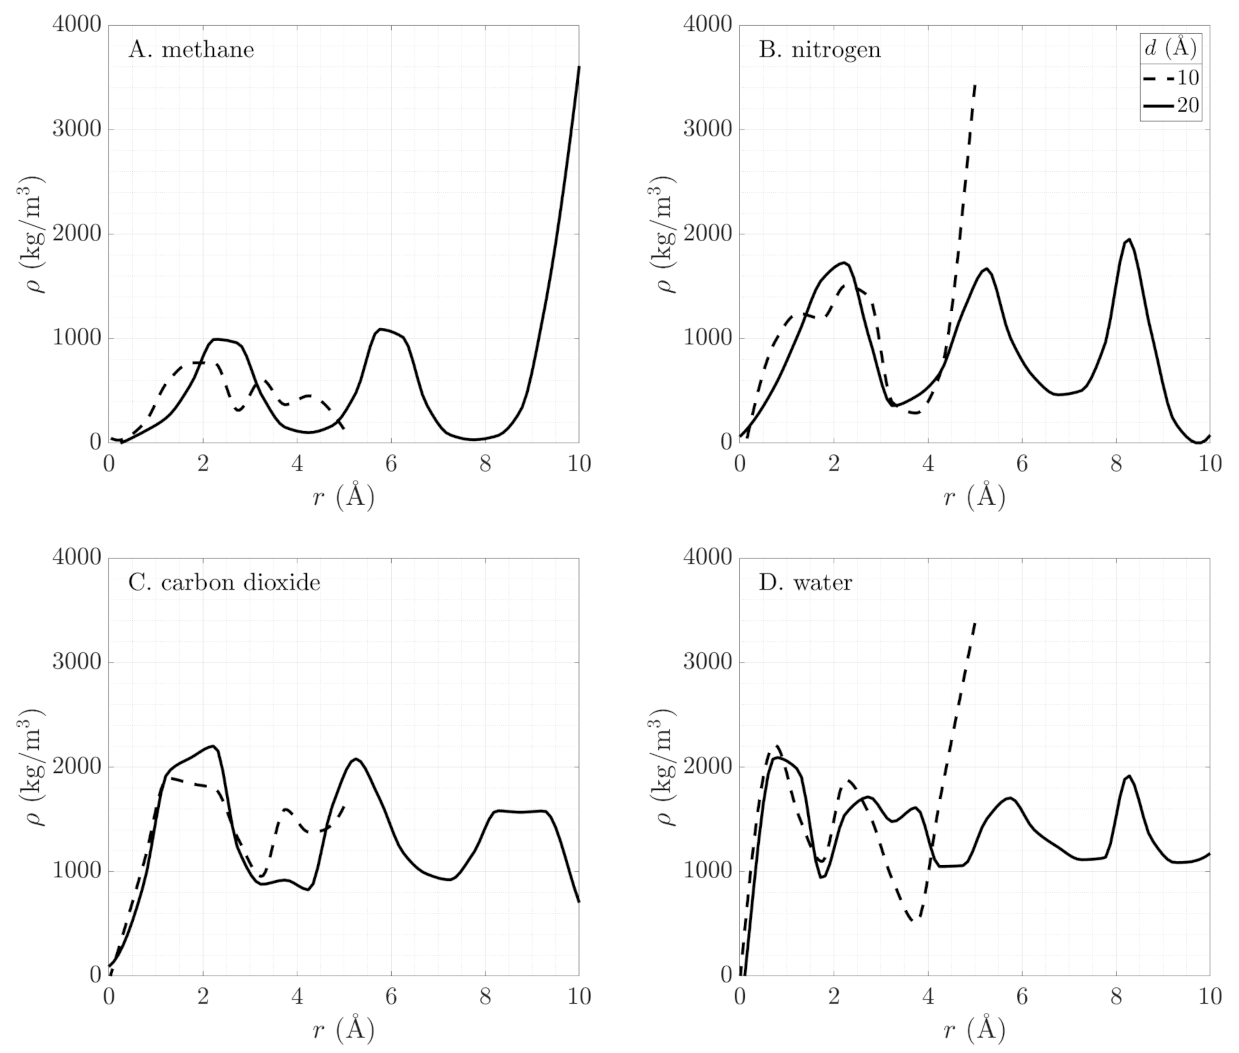
Moreover, as shown in Figure 5, the density in the interlayer regions increases for fluids with larger molecular electrostatic moments. This increase implies that there is close packing of the molecules even between the defined adsorption layers. The first row of snapshots in Figure 3 shows that CO2 fills the pore with closely packed layers. This is in contrast to CH4, whose adsorption layers can be easily delineated in the second row of Figure 3.
The effect of the electrostatic moments on the close packing of the adsorption layer is countered by the size of the pore and the molecule. This is illustrated in Figure 5, showing wider valleys in the transverse density profiles for fluids with larger molecular diameters. The transverse density profiles of CO2 and N2, whose molecular diameters differ by about 10%, show similar structure with wider valleys for CO2. Smaller pore sizes also impose a limitation on the adsorption behavior. The stronger, overlapping fluid–wall interactions lead to lower average fluid density in small pores. This dependence of the fluid density on pore size beyond the onset of capillary condensation suggests decreased accessible free volume because of repulsive wall effects and geometric constraints.
3.2. Grand Potential
Following Peterson and Gubbins [52], we determine the grant potential from the GCMC simulations by integrating the Gibbs adsorption isotherm:
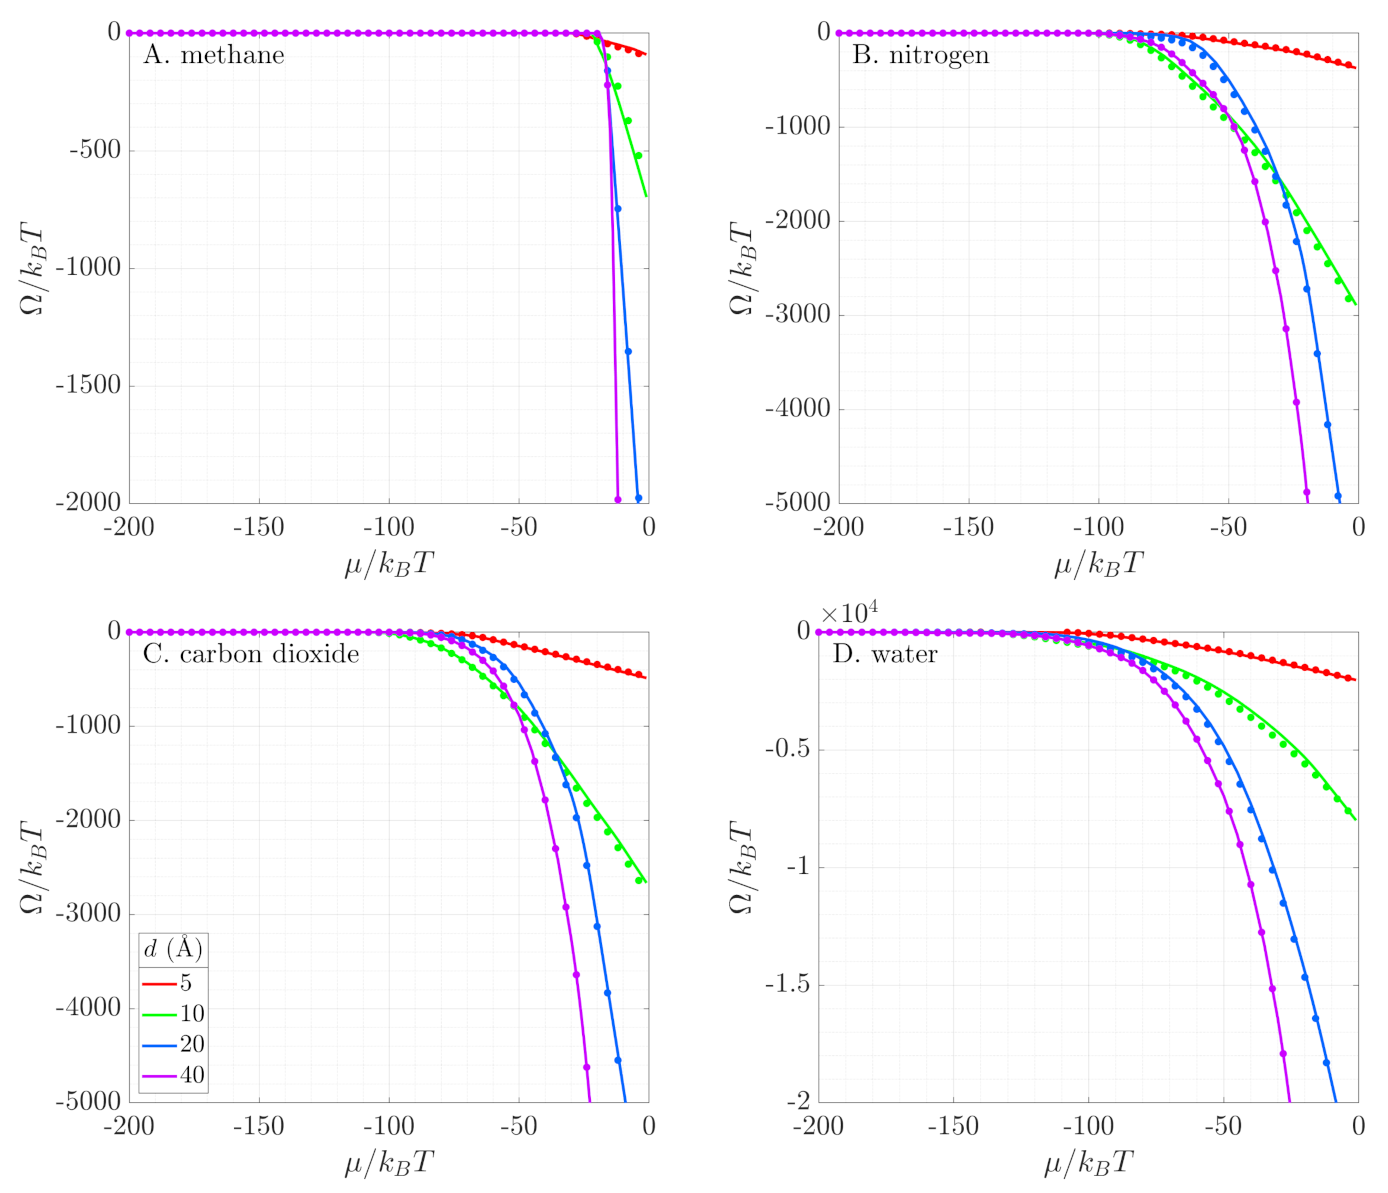
where N is the average number of molecules in the pore. The initial condition used in solving this ordinary differential equation (ODE) is the grand potential of an ideal gas [37]. We solve the ODE using an explicit Runge-Kutta integrator in MATLAB [53]. The results are shown as solid lines in Figure 6. We start studying the adsorption at very low chemical potentials when all pores are empty. As we increase the chemical potential, the slope of the grand potential becomes steeper, because molecules start adsorbing in the pore. In the range between to , depending on the fluid, the slope changes sharply, indicating a jump in the density inside the pore and onset of the capillary condensation as a first-order phase transition.
Using Equation (9), we determine the grand potential in terms of Minkowski functionals. In Figure 6, we compare the numerical results from GCMC simulations (solid lines) with this geometric reconstruction (symbols). We see excellent agreement for the four fluids in all pore sizes. The geometry-based reconstruction is able to capture phase behavior of both polar and non-polar fluids in very tight confinement. As the electrostatic moments of the fluid molecules change (Table 2), their phase behavior in the pore becomes more complex (Figure 4). Methane exhibits a single discontinuous phase transition, accompanied by a sharp change in the slope of the grand potential. Nitrogen shows three distinct regimes in its behavior: an empty pore (zero slope for ), a layer of adsorbed gas on the pore surface (slowly varying slope for ), and condensed fluid filling the pore (constant steeper slope for ). These three regimes appear as three different slopes in the grand potential. Carbon dioxide exhibits multiple phase regimes as layers of gas form near the pore surface until the pore is filled (see Figure 3). At that point, the grand potential obtains a constant slope. Finally, water shows continuously varying slope with a small discontinuous jump in fluid density (change in slope of the grand potential) at high pressures (i.e., high chemical potential). This jump is the onset of capillary condensation. The Coulombic interactions between the fluids and the pore walls define the molecular orientation within the layers and allow for closer packing of the fluid. Water as a polar molecule with a dipole moment forms more layers than methane, nitrogen, and carbon dioxide (see Figure 5).
This close packing in the adsorption layers is counteracted by the small pore sizes. In the range of length scales explored in this work, the pore diameter, which is on the order of few molecular diameters, physically constrains the number of layers that can be formed. Therefore, in smaller pores, we see capillary condensation occurring at lower pressure (i.e., lower chemical potential), accompanied by an earlier discontinuous change in the slope of the grand potential.
3.3. Excess Adsorption
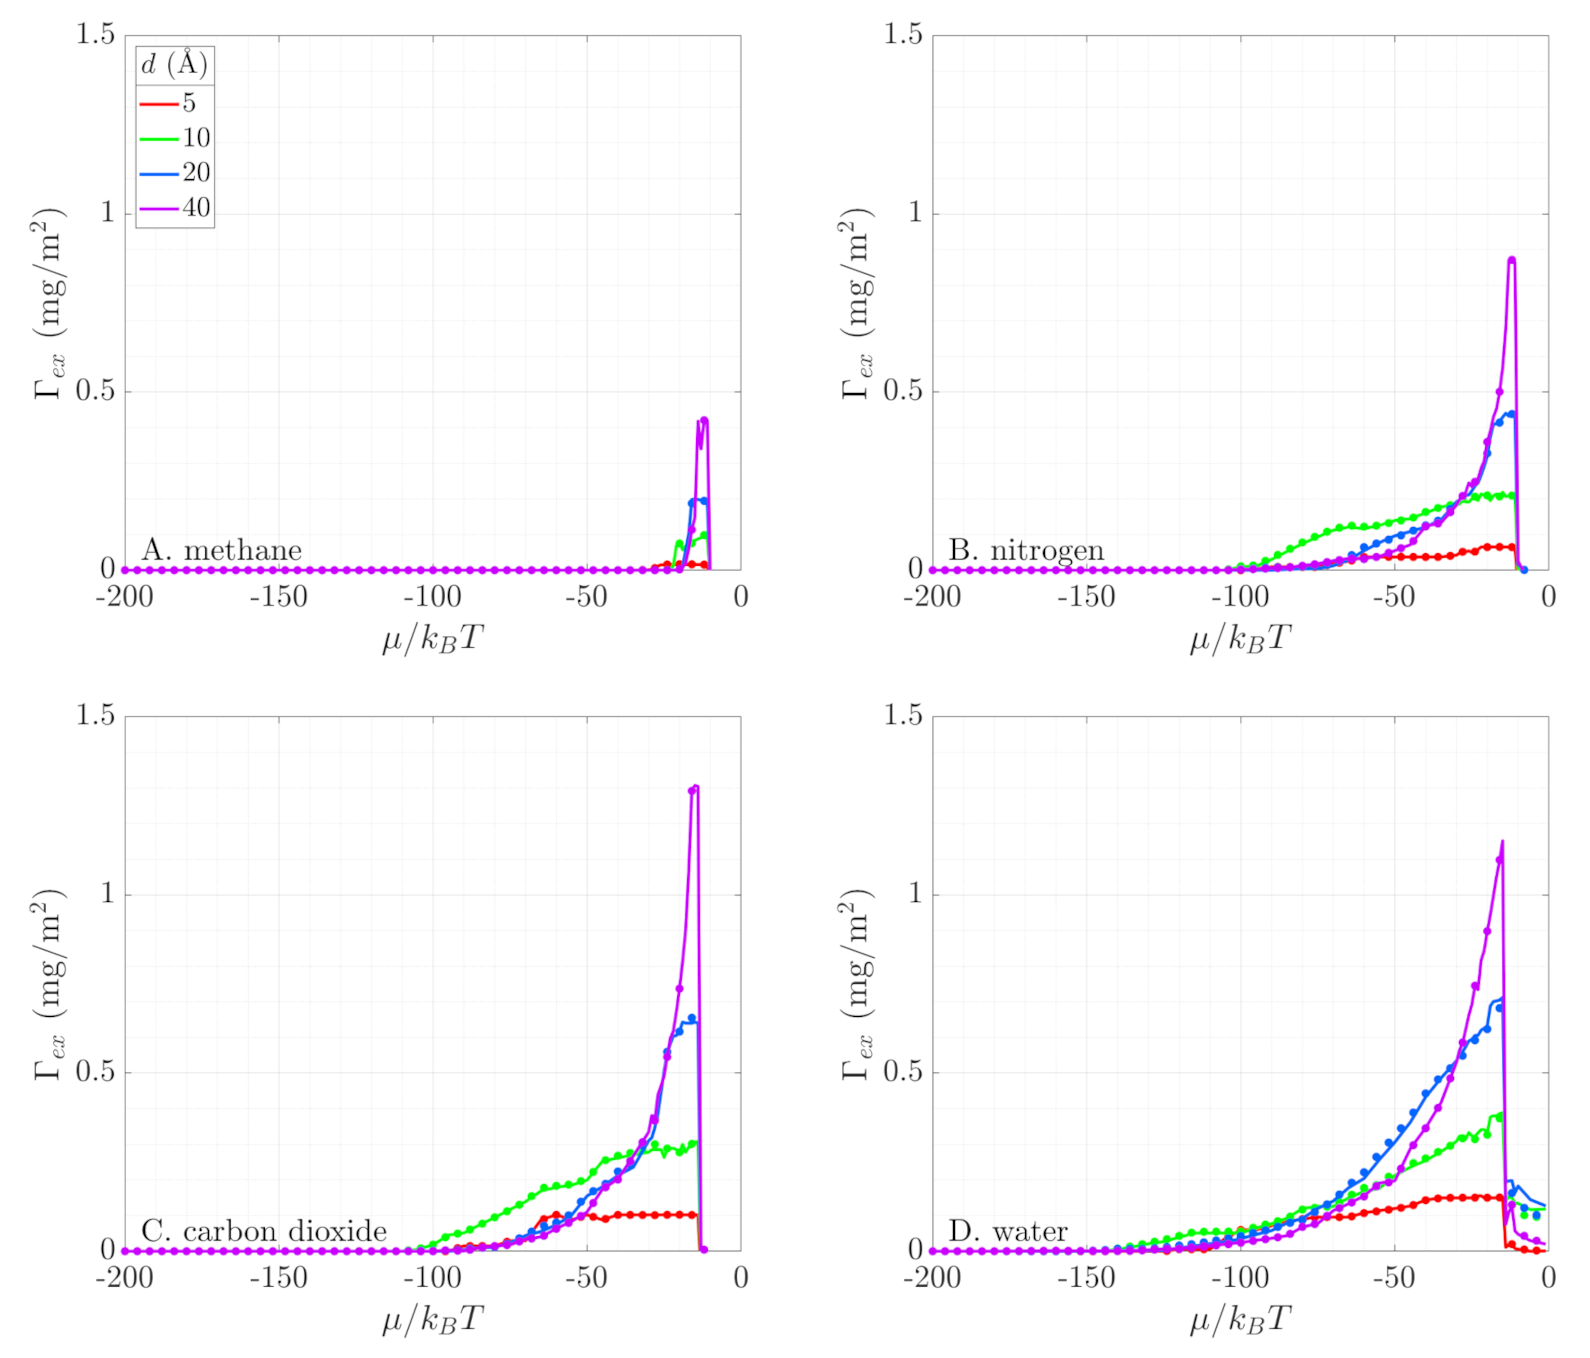
The excess adsorption is a physical quantity that defines the additional amount of fluid adsorbed in a pore of given volume as compared to a bulk fluid at the same thermodynamic condition [54]. We normalize this quantity with the surface area of the pore, such that the impact of tight confinement can be discussed. To calculate the excess adsorption from GCMC simulations, we run both simulations of confined fluid and of bulk fluid and use those density values in the following equation:
Figure 7 compares the excess adsorption obtained from numerical simulations (solid lines) with its geometric reconstruction using Minkowski functionals (symbols). The two compare very well for all four fluids. The results show that the pore size directly affects the extent to which fluid can be adsorbed, mostly by preventing fluid molecules from entering the smallest pores because of their physical size. However, in pores of 10-Å diameter, the strong fluid–wall interactions push most molecules to the pore center and limit the formation of well-defined adsorption layers (Figure 5). These interactions result in less excess adsorption in pores whose geometrical size does not mechanically act as a molecular sieve. Thus, in the range of conditions where only adsorption layers exist in the pore, the storage capacity does not substantially change with pore size. But, we emphasize that because of the larger volume-to-area ratio, larger pores can store more fluid after the onset of capillary condensation (Figure 7), supporting the enhanced hydrocarbon estimates by Chen et al. [9].
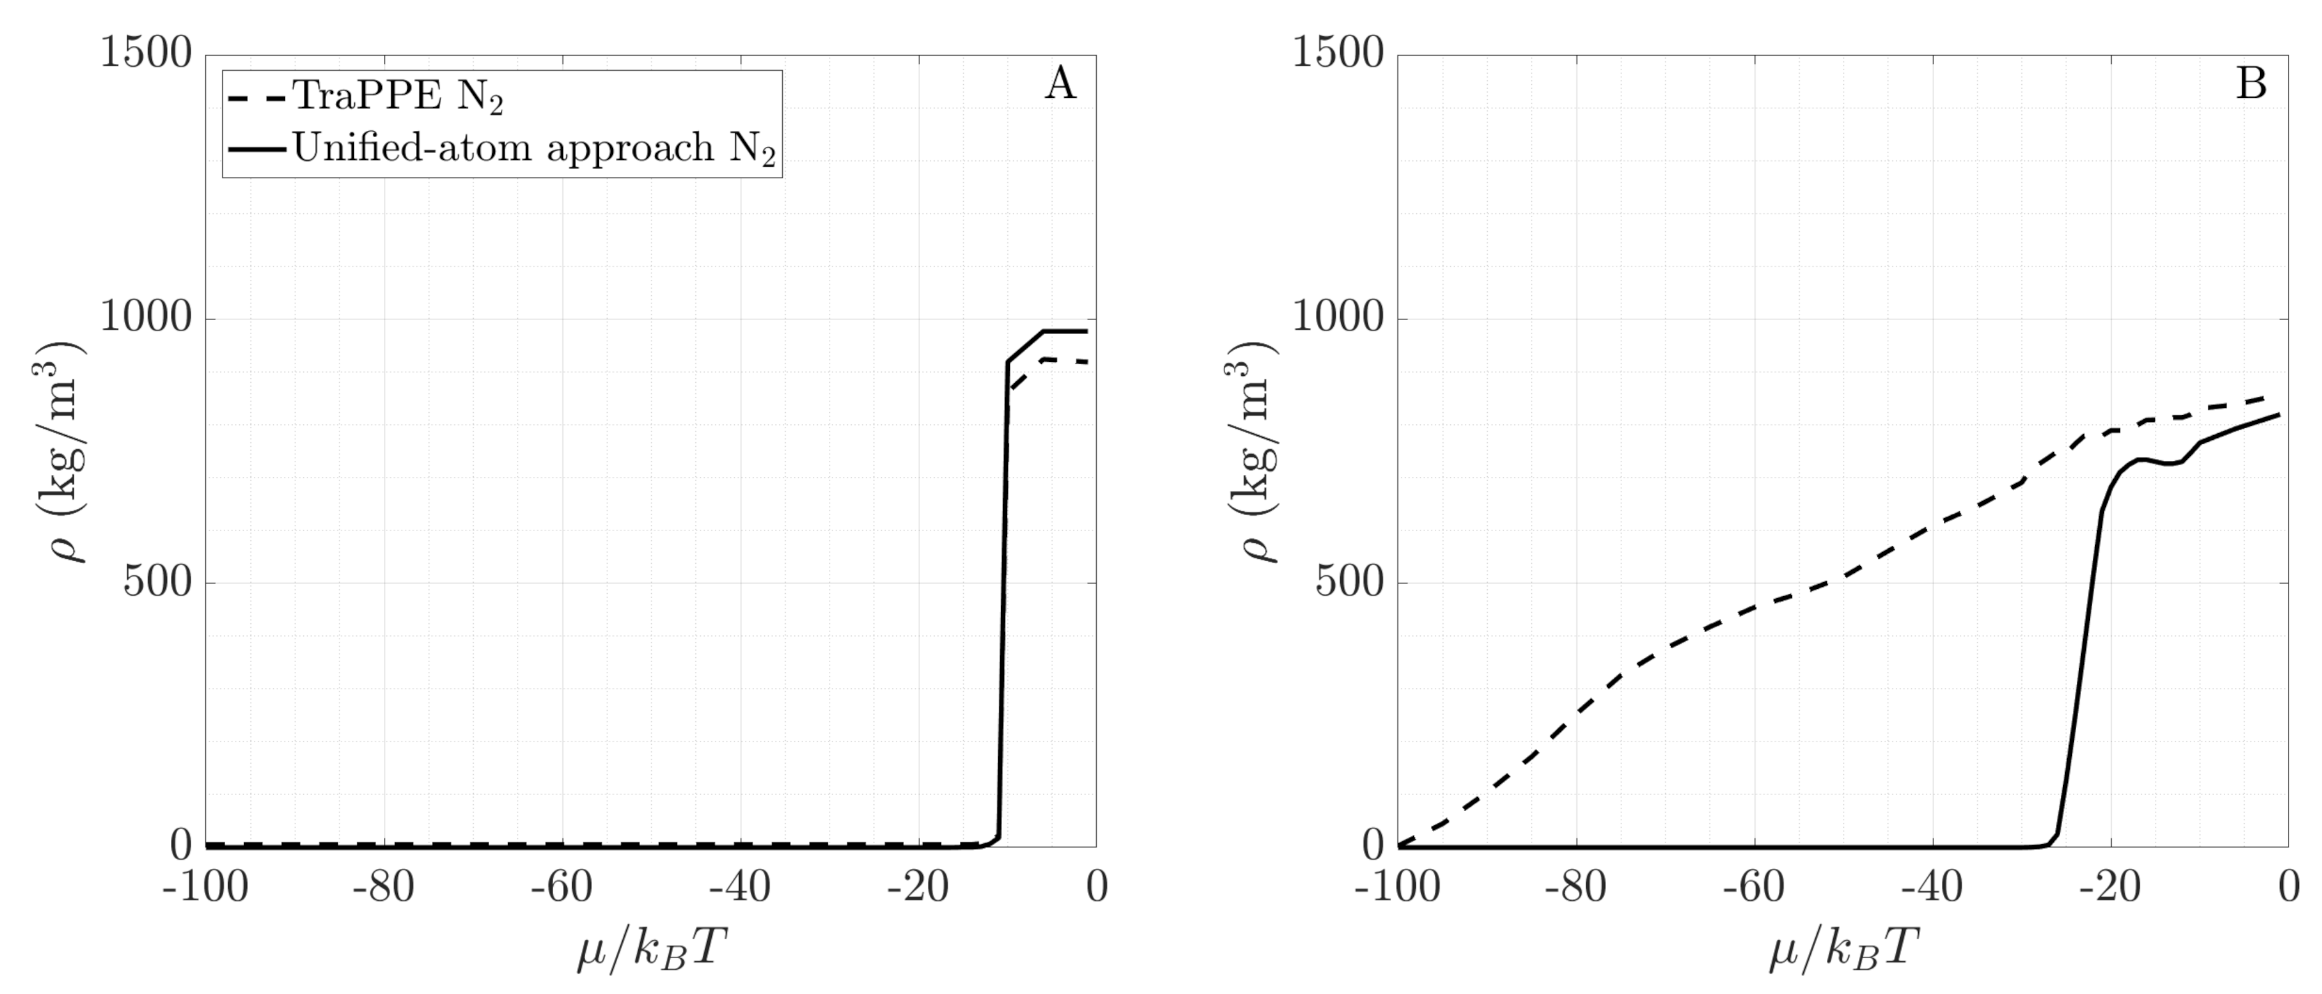
Fluids with large electrostatic moments, such as water, start to adsorb at significantly lower pressure (i.e., lower chemical potential) and form more adsorption layers before the onset of capillary condensation than fluids with no or very low electrostatic moments, such as methane. To further demonstrate that the electrostatic interactions lead to this difference in adsorption behavior, we compare the adsorption behavior of two nitrogen models. These additional GCMC simulations model nitrogen without atomic charges. This model was used in the DFT simulations of Boelens and Tchelepi [25] and follows the unified-atom (UA) approach. The particles interact solely via the Lennard-Jones potential with K and Å. Figure 8A compares the bulk fluid density of TraPPE N2 (used in our study) and the UA N2 model. Both models accurately capture the phase transition of bulk nitrogen at 77 K. Next, Figure 8B shows the fluid density inside a 10-Å-diameter SiO2 pore for both models. The significant difference between the density curves in the pore suggests that electrostatic forces have a strong influence on adsorption for non-polar fluids. On one hand, TraPPE nitrogen, where individual atoms have charge and the molecule has a quadrupole moment, starts adsorbing at low pressures and forms adsorption layers as the pressure increases. On the other hand, the UA nitrogen model sees minimal adsorbed fluid amount before a sharp phase transition at approximately , when the pore fills up. Therefore, we conclude that any proposed framework for describing phase behavior in nanoporous materials must accurately capture the impact of the molecular electrostatic interactions. Similar observations were reported by Hackett and Hammond [55], who examined the adsorption of different nitrogen models in zeolites.
3.4. Toward Real Systems
This work has focused on cylindrical SiO2 pores as a model for quartz grains in the shale solid matrix. Similar models have been informative for reproducing observations from real shale rocks with similar pore size and geochemical composition [56]. Yet, the nature of the shale pore network is complex and disordered [11]. The variation of pore morphology and topology in the shale rock influences the conditions under which capillary condensation would occur in the system as a whole. A number of models have been developed to explore this relationship in a statistical manner for heterogeneous, disordered systems at the meso- and larger length scales [30,31,57]. Despite the significance of these theoretical findings, Gommes and Roberts [31] call for further validation of their model against experimental small-angle scattering data. The disorder of the porous material acts as an environmental noise source, which has been reported to have a positive role in condensed matter systems. Spagnolo et al. [32] found that noise can extend the lifetime of metastable states in fluctuating systems. Future studies are needed to explore how environmental noise sources affect metastable states of sorption phenomena under tight confinement. Coasne et al. [11] discussed the phase behavior of fluids confined in porous silica and considered how morphological and topological disorder affects phase phenomena. These effects include delayed phase transitions and asymmetric sorption hysteresis loops. However, the authors acknowledge the significance of characterizing confined fluid behavior in regular and ordered systems as a crucial step in developing more complex, realistic models. Therefore, describing capillary condensation in cylindrical pores and other simplified geometries is an important building block for understanding confined-fluid phenomena in shale and other geologic formations [56,58,59]. The Minkowski functionals framework presented in this work can be used in the future to calculate excess adsorption and the grand potential in disordered pore networks. The Minkowski functionals are well defined (Equations (4)–(7)) for all 3D geometric shapes. Thus, the only challenge with applying this framework to a disordered pore network is theoretically resolving the additivity of the non-linear terms in Equations (9) and (12).
Furthermore, the molecular approach to studying fluid phase behavior is very sensitive to environmental fluctuations in the system. The molecular velocities in equilibrium systems always follow a distribution at finite temperatures. Experimentally, these fluctuations are enhanced by limitations in the control of macroscopic thermodynamic variables. In GCMC simulations, the computational thermostat also marks fluctuations due to the random forces [60]. Moreover, the number of molecules in the simulation box fluctuates around a mean value, introducing density fluctuations. Similar fluctuations in the number of molecules inside the pore occur in adsorption experiments. Tanaka et al. [61] argued that fluctuations in experiments are larger than those in GCMC simulations, thus affecting the observed phase behavior. These fluctuations, in density or energy of the system, become large near the critical point. Furthermore, they can lead to a phase transition by pushing the system over the energy barrier for nucleation of a condensed liquid bridge or a vapor bubble inside the pore. To ensure that our simulations accurately represent the phase behavior in silica pores, we varied the chemical potential in smaller increments in regions with large change in number of molecules. Moreover, we allowed for sufficient time for the system to equilibrate inside the pore and collected statistics over 200,000 steps, as discussed in Section 2.
When studying confined fluid behavior, another important consideration is the difference in thermophysical properties between confined and bulk fluids. This difference is a result of the complex fluid–solid interactions that occur inside the pores, especially under tight confinement, in addition to the fluid–fluid interactions that are found in bulk fluids. One example of how confinement influences fluids’ thermophysical properties is the shift in the phase envelope. This shift has been well-documented for various fluids in the literature [12,14]. While it is out of scope for the present study to map the shift of the phase envelope across a range of temperatures, we observe the gas-liquid transition occurring at different chemical potentials (different pressures) along the studied isotherms as a function of the pore diameter. Most notably, the smallest pores undergo first-order liquid-gas transition first at a low chemical potential. As the pore size is increased, the chemical potential at which a gas-liquid phase transition occurs is monotonously growing (Figure 7).
The density of the confined liquid phase fluid is also different from the liquid phase fluid at the same chemical potential and temperature in the bulk. Chiang et al. [58] employed small-angle neutron scattering measurements to show that the density of liquid deuterated methane (CD4) in mesoporous silica is lower than that of liquid bulk CD4. A similar conclusion was reached theoretically by Tan and Piri [62], who studied CO2 and n-pentane under confinement via the perturbed-chain statistical associating fluid theory (PC-SAFT) coupled with the Young-Laplace equation. In our simulations (Figure 7), we report a lower density of confined liquids compared to their bulk equivalents for CH4, N2, and CO2. Water, however, exhibits the opposite behavior where liquid water under confinement is denser than in the bulk at the same temperature and chemical potential. This difference is probably a result of the surface roughness in our model combined with the molecular size. Larger molecules cannot fit within the corrugated pore surface. Moreover, as discussed in the previous section, H2O exhibits extremely close-packing, while CH4, CO2, and N2 have more pronounced valleys and peaks in their transverse density profiles (Figure 5). A further study is needed to explain why confined liquids are less dense than their bulk equivalents.
4. Conclusions
The adsorption of fluids under tight confinement is crucial for many technological and natural processes, including carbon sequestration and shale gas production. In this work, we examine how four fluids fill SiO2 nanopores. These fluids—methane, nitrogen, carbon dioxide and water—were chosen because they are commonly found in subsurface reservoirs and aquifers. Moreover, we offer a mathematical framework to describe the phase behavior of confined fluids. Expanding on the work of Boelens and Tchelepi [25], we show that a mathematical framework in terms of Minkowski functionals (volume, surface area, and integral mean curvature) can reproduce capillary condensation with good accuracy. Using geometric information for the porous rock to describe the phase behavior of different fluids paves the way for better scale translation of these processes.
Our work shows that Minkowski functionals can leverage geometric information about the pore to describe thermodynamic quantities such as the grand potential and the excess adsorption. We apply this method to both polar and non-polar fluids, and show that the molecular electrostatic moments are crucial to the adsorption layer formation. Stronger moments lead to early onset of adsorption in the pores and formation of multiple layers before the pore is entirely filled. This observation is significant because it reveals why fluid–solid interactions are important in adsorption phenomena and reasserts the importance of accurately capturing the electrostatic interactions when modeling adsorption phenomena at the molecular level. This paper presents the first application of the Minkowski functionals framework to describe the phase behavior of real fluids in 3D.
The results and the mathematical formulation presented in this work can be extended to more complex geometries. Further research is needed to investigate the effects of pore network disorder [11] and environmental noise [32] on adsorption layer formation under tight confinement. Finally, we reiterate that the non-linear terms of the Minkowski-functionals reconstructions (e.g., last two terms of Equations (9) and (12)) are not additive when a whole pore network is studied [29]. Further theoretical work is needed to address this issue.
Author Contributions
Conceptualization, F.S., A.M.P.B. and M.I.; methodology, F.S. and A.M.P.B.; software, F.S.; validation, F.S. and A.M.P.B.; formal analysis, F.S.; investigation, F.S., A.M.P.B. and M.I.; resources, M.I.; data curation, F.S.; writing—original draft preparation, F.S.; writing—review and editing, F.S., A.M.P.B. and M.I.; visualization, F.S.; supervision, M.I.; project administration, M.I.; funding acquisition, M.I. All authors have read and agreed to the published version of the manuscript.
Funding
This work was supported as part of the Center for Mechanistic Control of Water-Hydrocarbon-Rock Interactions in Unconventional and Tight Oil Formations (CMC-UF), an Energy Frontier Research Center funded by the U.S. Department of Energy, Office of Science under DOE (BES) Award DE-SC0019165.
Acknowledgments
The authors are grateful for the resources at the National Energy Research Scientific Computing Center that were utilized for this work.
Conflicts of Interest
The authors declare no conflict of interest. The funders had no role in the design of the study; in the collection, analyses, or interpretation of data; in the writing of the manuscript, or in the decision to publish the results.
References
- Barsotti, E.; Tan, S.P.; Saraji, S.; Piri, M.; Chen, J.H. A review on capillary condensation in nanoporous media: Implications for hydrocarbon recovery from tight reservoirs. Fuel 2016, 184, 344–361. [Google Scholar] [CrossRef]
- Dewers, T.; Eichhubl, P.; Ganis, B.; Gomez, S.; Heath, J.; Jammoul, M.; Kobos, P.; Liu, R.; Major, J.; Matteo, E.; et al. Heterogeneity, pore pressure, and injectate chemistry: Control measures for geologic carbon storage. Int. J. Greenh. Gas Control 2018, 68, 203–215. [Google Scholar] [CrossRef]
- Grotberg, J.B. Respiratory fluid mechanics. Phys. Fluids 2011, 23, 021301. [Google Scholar] [CrossRef] [Green Version]
- David, R.O.; Marcolli, C.; Fahrni, J.; Qiu, Y.; Perez Sirkin, Y.A.; Molinero, V.; Mahrt, F.; Brühwiler, D.; Lohmann, U.; Kanji, Z.A. Pore condensation and freezing is responsible for ice formation below water saturation for porous particles. Proc. Natl. Acad. Sci. USA 2019, 116, 8184–8189. [Google Scholar] [CrossRef] [PubMed] [Green Version]
- Scholes, C.A.; Stevens, G.W.; Kentish, S.E. Membrane gas separation applications in natural gas processing. Fuel 2012, 96, 15–28. [Google Scholar] [CrossRef]
- Nosonovsky, M.; Bhushan, B. Phase behavior of capillary bridges: Towards nanoscale water phase diagram. Phys. Chem. Chem. Phys. 2008, 10, 2137–2144. [Google Scholar] [CrossRef]
- Cai, Y.; Wang, H.E.; Huang, S.Z.; Yuen, M.F.; Cai, H.H.; Wang, C.; Yu, Y.; Li, Y.; Zhang, W.J.; Su, B.L. Porous TiO2 urchins for high performance Li-ion battery electrode: Facile synthesis, characterization and structural evolution. Electrochim. Acta 2016, 210, 206–214. [Google Scholar] [CrossRef]
- Hansen, J.P.; McDonald, I.R. Chapter 6—Inhomogeneous Fluids, 3rd ed.; Academic Press: Burlington, NJ, USA, 2006; pp. 147–177. [Google Scholar] [CrossRef]
- Chen, J.H.; Mehmani, A.; Li, B.; Georgi, D.; Jin, G. Estimation of Total Hydrocarbon in the Presence of Capillary Condensation for Unconventional Shale Reservoirs. In Proceedings of the SPE Middle East Oil and Gas Show and Conference, Manama, Bahrain, 10–13 March 2013. [Google Scholar] [CrossRef]
- Yang, G.; Chai, D.; Fan, Z.; Li, X. Capillary Condensation of Single- and Multicomponent Fluids in Nanopores. Ind. Eng. Chem. Res. 2019, 58, 19302–19315. [Google Scholar] [CrossRef]
- Coasne, B.; Galarneau, A.; Pellenq, R.J.M.; Di Renzo, F. Adsorption, intrusion and freezing in porous silica: The view from the nanoscale. Chem. Soc. Rev. 2013, 42, 4141–4171. [Google Scholar] [CrossRef]
- Burgess, C.G.V.; Everett, D.H.; Nuttall, S. Adsorption hysteresis in porous materials. Pure Appl. Chem. 1989, 61, 1845–1852. [Google Scholar] [CrossRef] [Green Version]
- Desgranges, C.; Delhommelle, J. Nucleation of Capillary Bridges and Bubbles in Nanoconfined CO2. Langmuir 2019, 35, 15401–15409. [Google Scholar] [CrossRef] [PubMed]
- Singh, S.K.; Mehta, A. Corresponding state behaviour of capillary condensation of confined alkanes. Mol. Simul. 2019, 45, 1014–1028. [Google Scholar] [CrossRef]
- Aljamaan, H.; Al Ismail, M.; Kovscek, A.R. Experimental investigation and Grand Canonical Monte Carlo simulation of gas shale adsorption from the macro to the nano scale. J. Nat. Gas Sci. Eng. 2017, 48, 119–137. [Google Scholar] [CrossRef]
- Matamoros-Veloza, A.; Newton, R.J.; Benning, L.G. What controls selenium release during shale weathering? Appl. Geochem. 2011, 26, S222–S226. [Google Scholar] [CrossRef]
- Morishige, K.; Fujii, H.; Uga, M.; Kinukawa, D. Capillary Critical Point of Argon, Nitrogen, Oxygen, Ethylene, and Carbon Dioxide in MCM-41. Langmuir 1997, 13, 3494–3498. [Google Scholar] [CrossRef]
- Morishige, K.; Ito, M. Capillary condensation of nitrogen in MCM-41 and SBA-15. J. Chem. Phys. 2002, 117, 8036–8041. [Google Scholar] [CrossRef]
- Wang, H.; Qu, Z.; Yin, Y.; Bai, J.; Yu, B. Review of Molecular Simulation Method for Gas Adsorption/desorption and Diffusion in Shale Matrix. J. Therm. Sci. 2019, 28, 1–16. [Google Scholar] [CrossRef]
- Sun, H.; Sun, W.; Zhao, H.; Sun, Y.; Zhang, D.; Qi, X.; Li, Y. Adsorption properties of CH4 and CO2 in quartz nanopores studied by molecular simulation. RSC Adv. 2016, 6, 32770–32778. [Google Scholar] [CrossRef]
- Zhao, J.; Wang, Z.; Guo, P.; Luo, Q. Molecular level investigation of methane and carbon dioxide adsorption on SiO2 surface. Comput. Mater. Sci. 2019, 168, 2130220. [Google Scholar] [CrossRef]
- Fisher, L.R.; Gamble, R.A.; Middlehurst, J. The Kelvin equation and the capillary condensation of water. Nature 1981, 290, 575–576. [Google Scholar] [CrossRef]
- Puibasset, J.; Pellenq, R.J.M. Water adsorption on hydrophilic mesoporous and plane silica substrates: A grand canonical Monte Carlo simulation study. J. Chem. Phys. 2003, 118, 5613–5622. [Google Scholar] [CrossRef]
- Bonnaud, P.A.; Coasne, B.; Pellenq, R.J.M. Molecular simulation of water confined in nanoporous silica. J. Phys. Condens. Matter 2010, 22, 284110. [Google Scholar] [CrossRef] [PubMed]
- Boelens, A.M.P.; Tchelepi, H.A. Minkowski Functionals for Phase Behavior under Confinement. arXiv 2020, arXiv:2004.01344. [Google Scholar]
- Raju, M.; van Duin, A.; Ihme, M. Phase transitions of ordered ice in graphene nanocapillaries and carbon nanotubes. Sci. Rep. 2018, 8, 2045–2322. [Google Scholar] [CrossRef]
- Kim, S.; Kim, D.; Kim, J.; An, S.; Jhe, W. Direct Evidence for Curvature-Dependent Surface Tension in Capillary Condensation: Kelvin Equation at Molecular Scale. Phys. Rev. X 2018, 8, 041046. [Google Scholar] [CrossRef] [Green Version]
- Jin, Z.; Firoozabadi, A. Effect of water on methane and carbon dioxide sorption in clay minerals by Monte Carlo simulations. Fluid Phase Equilibria 2014, 382, 10–20. [Google Scholar] [CrossRef]
- Mecke, K.R. Additivity, Convexity, and Beyond: Applications of Minkowski Functionals in Statistical Physics. In Statistical Physics and Spatial Statistics; Mecke, K.R., Stoyan, D., Eds.; Springer: Berlin/Heidelberg, Germany, 2000; pp. 111–184. [Google Scholar]
- Gommes, C.J. Stochastic models of disordered mesoporous materials for small-angle scattering analysis and more. Microporous Mesoporous Mater. 2018, 257, 62–78. [Google Scholar] [CrossRef]
- Gommes, C.J.; Roberts, A.P. Stochastic analysis of capillary condensation in disordered mesopores. Phys. Chem. Chem. Phys. 2018, 20, 13646–13659. [Google Scholar] [CrossRef] [Green Version]
- Spagnolo, B.; Valenti, D.; Guarcello, C.; Carollo, A.; Persano Adorno, D.; Spezia, S.; Pizzolato, N.; Di Paola, B. Noise-induced effects in nonlinear relaxation of condensed matter systems. Chaos Solitons Fractals 2015, 81, 412–424. [Google Scholar] [CrossRef]
- Schneider, R. Convex Bodies: The Brunn–Minkowski Theory; Encyclopedia of Mathematics and Its Applications; Cambridge University Press: Cambridge, UK, 2014. [Google Scholar]
- Mecke, K.; Arns, C.H. Fluids in porous media: A morphometric approach. J. Phys. Condens. Matter 2005, 17, S503–S534. [Google Scholar] [CrossRef]
- Goodstein, D.L. States of Matter; Prentice-Hall: Upper Saddle River, NJ, USA, 1975. [Google Scholar]
- König, P.M.; Roth, R.; Mecke, K.R. Morphological Thermodynamics of Fluids: Shape Dependence of Free Energies. Physial Rev. Lett. 2004, 93, 160601. [Google Scholar] [CrossRef] [PubMed] [Green Version]
- Puibasset, J. Grand Potential, Helmholtz Free Energy, and Entropy Calculation in Heterogeneous Cylindrical Pores by the Grand Canonical Monte Carlo Simulation Method. J. Phys. Chem. B 2005, 109, 480–487. [Google Scholar] [CrossRef] [PubMed]
- Plimpton, S. Fast Parallel Algorithms for Short-Range Molecular Dynamics. J. Comput. Phys. 1995, 117, 1–19. [Google Scholar] [CrossRef] [Green Version]
- LAMMPS Documentation. 2020. Available online: https://lammps.sandia.gov/ (accessed on 5 October 2020).
- Sing, K. The use of nitrogen adsorption for the characterisation of porous materials. Colloids Surf. A Physicochem. Eng. Asp. 2001, 187–188, 3–9. [Google Scholar] [CrossRef]
- Martin, M.G.; Siepmann, J.I. Transferable Potentials for Phase Equilibria. 1. United-Atom Description of n-Alkanes. J. Phys. Chem. B 1998, 102, 2569–2577. [Google Scholar] [CrossRef]
- Potoff, J.J.; Siepmann, J.I. Vapor–liquid equilibria of mixtures containing alkanes, carbon dioxide, and nitrogen. AIChE J. 2001, 47, 1676–1682. [Google Scholar] [CrossRef]
- Berendsen, H.J.C.; Grigera, J.R.; Straatsma, T.P. The missing term in effective pair potentials. J. Phys. Chem. 1987, 91, 6269–6271. [Google Scholar] [CrossRef]
- Cygan, R.T.; Liang, J.J.; Kalinichev, A.G. Molecular models of hydroxide, oxyhydroxide, and clay phases and the development of a general force field. J. Phys. Chem. B 2004, 108, 1255–1266. [Google Scholar] [CrossRef]
- Bourg, I.C.; Steefel, C.I. Molecular dynamics simulations of water structure and diffusion in silica nanopores. J. Phys. Chem. C 2012, 116, 11556–11564. [Google Scholar] [CrossRef] [Green Version]
- Bui, T.; Phan, A.; Cole, D.R.; Striolo, A. Transport Mechanism of Guest Methane in Water-Filled Nanopores. J. Phys. Chem. C 2017, 121, 15675–15686. [Google Scholar] [CrossRef] [Green Version]
- Fang, H.; Kulkarni, A.; Kamakoti, P.; Awati, R.; Ravikovitch, P.I.; Sholl, D.S. Identification of high-CO2-capacity cationic zeolites by accurate computational screening. Chem. Mater. 2016, 28, 3887–3896. [Google Scholar] [CrossRef]
- Javanbakht, G.; Sedghi, M.; Welch, W.; Goual, L. Molecular Dynamics Simulations of CO2/Water/Quartz Interfacial Properties: Impact of CO2 Dissolution in Water. Langmuir 2015, 31, 5812–5819. [Google Scholar] [CrossRef] [PubMed]
- Buckingham, A.; Disch, R. The quadrupole moment of the carbon dioxide molecule. In Optical, Electric and Magnetic Properties of Molecules; Clary, D.C., Orr, B.J., Eds.; Elsevier Science B.V.: Amsterdam, The Netherlands, 1997; pp. 81–95. [Google Scholar] [CrossRef]
- Huot, J.; Bose, T.K. Determination of the quadrupole moment of nitrogen from the dielectric second virial coefficient. J. Chem. Phys. 1991, 94, 3849–3854. [Google Scholar] [CrossRef]
- Niu, S.; Tan, M.L.; Ichiye, T. The large quadrupole of water molecules. J. Chem. Phys. 2011, 134, 134501. [Google Scholar] [CrossRef] [Green Version]
- Peterson, B.K.; Gubbins, K.E. Phase transitions in a cylindrical pore. Mol. Phys. 1987, 62, 215–226. [Google Scholar] [CrossRef]
- Shampine, L.F.; Reichelt, M.W. The MATLAB ODE Suite. SIAM J. Sci. Comput. 1997, 18, 1–22. [Google Scholar] [CrossRef] [Green Version]
- Pini, R. Interpretation of net and excess adsorption isotherms in microporous adsorbents. Microporous Mesoporous Mater. 2014, 187, 40–52. [Google Scholar] [CrossRef]
- Hackett, C.; Hammond, K.D. Simulating the effect of the quadrupole moment on the adsorption of nitrogen in siliceous zeolites. Microporous Mesoporous Mater. 2018, 263, 231–235. [Google Scholar] [CrossRef]
- Qajar, A.; Daigle, H.; Prodanović, M. The effects of pore geometry on adsorption equilibrium in shale formations and coal-beds: Lattice density functional theory study. Fuel 2016, 163, 205–213. [Google Scholar] [CrossRef]
- Miele, F.; de Anna, P.; Dentz, M. Stochastic model for filtration by porous materials. Phys. Rev. Fluids 2019, 4, 094101. [Google Scholar] [CrossRef]
- Chiang, W.S.; Fratini, E.; Baglioni, P.; Georgi, D.; Chen, J.H.; Liu, Y. Methane Adsorption in Model Mesoporous Material, SBA-15, Studied by Small-Angle Neutron Scattering. J. Phys. Chem. C 2016, 120, 4354–4363. [Google Scholar] [CrossRef]
- Dantas, S.; Struckhoff, K.C.; Thommes, M.; Neimark, A.V. Phase Behavior and Capillary Condensation Hysteresis of Carbon Dioxide in Mesopores. Langmuir 2019, 35, 11291–11298. [Google Scholar] [CrossRef] [PubMed]
- Frenkel, D.; Smit, B. Understanding Molecular Simulation: From Algorithms to Applications; Computational Science, Elsevier Science: Amsterdam, The Netherlands, 2001. [Google Scholar]
- Tanaka, H.; Hiratsuka, T.; Nishiyama, N.; Mori, K.; Miyahara, M.T. Capillary condensation in mesoporous silica with surface roughness. Adsorption 2013, 19, 631–641. [Google Scholar] [CrossRef]
- Tan, S.P.; Piri, M. Equation-of-state modeling of confined-fluid phase equilibria in nanopores. Fluid Phase Equilibria 2015, 393, 48–63. [Google Scholar] [CrossRef]
Figure 1.
The restrictions of motion invariance, continuity, and additivity apply to the use of Minkowski functionals to describe spatial patterns.
Figure 1.
The restrictions of motion invariance, continuity, and additivity apply to the use of Minkowski functionals to describe spatial patterns.

Figure 2.
Comparison of our grand canonical Monte Carlo (GCMC) simulation results (symbols) for the adsorption isotherm of N2 at 77 K in a 20-Å-diameter silica pore against the experimental data from Morishige et al. [17] (solid line).
Figure 2.
Comparison of our grand canonical Monte Carlo (GCMC) simulation results (symbols) for the adsorption isotherm of N2 at 77 K in a 20-Å-diameter silica pore against the experimental data from Morishige et al. [17] (solid line).

Figure 3.
Adsorption process for CO2 (top row) and CH4 (bottom row) in silica pore with 20 Å. The snapshots are at and (L-R). The color scheme is as follows: red—oxygen, yellow—silicon, cyan—carbon, and blue—methane.
Figure 3.
Adsorption process for CO2 (top row) and CH4 (bottom row) in silica pore with 20 Å. The snapshots are at and (L-R). The color scheme is as follows: red—oxygen, yellow—silicon, cyan—carbon, and blue—methane.

Figure 4.
Maps with adsorption behavior of (A). methane, (B). nitrogen, (C). carbon dioxide, and (D). water as a function of pore size and reduced chemical potential. Different shades, bright to dark, indicate empty pore, single adsorption layer, multiple adsorption layers, and entirely filled pore.

Figure 5.
Transverse density profiles of (A). methane, (B). nitrogen, (C). carbon dioxide, and (D). water confined in cylindrical SiO2 nanopores. The x-axis shows the inward radial coordinate, r, originating from the pore wall. Only half of the pore is shown and the profile is axisymmetric.
Figure 5.
Transverse density profiles of (A). methane, (B). nitrogen, (C). carbon dioxide, and (D). water confined in cylindrical SiO2 nanopores. The x-axis shows the inward radial coordinate, r, originating from the pore wall. Only half of the pore is shown and the profile is axisymmetric.

Figure 6.
Grand potential profiles of (A). methane, (B). nitrogen, (C). carbon dioxide, and (D). water. The lines represent simulation results, while the symbols are reconstructions using Minkowski functionals. All simulations are at = 0.61 for the corresponding fluid species. The ordinates have different scales for each subfigure.

Figure 7.
The excess adsorption of fluid in three of the investigated pore sizes. Results are shown for (A). methane, (B). nitrogen, (C). carbon dioxide, and (D). water. The lines represent simulation results, while the symbols are reconstructions using Minkowski functionals. All simulations are at = 0.61 for the corresponding fluid species.

Figure 8.
Comparing two nitrogen models based on the fluid density of (A). bulk nitrogen and (B). nitrogen in a 10-Å-diameter SiO2 pore.
Figure 8.
Comparing two nitrogen models based on the fluid density of (A). bulk nitrogen and (B). nitrogen in a 10-Å-diameter SiO2 pore.


Table 1.
Summary of the force field parameters used in this work. References to the force fields are given in the text.
Table 1.
Summary of the force field parameters used in this work. References to the force fields are given in the text.
| Molecule | Particle Type | (K) | (Å) | q (e) | (kcal/mol) | (kcal/mol) |
|---|---|---|---|---|---|---|
| CH4 | CH4 | 148 | 3.730 | - | - | - |
| CO2 | C | 27 | 2.800 | 0.7000 | 5000.0 | 500.0 |
| O | 79 | 3.050 | −0.3500 | |||
| H2O | H | 0.0 | 0.000 | 0.4236 | 1000.0 | 100.0 |
| O | 78.2 | 3.166 | −0.8472 | |||
| N2 | N | 36 | 3.310 | −0.4820 | 5000.0 | 500.0 |
| Ghost | 0.0 | 0.000 | 0.9640 | |||
| SiO2 | Si | 3.302 | 2.1000 | - | - | |
| O | 78.2 | 3.166 | −1.0500 | - | - |
Table 2.
Summary of the molecular electrostatic moments for investigated fluids. The dipole is given in Debye (D) and the quadrupole moment is in Debye-Ångstrom (DÅ).
Table 2.
Summary of the molecular electrostatic moments for investigated fluids. The dipole is given in Debye (D) and the quadrupole moment is in Debye-Ångstrom (DÅ).
| Molecule | Force Field | Electrostatic Dipole (D) | Electrostatic Quadrupole (DÅ) | Reference |
|---|---|---|---|---|
| CH4 | TraPPE-UA | 0.0 | 0.0 | - |
| N2 | TraPPE | 0.0 | −1.47 | [49] |
| CO2 | TraPPE | 0.0 | −4.1 | [50] |
| H2O | SPC/E | 1.86 | 0.11 | [51] |
Publisher’s Note: MDPI stays neutral with regard to jurisdictional claims in published maps and institutional affiliations. |
© 2020 by the authors. Licensee MDPI, Basel, Switzerland. This article is an open access article distributed under the terms and conditions of the Creative Commons Attribution (CC BY) license (http://creativecommons.org/licenses/by/4.0/).
Share and Cite
MDPI and ACS Style
Simeski, F.; Boelens, A.M.P.; Ihme, M. Modeling Adsorption in Silica Pores via Minkowski Functionals and Molecular Electrostatic Moments. Energies 2020, 13, 5976. https://doi.org/10.3390/en13225976
AMA Style
Simeski F, Boelens AMP, Ihme M. Modeling Adsorption in Silica Pores via Minkowski Functionals and Molecular Electrostatic Moments. Energies. 2020; 13(22):5976. https://doi.org/10.3390/en13225976
Chicago/Turabian StyleSimeski, Filip, Arnout M. P. Boelens, and Matthias Ihme. 2020. "Modeling Adsorption in Silica Pores via Minkowski Functionals and Molecular Electrostatic Moments" Energies 13, no. 22: 5976. https://doi.org/10.3390/en13225976
Note that from the first issue of 2016, this journal uses article numbers instead of page numbers. See further details here.