Three-Dimensional Imaging and Quantification of Gas Storativity in Nanoporous Media via X-rays Computed Tomography


1
Department of Energy Resources Engineering, Stanford University, Stanford, CA 94305, USA
2
Department of Chemical Engineering & Materials Science, University of Southern California, Los Angeles, CA 90089, USA
*
Author to whom correspondence should be addressed.
Energies 2020, 13(23), 6199; https://doi.org/10.3390/en13236199
Submission received: 27 October 2020
/
Revised: 16 November 2020
/
Accepted: 20 November 2020
/
Published: 25 November 2020
(This article belongs to the Special Issue Multiscale and Multiphysics Processes in Unconventional Formations 2020)
Abstract
:This study provides the engineering science underpinnings for improved characterization and quantification of the interplay of gases with kerogen and minerals in shale. Natural nanoporous media such as shale (i.e., mudstone) often present with low permeability and dual porosity, making them difficult to characterize given the complex structural and chemical features across multiple scales. These structures give nanoporous solids a large surface area for gas to sorb. In oil and gas applications, full understanding of these media and their sorption characteristics are critical for evaluating gas reserves, flow, and storage for enhanced recovery and CO sequestration potential. Other applications include CO capture from industrial plants, hydrogen storage on sorbent surfaces, and heterogeneous catalysis in ammonia synthesis. Therefore, high-resolution experimental procedures are demanded to better understand the gas–solid behavior. In this study, CT imaging was applied on the sub-millimeter scale to shale samples (Eagle Ford and Wolfcamp) to improve quantitative agreement between CT-derived and pulse decay (mass balance) derived results. Improved CT imaging formulations are presented that better match mass balance results, highlighting the significance of gas sorption in complex nanoporous media. The proposed CT routine implemented on the Eagle Ford sample demonstrated a 17% error reduction (22% to 5%) when compared to the conventional CT procedure. These observations are consistent in the Wolfcamp sample, emphasizing the reliability of this technique for broader implementation of digital adsorption studies in nanoporous geomaterials.
1. Introduction
Nanoporous materials are ubiquitous throughout industrial applications, such as separations and catalysis, and in natural settings including energy resources. In unconventional shale resources, pore sizes may be on the order of a nm but properties vary over greater length scales (micrometer to millimeter). Characterization of static and dynamic properties over multiple spatial scales is frustrated by the inherent trade off in imaging between image resolution and sample size. X-rays computed tomography (CT) has the potential to provide quantitative details of in situ properties, such as porosity (void fraction), with fine spatial resolution over macroscopic length scales; however, processing of CT images to obtain such details is frustrated by gas sorption. Improved methods of laboratory scale characterization of shale samples are motivated by small ultimate recovery factors of 20–30% of gas resources and the rapid decline in production rates [1,2]. An increased understanding and characterization of nanoporous geomaterials is foundational to developing methods that improve and enhance recovery factor.
The small recovery percentage is a consequence of the tight shale matrix composed of pores with sizes ranging from 1 to 100 nm and small porosity, multi-phase flow blocking, clay swelling, slow matrix-fracture diffusion, and so on [3,4,5,6]. Characterizing shale and the gases within it is difficult because most of the matrix porosity is distributed in nanopores in organic matter and clays [7]. As a result, the accessible porosity for various gases is dependent on the pore-throat size. The wide pore-size distribution in shale necessitates the use of various laboratory techniques at different scales to capture the entire range [8,9,10].
There are various methods mentioned in the literature for determining gas storativity in shale on the core (mm) scale. The pulse decay method is used often to measure shale porosity, permeability, and adsorption [11,12,13,14]. However, this technique is laborious and only provides bulk storage properties. Contrary to the pulse decay technique, X-ray Computed Tomography (CT) is capable of measuring the in situ porosity at the scale of voxels. Characterization of in situ porosity helps identify features or mineralogy associated with increased or decreased local gas storativity. Furthermore, these voxel-by-voxel porosity values represented on a 3D grid can then be averaged to yield a CT-derived bulk porosity for comparison with pulse decay derived bulk porosity. CT combined with X-ray attenuating penetrants, such as krypton (Kr), has been used in applications related to porosity, diffusion, adsorption, and enhanced recovery quantification [15,16,17,18,19,20,21]. CT shale applications also include measuring fracture apertures [22,23] and visualizing mineral dissolution [24], among many others. However, little work is found in the literature seeking to validate CT-derived results with storativity or porosity results computed via mass-balance techniques.
The ability to validate CT results with results from mass-balance methods ensures that CT depictions are consistent with mass-balance results when both methods are used concurrently. Additionally, repeated consistency provides flexibility of usage as both techniques have their benefits and drawbacks. Pulse decay experiments for samples with small permeability are often long and require extensive prior calibrations, whereas experiments involving CT are often quicker. In addition to bulk storativity, CT also quantifies and depicts local gas storativity.
In this work, we independently measure pulse decay and CT gas storativity as well as apparent porosity via the fluid substitution method [25] using Kr as a penetrant. A new CT processing method is proposed that better matches the pulse-decay mass-balance results compared to the conventional CT image processing method. CT processing and experimental procedure are detailed next. Finally, results are presented followed by conclusions.
2. Computed Tomography (CT)
Imaging of Kr apparent porosity and storativity are attainable via CT. In this section, we detail a new formulation for quantifying both Kr CT apparent porosity and storativity in shale that accounts for the attenuation of the adsorbed gas phase. A similar workflow can be adopted for other gases that strongly attenuate X-rays.
Diagnostic Methods
CT scanners generate cross-sectional images through the attenuation of X-rays. The cross-sectional images are then interpolated to produce three-dimensional images. A GE HiSpeed CT/I third generation CT scanner is used and operated at 140 kV, 120 mA, helical mode with 1 s per image exposure time. The scanner was configured to output 0.195 mm by 0.195 mm by 1 mm voxel resolution per cross-section with 1 mm distance between each slice. The large X-ray energy of 140 kV was chosen given that metals and rocks are difficult to penetrate [25].
A CT number is computed by normalizing the measured attenuation coefficient, , so that water and air have CT numbers of 0 and −1000 in Hounsfield Units (HU), respectively,
where is dimensionless HU (0.1% change in density with respect to calibration density scale), is the linear attenuation coefficient of water, and is the linear attenuation coefficient of air. The linear attenuation coefficient of a material depends on the incident X-ray intensity, the remaining detected intensity, and the thickness of the object [26,27]. X-ray sources are limited to large energies (140 kV) to minimize beam hardening that affects the linear attenuation coefficient as the incident beam intensity depends on the voltage, current, and scan time [28]. Beam hardening is an error that results from preferential attenuation of less energetic X-rays at sample interfaces. The result is a shift in detected attenuation to higher (harder) values. Typically, beam hardening appears as an apparent ring of large density material around a core image due to the abnormally large CT number measured. Therefore, 5% of the core periphery is cropped typically before any CT analysis to further mitigate this issue. Cylindrical geometry is used to avoid x-shaped artifacts [25].
Typically, water is used as a penetrant when measuring porosity using the fluid substitution method, but the extreme difficulty of injecting water through a shale sample due to its small permeability suggests the use of smaller-viscosity gases that attenuate X-rays. Kr attenuates X-rays strongly in the energy range typical of clinical CT scanners, compared to air or vacuum, and is relatively easy to use to saturate shale samples. The procedure starts by scanning a dry sample to obtain the voxel by voxel CT number of the vacuum-evacuated rock, . Then, the sample is saturated with Kr and scanned once again to get the voxel by voxel CT number of the Kr-saturated rock, . It is necessary however, to measure the CT number of gases saturating the pore network at different pressures because the CT number is typically a function of fluid density.
Shale apparent porosity is obtained conventionally as [25]:
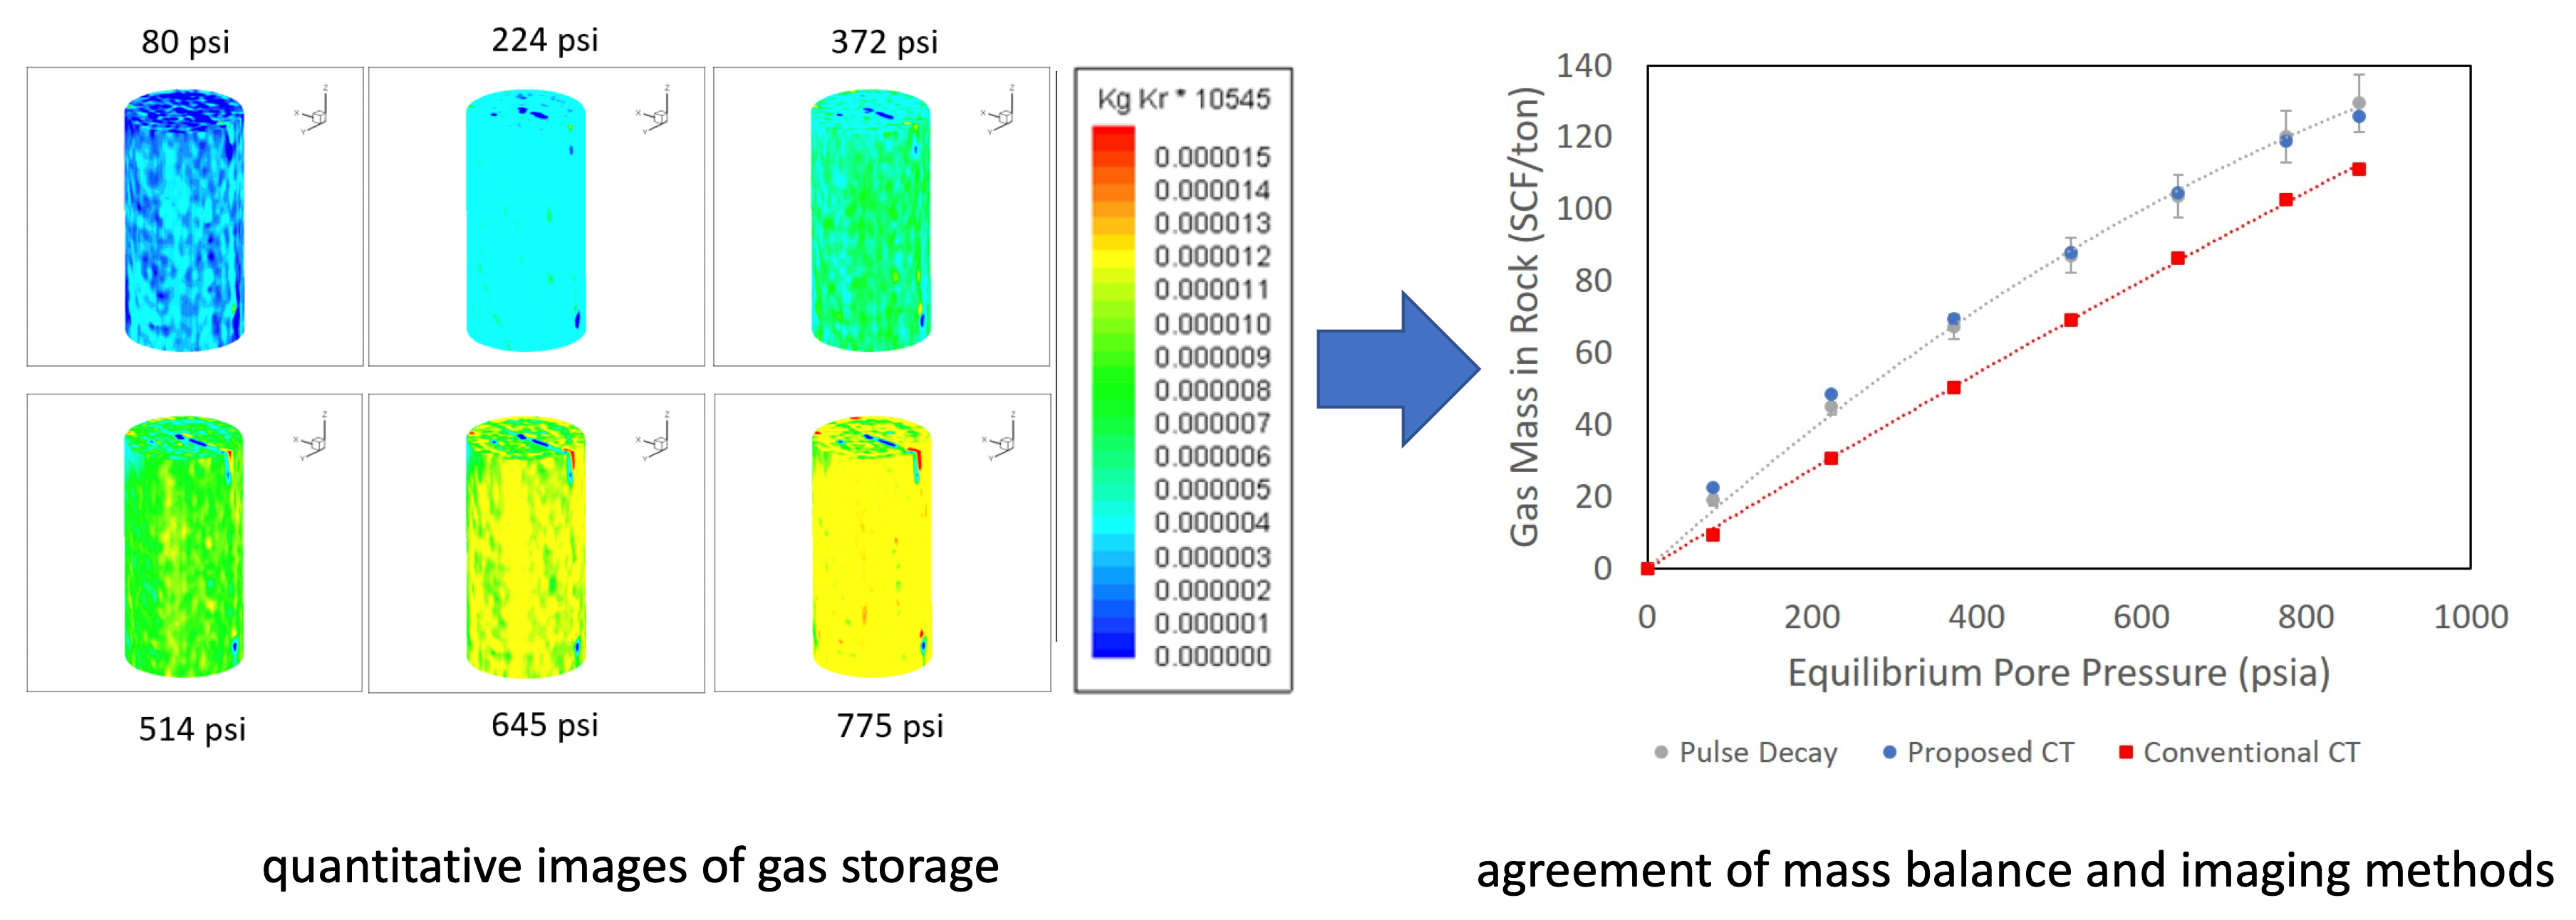
where is the CT number of pure Kr and is the CT number of air. Alnoaimi (2016) [29] measured Kr CT number at various pressures up to 200 psia. Aljamaan et al. (2017) [30] conveniently expanded this work by recording a database of pure Kr and CO at 20 C up to about 1000 psia. Correlation from Aljamaan et al. (2017) [30] was used to construct Figure 1, that shows the pure Kr CT number versus pressure at 20 C.
The CT number of pure Kr, , is usually measured by pressurizing Kr gas in a hollow aluminum core holder while recording the corresponding CT numbers. Pure Kr CT numbers acquired using this technique account for the free gas phase density only. This may lead to inaccurate values of porosity when Equation (2) is applied to adsorptive samples (e.g., high kerogen content) as the in situ Kr CT number measured captures both the free and adsorbed phases. Therefore, a new methodology is needed to capture the pure Kr CT number in an adsorptive rock that accounts for the effective attenuation from the adsorbed and free gas phases.
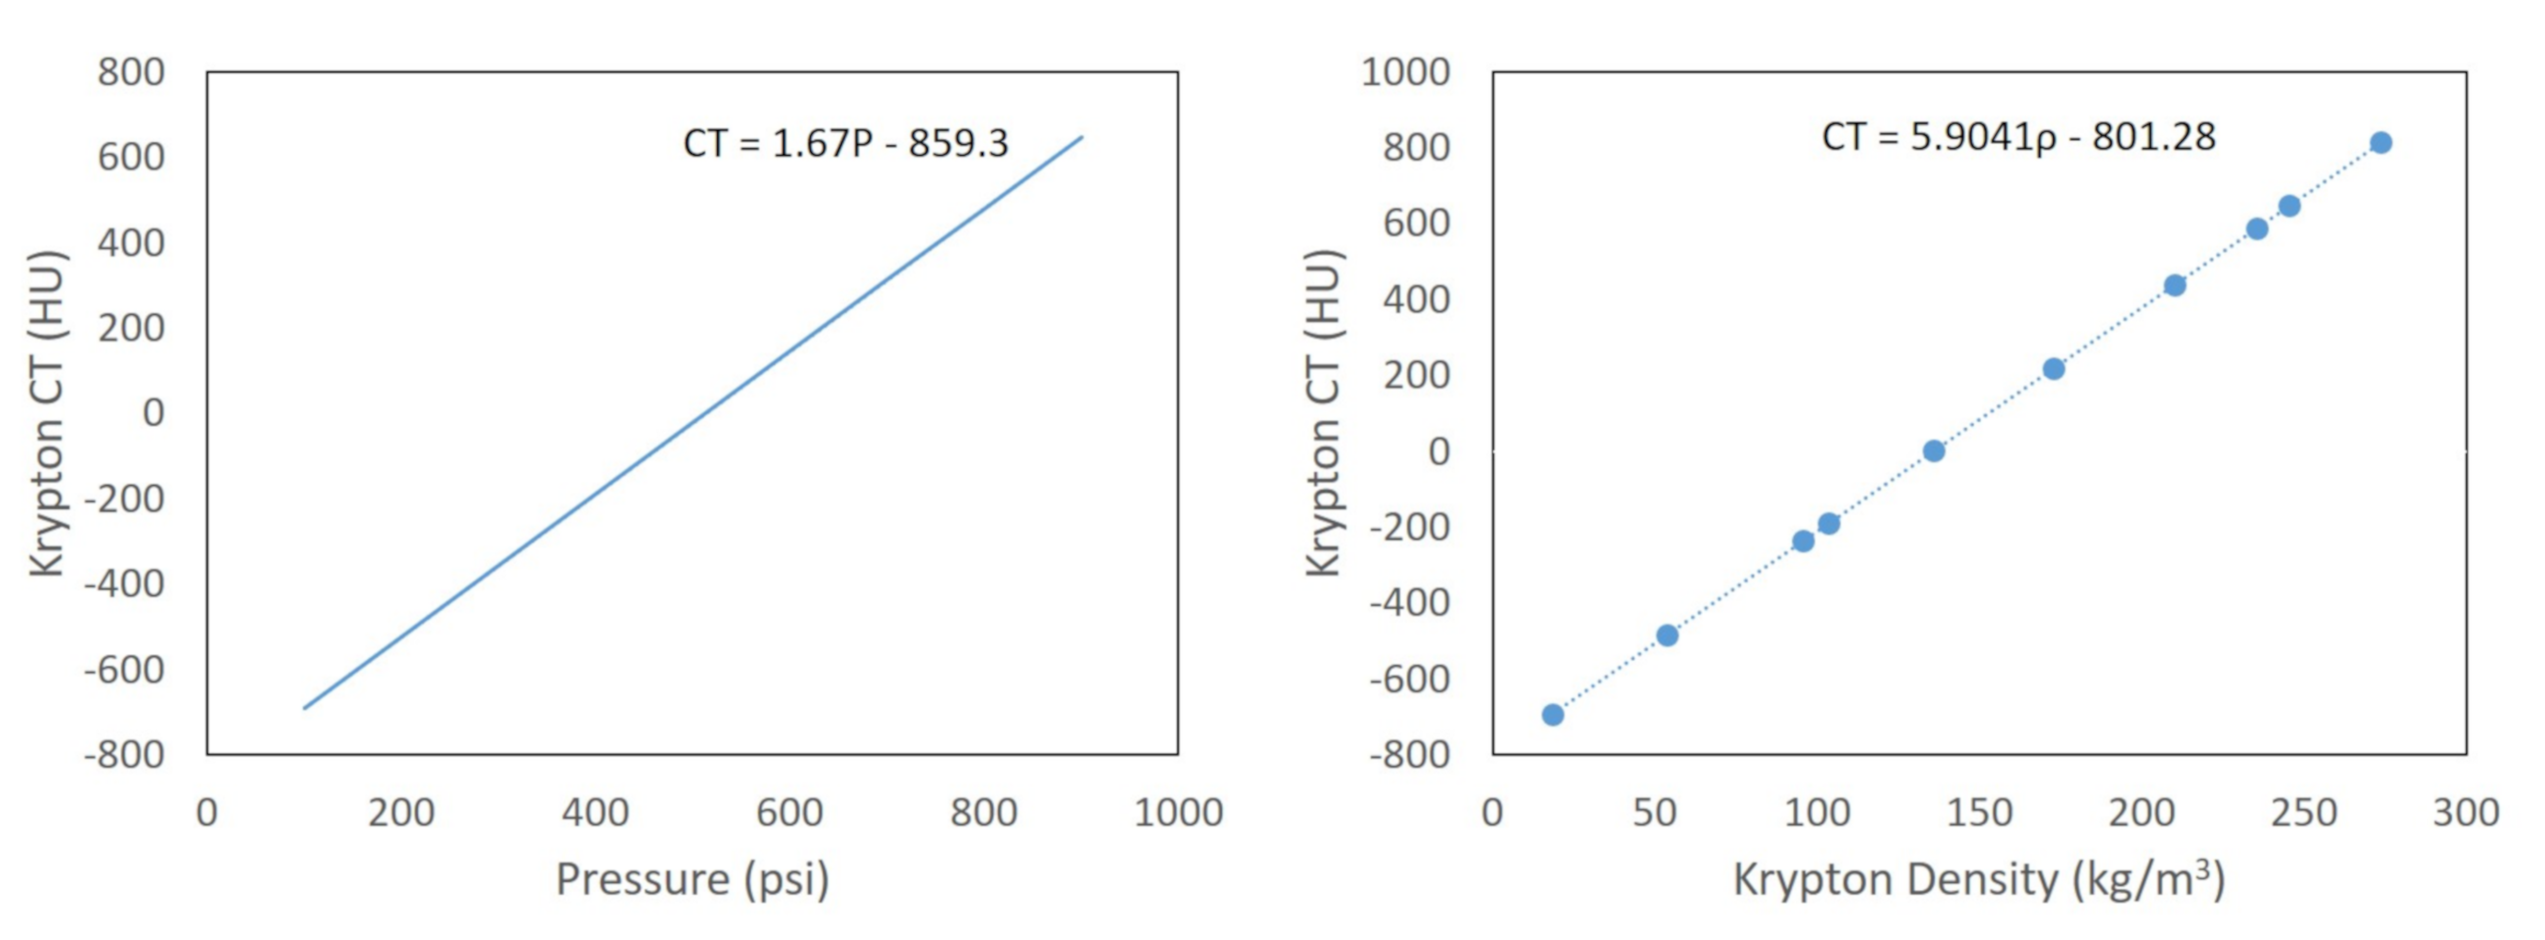
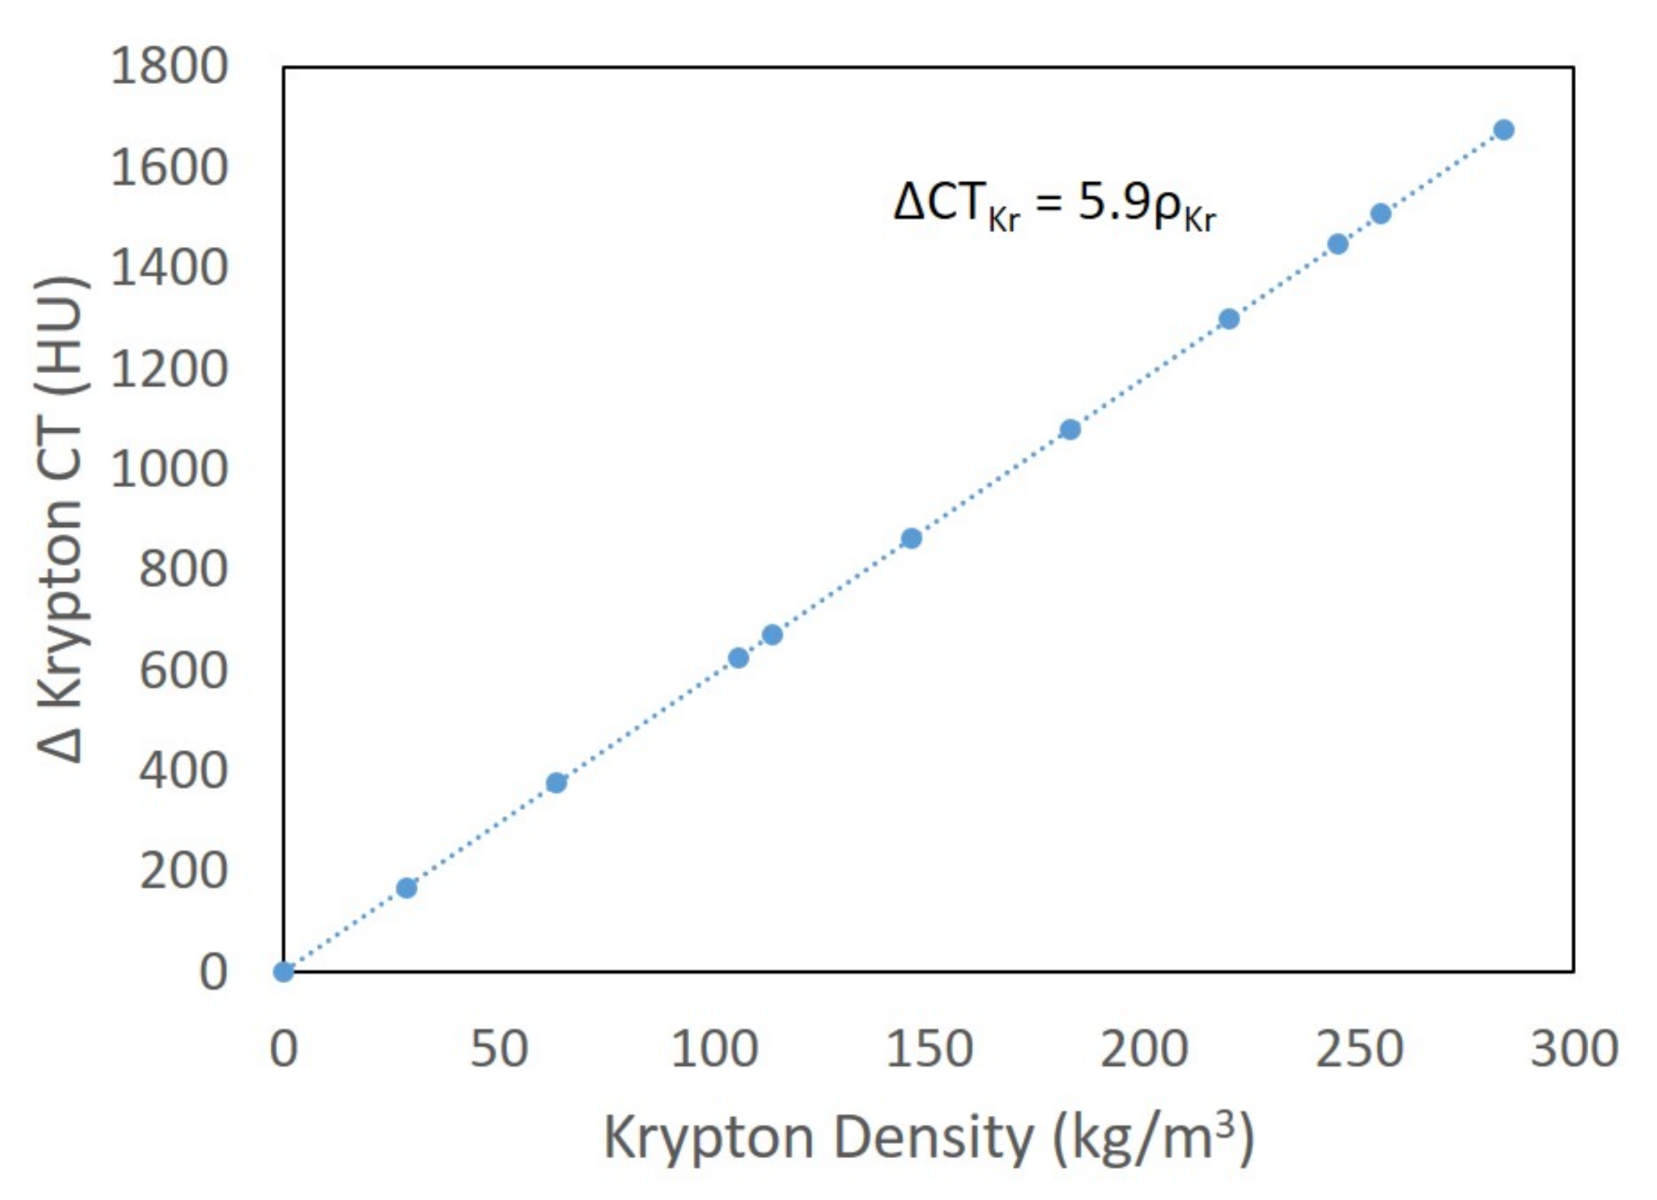
Converting Kr gas pressure values at 20 C, as shown in Figure 1(left), to their corresponding density values, Kr density can be related to pure Kr CT number as shown in Figure 1(right). The curve depicted in Figure 1 is then translated to compute the density change associated with the measured change in the CT number after Kr saturation of the rock, as shown in Figure 2. The slope, , of 5.9 HUmkg, as shown in Figure 2, is used to capture the in situ effective (free and adsorbed) density of pure Kr at a particular pore pressure given the assumption that the density–CT correlation remains linear and constant with pressure. This assumption is validated given that is approximated as [31]
where is the effective atomic number, is a constant that depends on the electron shell, is the fluid density, is the atomic weight, and is the energy of the incident photon beam. Notice that the linear attenuation coefficient is most sensitive to the effective atomic number and the energy of the incident photon beam, and it is linearly proportional to fluid density. Clearly, depends on temperature.
The voxel-by-voxel Kr density, , is computed using Equation (4)
Knowing the CT scanner voxel dimensions, the mass of Kr in each voxel, , and the total mass of Kr in the imaged rock, , are computed as shown below:
where is the voxel volume, is Kr mass in each imaged slice (cross section), is the number of voxels per slice based on the sample’s diameter, and is the number of acquired slices based on the sample’s length. The voxels cropped to eliminate artifacts are accounted for during these computations as their exclusion result in a significant loss in accuracy of mass. After reaching pressure equilibrium, the computed total Kr mass is converted to apparent Kr pore volume, , using the molecular weight of Kr, , and the real gas law:
where Z is the real gas compressibility factor, T is the temperature, is the pore pressure, and R is the universal gas constant. Finally, the apparent Kr porosity, , computed via CT is determined using Equation (9)
where is the total number of voxels in the image. We use the imaged rock dimensions instead of the true rock dimensions as a small portion of the rock periphery is cropped during analysis of porosity to mitigate beam-hardening artifacts. A more common method to quantify and compare rock storativity, , is by presenting it in standard cubic feet (SCF) of gas stored in a ton of rock. To achieve this, the computed Kr apparent pore volume is expanded to atmospheric pressure, , and divided by the imaged rock mass, (**), as shown in Equation (10),
where is the rock’s bulk density.
3. Sample Preparation
Experiments were conducted on an Eagle Ford core and a Wolfcamp core. Both cores are 2.54 cm in diameter and the lengths of the Eagle Ford and Wolfcamp samples are 4.24 and 6.35 cm, respectively. The dry weights and depths of the Eagle Ford and Wolfcamp samples are 49.8 g and 11,184 ft and 76.3 g and 9708 ft, respectively. The mineralogy of both samples is captured in Table 1.
Core samples were sleeved between two 316 L grade stainless-steel end caps with 3–4 Teflon heat-shrink tube layers. Aluminum foil was applied in between the Teflon tube layers to minimize gas diffusion between the pore space and the confining fluid. Deionized water was used as the confining fluid by injecting it in between the Teflon tube and the outer aluminum body of the core holder using an ISCO pump. The aluminum body allows for sufficient CT transparency to image the in situ rock and saturating gas. Core preparations for drying and sleeving are identical to the procedure detailed by Elkady and Kovscek (2020) [24].
4. Experimental Procedure
We characterized the rock samples porosity and storativity using the pulse decay technique detailed in Elkady and Kovscek (2020) [32]. The accuracy of the pulse decay storativity measurements depends on the pressure transducers’ precision, the accuracy of the pre-measurement of the upstream and downstream reservoir volumes, and the pore volume to reservoir volume ratio. The pressure transducers’ precision is within 1 psi and the accuracy of the upstream and downstream reservoir volumes are within 2%. The reservoir volumes were chosen to be comparable to the sample’s pore volume to achieve reasonable pressure sensitivity. Reservoir volumes that are too large result in minimal pressure change during a pressure pulse experiment, while reservoir volumes that are too small introduce very little gas into the rock resulting in small pressure buildups. The experimental setup shown in Figure 3 was designed to obtain the mass balance derived storativity. Therefore, the setup was placed on a CT table for image acquisition to compare CT-derived storativity results with the pulse decay results.
Once the core was sleeved and vacuum evacuated, a full CT scan of the rock was acquired. The upstream reservoir was then pressurized by opening the first (leftmost) valve to a Kr source while keeping the second valve closed. The first valve was then closed and the upstream pressure was monitored until the reading stabilizes. The second valve was then opened to allow Kr to pass through the core to the downstream end. The last (right-most) valve was always kept closed. The pressure upstream and downstream of the sample was recorded using pre-calibrated Precise Sensors transducers rated up to 2000 psig. A second full scan was obtained after the pore pressure remains constant with time. The equilibrium condition was identified when the upstream and downstream pressures were equal and had not changed for 6–12 h.
The confining pressure was initially set to 500 psia above the average pressure of the charged upstream and downstream reservoirs. Once a better estimate of the equilibrium pressure became apparent, the confining pressure was adjusted again during the saturation process to ensure the 500 psia effective stress at equilibrium. Successive pulses were initiated by repeating the same steps while cautiously maintaining a 500 psia effective stress. Here, instead of starting at vacuum conditions, each additional pulse added more Kr moles to the closed system, thus increasing equilibrium pore pressure, as illustrated in Figure 4 for the Eagle Ford sample. Kr successive pressure pulses were performed under the CT scanner so that the vacuum evacuated rock image and Kr-saturated rock images were acquired and used at the end of each pulse to compute the CT-derived porosity and storativity values. The CT-derived results were compared against the results obtained via mass balance. Note that the procedure and results summarized in Figure 4 are also useful to measure the matrix to fracture transfer function [33].
5. Results
This section presents the porosity and storativity results for the Eagle Ford and Wolfcamp samples obtained via CT. Comparisons are drawn against the mass balance results as well as results obtained using the conventional CT method.
Krypton Storativity via CT
We compare the pulse decay results with the proposed CT methodology for computing Kr storage capacity. This is essential as CT computed Kr apparent porosity is often referenced against helium (He) pulse decay porosity to highlight adsorption. However, there is a lack of testing to prove that both the pulse decay and CT methods are capable of producing similar results for Kr.
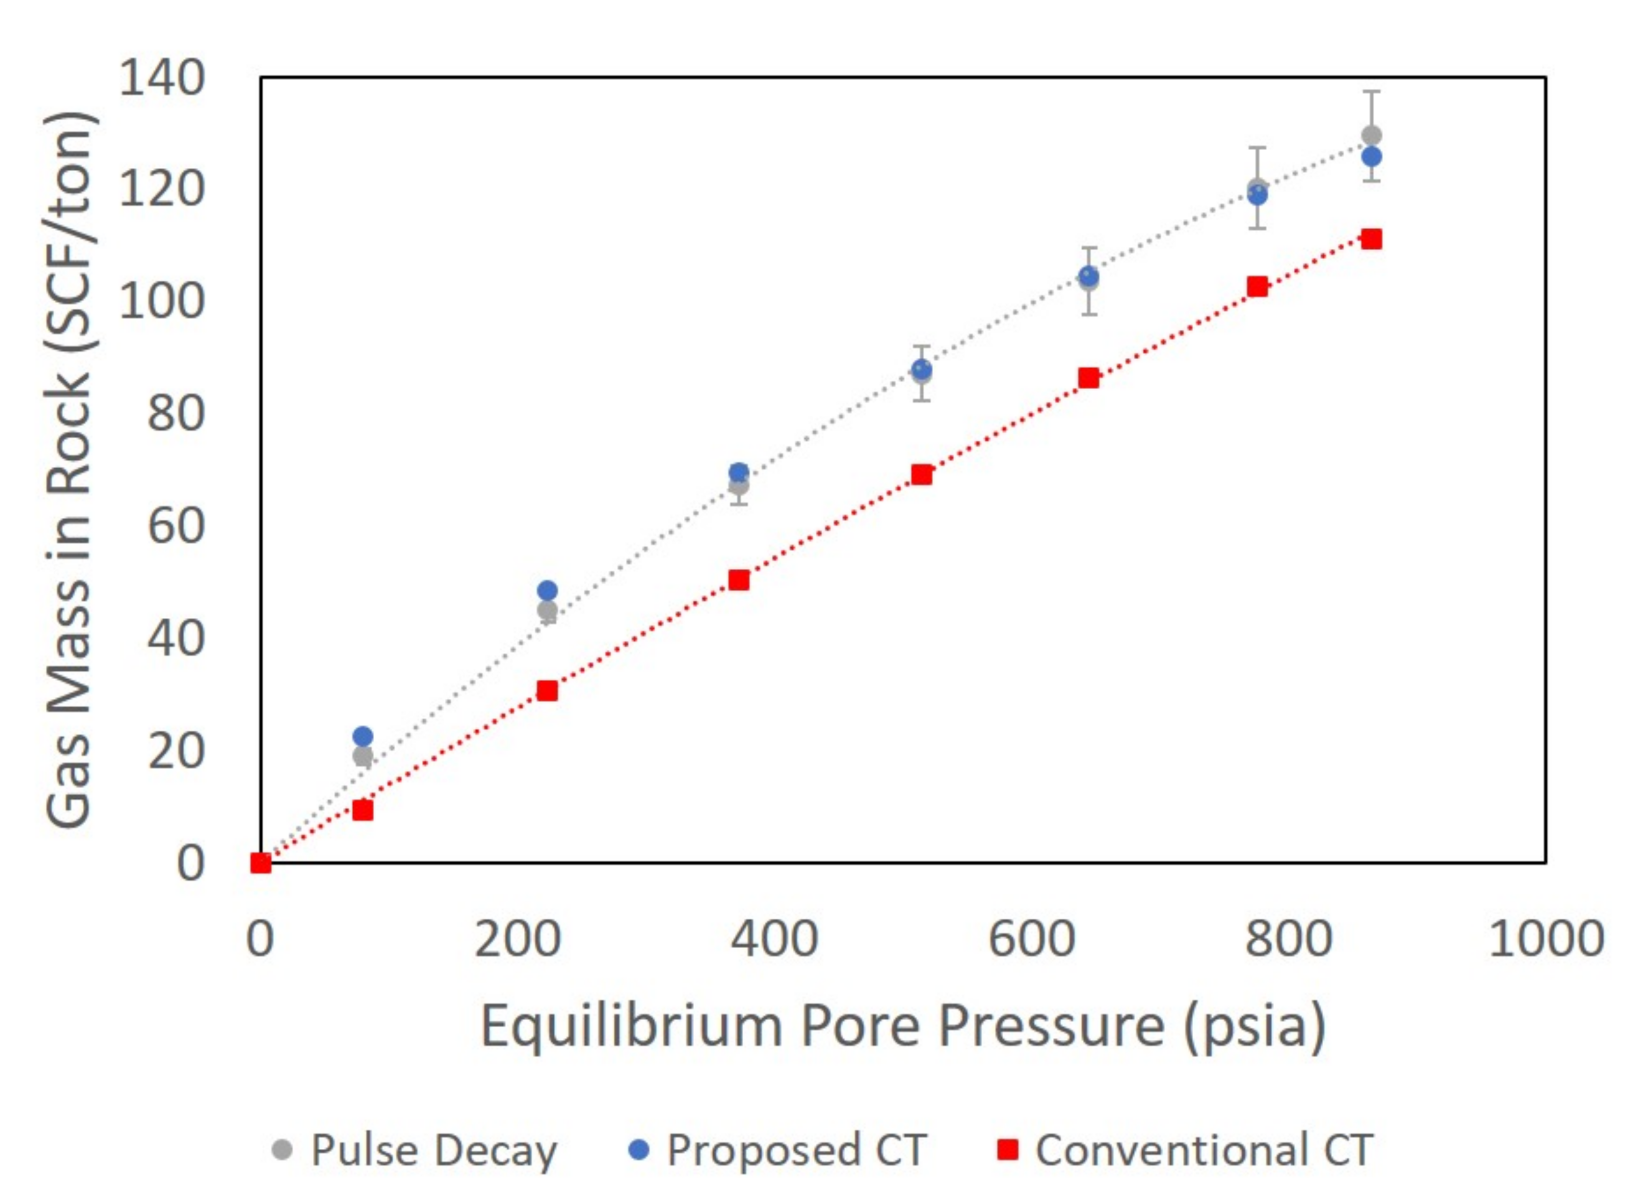
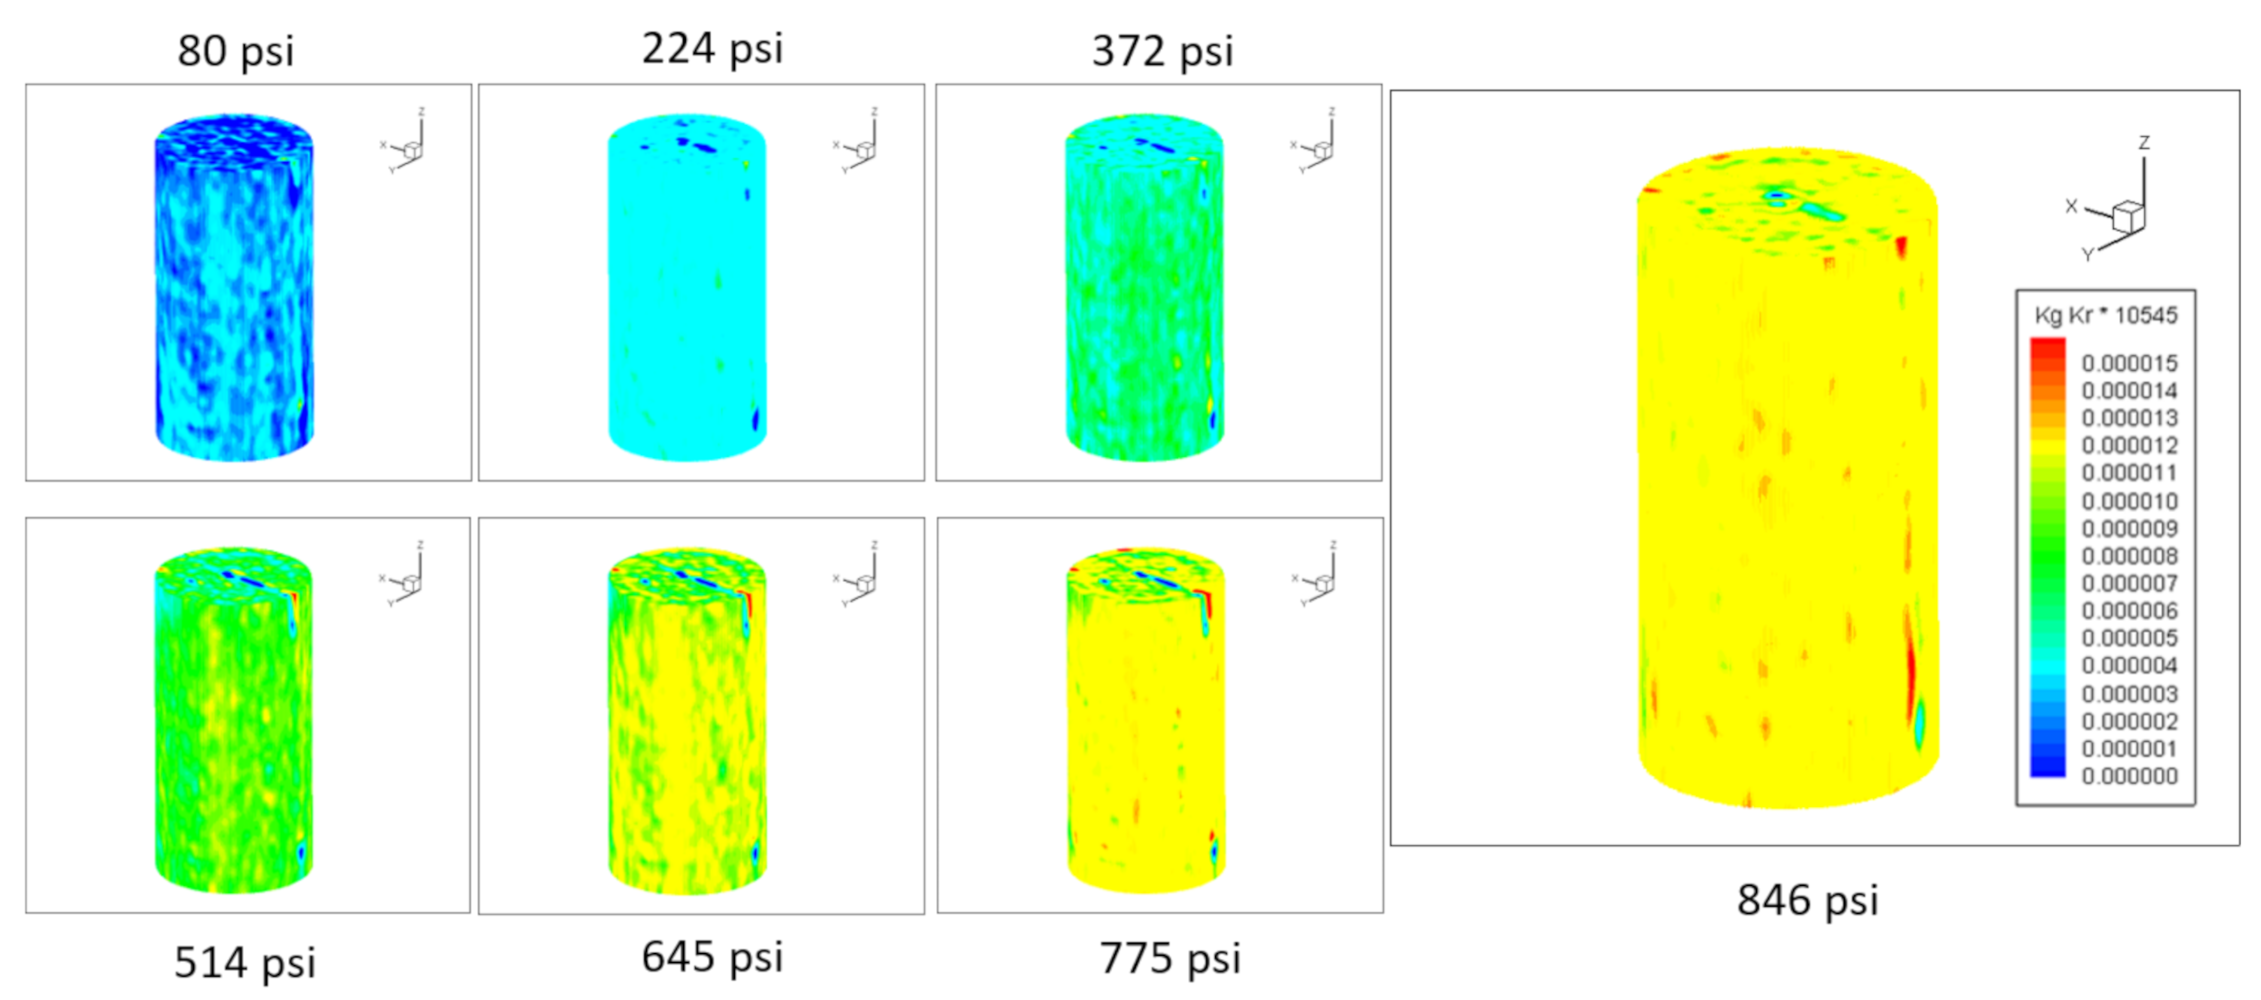
We initially used Equation (2) to compute Kr storativity via CT and realized that the both the shape and values of the curve do not match the mass balance results. Fundamentally, Equation (2) normalizes the subtracted rock images with the CT number of Kr in free phase that does not take into account the denser adsorbed phase. The proposed CT method, however, does produce a storativity curve that better matches the material balance results (within 5%) for the Eagle Ford sample, as shown in Figure 5. The proposed method captures the effect of adsorption by assuming a linear relationship between Kr density and CT number that results in effective CT numbers that lay on the curve shown in Figure 2. Therefore, an effective Kr density in each voxel is obtained directly. Knowing the voxel dimensions, the Kr mass in each voxel is visualized via CT to show areas with low and high storativity, as seen in Figure 6.
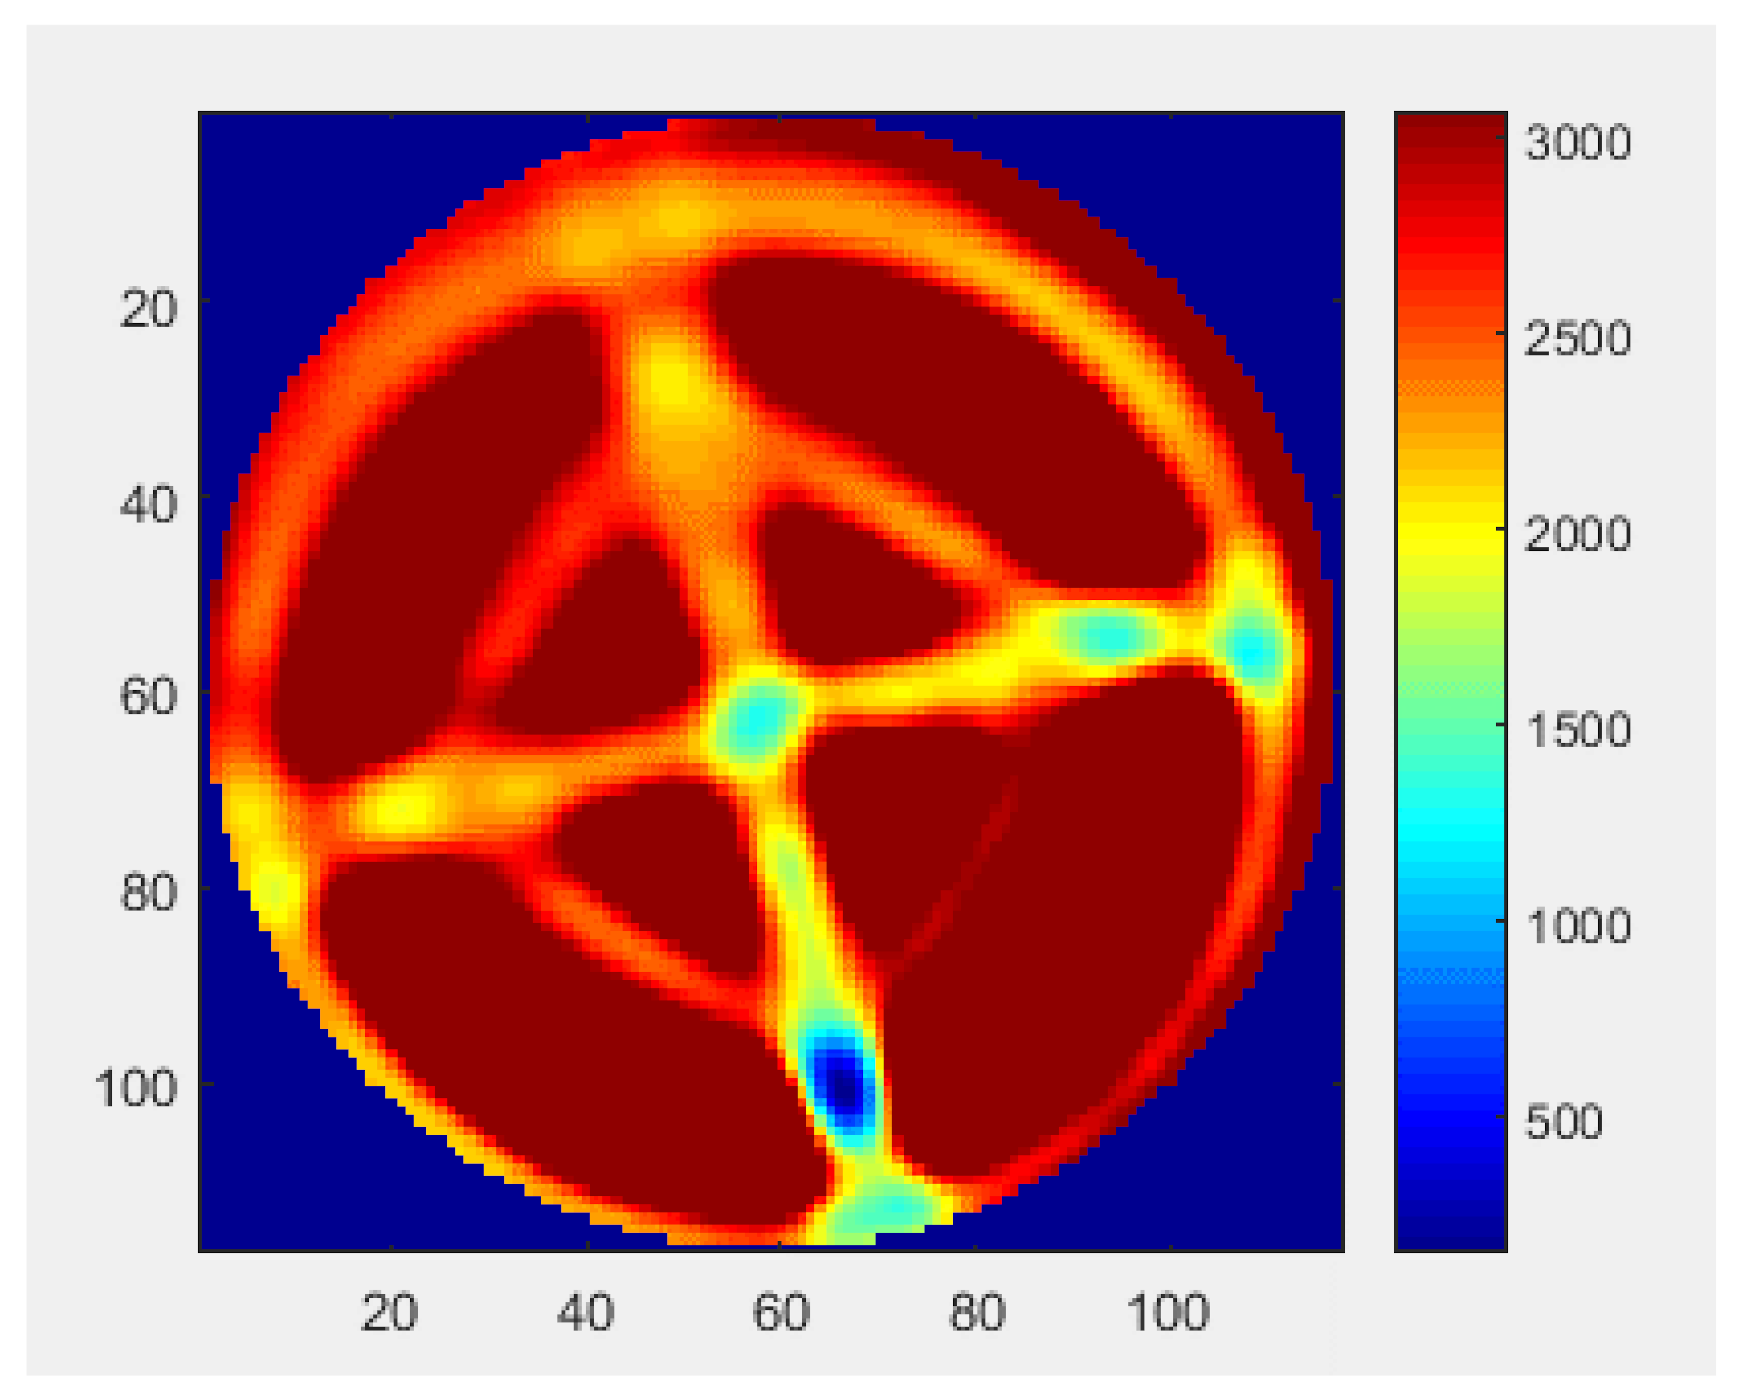
Both CT methods are corrected for 0.4 cm dead space captured by the material balance method but is invisible to the CT. This includes small volumes occurring from the slightly uneven rock surface that creates small dead pockets between the rock and end caps as well as any minuscule crevices between the rock and sleeving material. This is especially relevant given that 5% of the rock periphery is cropped out before CT analysis due to artifacts. An uneven rock surface produced during rock cutting was confirmed via CT showing a small pocket between one of the end caps and the rock (see Figure 7). In future experiments, this correction can be eliminated or reduced by precise cutting, tight sleeving of the core, and upstream and downstream reservoir volume measurements after rock sleeving.
The Wolfcamp core Kr CT porosity results are compared in Table 2 for three different pressure pulses. The Wolfcamp sample permeability was 2–3 times smaller than the Eagle Ford sample, therefore pressure pulses took longer to equilibrate. Given that the pulse decay experiments were conducted under CT, only three pressure pulses were attainable in a reasonable time frame on this multiuser scanner. Nevertheless, each data point (whether Eagle Ford or Wolfcamp) was used independently to test the new CT processing approach.
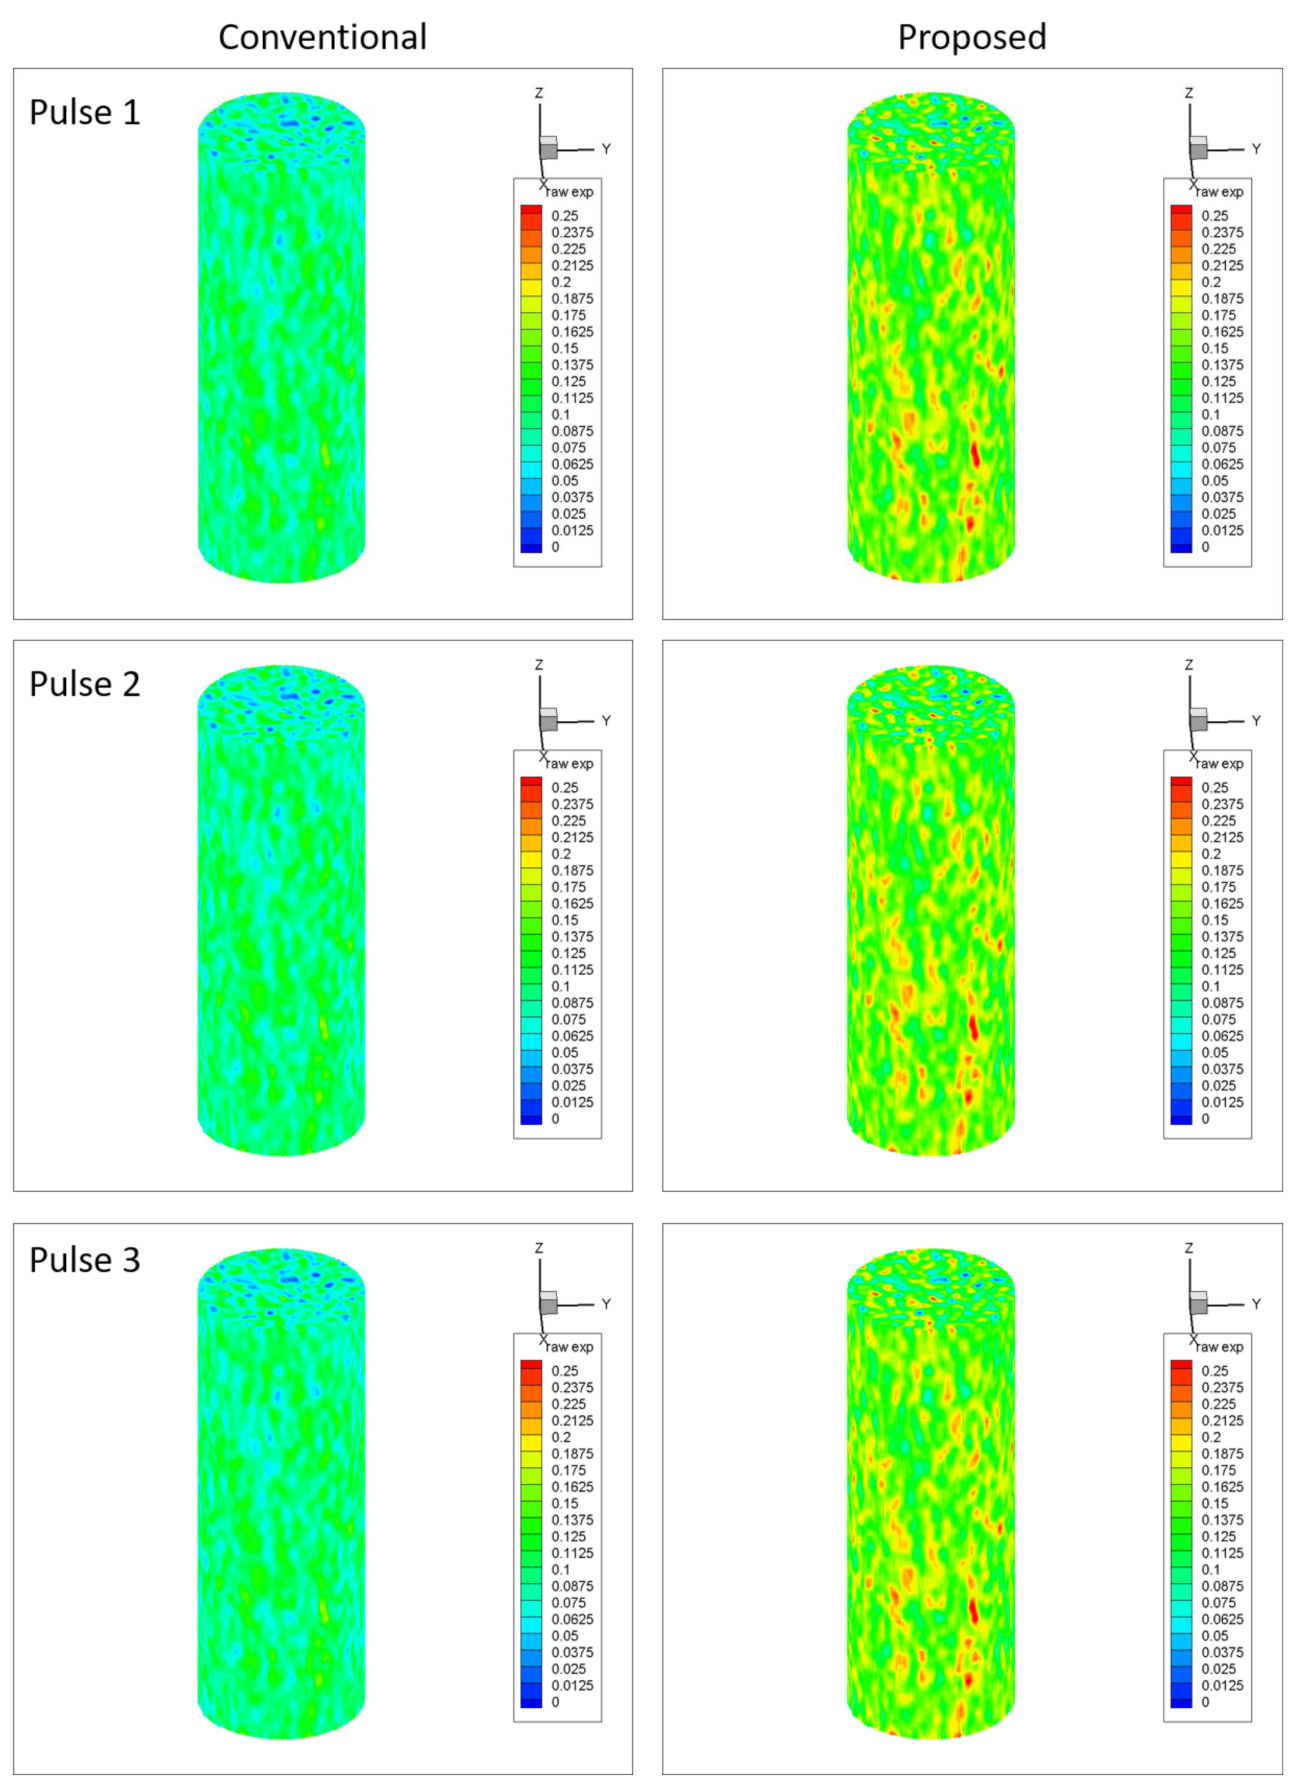
Apparent porosity is used as an alternative to storativity to illustrate that these quantities may be used interchangeably to quantify the storage capacity of the rock. The results presented in Table 2 show that the new CT formulation is in better agreement with the pulse decay derived Kr porosity. Moreover, the decreasing trend captured by the pulse decay method is also reflected by the new CT method that is a result of the increasing free gas phase contribution to total porosity. The conventional method predicts a smaller Kr porosity that is even less than the pulse decay measured He porosity (11.0%) [32]. Additionally, Table 2 shows an increasing Kr porosity with increasing pore pressure. This contradicts observations made from the pulse decay results. The increasing porosity captured by the conventional method is due to the increasing contribution of the free phase gas to the total porosity as pore pressure increases. As the conventional method considers the free phase gas only, the increased free phase contribution with pressure is reflected as greater porosity. Figure 8 depicts 3D CT images showing the apparent porosity distribution using both CT methods for the Wolfcamp sample. The proposed method suggests that adsorption results in local Kr apparent porosity close to 25%, whereas other areas have almost no gas storativity.
Observing Table 2, the new CT formulation Kr porosity is still smaller than the pulse decay results. The difference is about 20% for the measurement of 556 psia. A 0.5 cm void space in-between the core, sleeving Teflon, and ends caps would account for this discrepancy. Nonetheless, the new CT formulation agrees substantially with the pulse decay Kr porosity compared to the conventional method. In most, if not all, cases, the new CT method will produce slightly lower porosity values compared to the pulse decay method. One could argue that the new CT method is more accurate as the pulse decay method slightly overestimates porosity due to very small dead spaces around the core that cannot be avoided and are virtually unquantifiable. Further experimentation and comparisons are needed before a definitive conclusion can be made with regard to the method that is more accurate. In conclusion, a better CT processing method is proposed that is more consistent with pulse decay results.
6. Summary
Both pulse decay and X-ray CT imaging were used independently to establish consistency between storativity results derived from each method. New image processing routines for CT data were developed that better match mass balance derived porosity and storativity results compared to conventional CT methods. This consistency between both techniques was not previously attainable in shale using the conventional CT method.
Measurement of in situ porosity via CT scanning is improved by incorporating the contribution from both the free and adsorbed gas phases in our formulation. In shale characterization work found in the literature, little cross-examination is made between He pulse decay porosity and storage capacity determined using Kr in shale because of the difficulty of correcting for the sorption of gases. This motivated initiating comparisons between both characterization methods to establish consistency. The newly proposed methodology was tested on two shale samples (Eagle Ford and Wolfcamp) at various equilibrium pore pressures. In all cases tested, the proposed method had better agreement with the pulse decay results than the conventional method. After dead volume correction, the proposed CT routine and conventional CT method yield storativity values within 5% and 22%, respectively, of the mass balance derived results. Moreover, the reduction in apparent porosity with increasing pore pressure was also consistent between pulse decay and the proposed CT method. The reduction in Kr apparent porosity with increasing pore pressure is a consequence of the increasing contribution of the free gas phase. On the other hand, the conventional method occasionally exhibited unrealistic apparent porosity numbers where Kr CT porosity was lower than the He pulse decay porosity. We strongly encourage the use of the newly proposed method for future CT porosity computations in rocks that strongly adsorb gas, such as shale.
Further testing can be made to compare results for strongly adsorbing (shale) and weakly adsorbing rocks (sandstones and carbonates) to test the performance of both CT methods. Additionally, upstream and downstream reservoir volumes should be measured while the core is sleeved into the setup to account for void spaces that may lead potentially to slight discrepancies between CT and mass balance methods.
Author Contributions
Y.E.: conceptualization, methodology, investigation, writing—original draft. Y.L.: methodology, investigation. K.J.: conceptualization, methodology, writing—review & editing. A.R.K.: conceptualization, methodology, supervision, funding acquisition, writing—review & editing. All authors have read and agreed to the published version of the manuscript.
Funding
This study was funded by the U.S. Department of Energy (BES): DE-SC0019165.
Acknowledgments
This work was supported as part of the Center for Mechanistic Control of Water-Hydrocarbon–Rock Interactions in Unconventional and Tight Oil Formations (CMC-UF), an Energy Frontier Research Center funded by the U.S. Department of Energy, Office of Science under DOE (BES) Award DE-SC0019165.
Conflicts of Interest
The authors declare no conflict of interest. The funders had no role in the design of the study; in the collection, analyses, or interpretation of data; in the writing of the manuscript, or in the decision to publish the results.
Abbreviations
The following abbreviations are used in this manuscript:
| PD | Pulse decay |
| SCF | Standard cubic feet |
| HU | Hounsfield units |
| CT | Computed tomography |
| Z | Real gas compressibility factor |
| Pore pressure | |
| T | Temperature |
| R | Universal gas constant |
| Kr molecular weight | |
| Apparent Kr pore volume | |
| Total number of voxels in imaged rock | |
| Apparent Kr porosity | |
| Rock storativity | |
| Atmospheric pressure | |
| Voxel volume | |
| Voxel-by-voxel Kr mass | |
| Number of voxels per slice | |
| Kr mass in each slice | |
| Number of slices | |
| Total Kr mass in imaged rock | |
| Mass of imaged rock | |
| Bulk rock density | |
| Voxel-by-voxel Kr density | |
| Slope of Kr CT number versus Kr density | |
| Atomic weight | |
| Density | |
| Energy of the incident photon beam | |
| Constant that depends on the electron shell | |
| Effective atomic number | |
| CT number of Kr saturated rock | |
| CT number of dry rock | |
| CT number of pure Kr | |
| CT number of air | |
| Linear attenuation coefficient of water | |
| Linear attenuation coefficient of air | |
| Linear attenuation coefficient of sample x |
References
- McGlade, C.; Speirs, J.; Sorrell, S. Methods of estimating shale gas resources—Comparison, evaluation and implications. Energy 2013, 59, 116–125. [Google Scholar] [CrossRef] [Green Version]
- Zheng, J.; Wang, Z.; Gong, W.; Ju, Y.; Wang, M. Characterization of nanopore morphology of shale and its effects on gas permeability. J. Nat. Gas Sci. Eng. 2017, 47, 83–90. [Google Scholar] [CrossRef]
- Li, C.; Carman, P.S.; Davis, B.J. Modern Fracturing Revitalizes Dormant Technologies: A Case History. Soc. Pet. Eng. 2018. [Google Scholar] [CrossRef]
- Sinal, M.L.; Lancaster, G. Liquid CO Fracturing: Advantages And Limitations. Pet. Soc. Canada. 1987. [Google Scholar] [CrossRef]
- Gupta, D.V.S. Unconventional Fracturing Fluids for Tight Gas Reservoirs. Soc. Pet. Eng. 2009. [Google Scholar] [CrossRef]
- Wu, W.; Sharma, M.M. Acid Fracturing in Shales: Effect of Dilute Acid on Properties and Pore Structure of Shale. Soc. Pet. Eng. 2017. [Google Scholar] [CrossRef]
- Clarkson, C.; Solano, N.; Bustin, R.; Bustin, A.; Chalmers, G.; He, L.; Melnichenko, Y.; Radliński, A.; Blach, T. Pore structure characterization of North American shale gas reservoirs using USANS/SANS, gas adsorption, and mercury intrusion. Fuel 2013, 103, 606–616. [Google Scholar] [CrossRef]
- Bustin, R.M.; Bustin, A.M.M.; Cui, A.; Ross, D.; Pathi, V.M. Impact of Shale Properties on Pore Structure and Storage Characteristics. Soc. Pet. Eng. 2008. [Google Scholar] [CrossRef]
- Clarkson, C.R.; Jensen, J.L.; Blasingame, T. Reservoir Engineering for Unconventional Reservoirs: What Do We Have to Consider? Soc. Pet. Eng. 2011. [Google Scholar] [CrossRef]
- Greene, J.; Viamontes, J.; Hill, B. The Connected Pore Space Paradigm: An Evaluation of the Effect of Crushing on Pore Volume and Structure. Unconv. Resour. Technol. Conf. 2020. [Google Scholar] [CrossRef]
- Aljamaan, H.; Alnoaimi, K.; Kovscek, A.R. In-Depth Experimental Investigation of Shale Physical and Transport Properties. Unconv. Resour. Technol. Conf. 2013. [Google Scholar] [CrossRef]
- Alnoaimi, K.R.; Duchateau, C.; Kovscek, A.R. Characterization and Measurement of Multiscale Gas Transport in Shale-Core Samples. Soc. Pet. Eng. 2016. [Google Scholar] [CrossRef]
- Eliebid, M.; Mahmoud, M.; Al-Yousef, H.Y.; Elkatatny, S.; Al-Garadi, K. Effect of Gas Adsorption on Pulse-Decay Permeability Measurements. Soc. Pet. Eng. 2018. [Google Scholar] [CrossRef]
- Cui, X.; Bustin, A.M.; Bustin, R.M. Measurements of gas permeability and diffusivity of tight reservoir rocks: Different approaches and their applications. Geofluids 2009, 9, 208–223. [Google Scholar] [CrossRef]
- Glatz, G.; Castanier, L.M.; Kovscek, A.R. Visualization and Quantification of Thermally Induced Porosity Alteration of Immature Source Rock Using X-ray Computed Tomography. Energy Fuels 2016, 30, 8141–8149. [Google Scholar] [CrossRef]
- Vega, B.; Dutta, A.; Kovscek, A.R. CT Imaging of Low-Permeability, Dual-Porosity Systems Using High X-ray Contrast Gas. Transp. Porous Media 2014, 101, 81–97. [Google Scholar] [CrossRef]
- Fogden, A.; Goergen, E.; Olson, T.; Cheng, Q.; Middleton, J.; Kingston, A.; Jernigen, J. Applications of Multi-Scale Imaging Techniques to Unconventional Reservoirs. Soc. Pet. Eng. 2015. [Google Scholar] [CrossRef]
- Joss, L.; Pini, R. Digital Adsorption: 3D Imaging of Gas Adsorption Isotherms by X-rays Computed Tomography. J. Phys. Chem. C 2017, 121, 26903–26915. [Google Scholar] [CrossRef] [Green Version]
- Meng, X.; Sheng, J.J.; Yu, Y. Experimental and Numerical Study of Enhanced Condensate Recovery by Gas Injection in Shale Gas-Condensate Reservoirs. Soc. Pet. Eng. 2017. [Google Scholar] [CrossRef]
- Lu, X.C.; Pepin, G.P.; Moss, R.M.; Watson, A.T. Determination of Gas Storage in Devonian Shales With X-Ray-Computed Tomography. Soc. Pet. Eng. 1992. [Google Scholar] [CrossRef]
- Alnoaimi, K.; Kovscek, A.R. Influence of Microcracks on Flow and Storage Capacities of Gas Shales at Core Scale. Transp. Porous Media 2018, 127, 53–84. [Google Scholar] [CrossRef]
- Huo, D.; Benson, S. Experimental Investigation of Stress-Dependency of Relative Permeability in Rock Fractures. Transp. Porous Media 2016, 113, 567–590. [Google Scholar] [CrossRef]
- Huo, D.; Pini, R.; Benson, S.M. A calibration-free approach for measuring fracture aperture distributions using X-rays computed tomography. Geosphere 2016, 12, 558–571. [Google Scholar] [CrossRef]
- Elkady, Y.; Kovscek, A.R. Multiscale study of CO2 impact on fluid transport and carbonate dissolution in Utica and Eagle Ford shale. J. Pet. Sci. Eng. 2020, 195, 107867. [Google Scholar] [CrossRef]
- Akin, S.; Kovscek, A.R. Computed tomography in petroleum engineering research. Geol. Soc. Lond. Spec. Publ. 2003, 215, 23–38. [Google Scholar] [CrossRef]
- Vinegar, H.J.; Wellington, S.L. Tomographic imaging of three phase flow experiments. Rev. Sci. Instrum. 1987, 58, 96–107. [Google Scholar] [CrossRef]
- McCullough, E.C. Photon attenuation in computed tomography. Med. Phys. 1975, 2, 307. [Google Scholar] [CrossRef]
- Withjack, E.M. Computed Tomography for Rock-Property Determination and Fluid-Flow Visualization. Soc. Pet. Eng. 1998. [Google Scholar] [CrossRef]
- Alnoaimi, K.R. Influence of Cracks and Microcracks on Flow and Storage Capacities of Gas Shales at Core-Level. Ph.D. Thesis, Stanford Univerisity, Stanford, CA, USA, 2016. [Google Scholar]
- Aljamaan, H.; Ross, C.M.; Kovscek, A.R. Multiscale Imaging of Gas Adsorption in Shales. Soc. Pet. Eng. 2017. [Google Scholar] [CrossRef]
- Buzug, T. Computed Tomography: From Photon Statistics to Modern Cone-Beam CT; Springer: Berlin/Heidelberg, Germany, 2008; 522p. [Google Scholar] [CrossRef]
- Elkady, Y.; Kovscek, A.R. Laboratory Visualization of Enhanced Gas Recovery in Shale, Manuscript No. SPE-201707-MS Submitted and Accepted for ATCE 2020; Society of Petroleum Engineers: Richardson, TX, USA, 2020.
- Lyu, Y.; Dasani, D.; Tsotsis, T.; Jessen, K. Characterization of Shale using Helium and Argon at High Pressures. J. Pet. Sci. Eng. 2020. submitted for review. [Google Scholar]
Figure 1.
Pure Kr CT number versus pressure (left) and density (right) at 20 C scanned at 140 kV and 120 mA. CT number versus krypton pressure correlation was acquired from Aljamaan et al. (2017) [30].
Figure 1.
Pure Kr CT number versus pressure (left) and density (right) at 20 C scanned at 140 kV and 120 mA. CT number versus krypton pressure correlation was acquired from Aljamaan et al. (2017) [30].

Figure 2.
Pure Kr density versus CT at 20 C scanned at 140 kV and 120 mA.

Figure 3.
Pulse decay experimental setup for mass balance determination of gas storativity in rock. Setup is placed on a CT table for image acquisition after reaching pressure equilibrium for each pressure pulse.
Figure 3.
Pulse decay experimental setup for mass balance determination of gas storativity in rock. Setup is placed on a CT table for image acquisition after reaching pressure equilibrium for each pressure pulse.

Figure 4.
Pressure history of all Kr pressure pulses for the Eagle Ford sample. The black arrow illustrates that CT acquisitions are taken at the end of each pulse. This specific example shows a CT scan acquired at the end of Pulse 2. Slight unsteadiness in equilibrium pressure is observed in the last few pulses due to room temperature fluctuations that have greater influence at higher pressures.

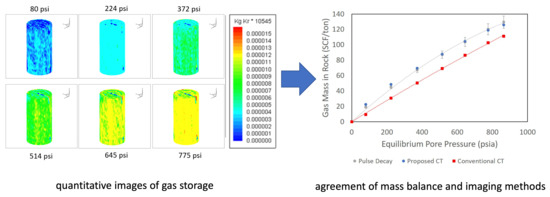
Figure 5.
Comparison of proposed and conventional CT formulations for Kr storage capacity in Eagle Ford sample. Note the excellent agreement between the mass balance method (pulse decay) and the imaging approach that takes into account Kr density more accurately. The proposed CT routine and conventional CT method yield storativity values within 5% and 22%, respectively, of the mass balance derived results The CT curves are corrected to account for an additional 0.4 cm of pore volume captured by the pulse decay material balance but not visible to the CT scanner.

Figure 6.
3D CT images showing increasing Kr storage in the rock with pore pressure in the Eagle Ford sample. The color scale represents the mass of Kr in each voxel in Kg multiplied by the total number of voxels per slice, 10,545. Warmer colors indicate more gas in place.
Figure 6.
3D CT images showing increasing Kr storage in the rock with pore pressure in the Eagle Ford sample. The color scale represents the mass of Kr in each voxel in Kg multiplied by the total number of voxels per slice, 10,545. Warmer colors indicate more gas in place.

Figure 7.
CT slice depicting the core and end cap boundary where the color scale reflects CT number in HU. The lighter (2000 HU range) areas reflect etching in the end caps that allows for a more distributed inflow of gas into the core. The changing CT numbers or density in these etched areas reflect the uneven contact surface between the rock and end cap. The low CT number (less dense) blue zone suggests that a void exists between end cap and core in that region.

Figure 8.
3D CT images of Kr apparent porosity for the three pressure pulses conducted on the Wolfcamp sample. Local areas with relatively greater storage are consistent in both methods; however, the magnitude by which Kr stores in these areas differ.
Figure 8.
3D CT images of Kr apparent porosity for the three pressure pulses conducted on the Wolfcamp sample. Local areas with relatively greater storage are consistent in both methods; however, the magnitude by which Kr stores in these areas differ.


Table 1.
Summary of Eagle Ford and Wolfcamp samples mineralogical data by wt%. Data for the Eagle Ford core were obtained from Aljamaan et al. (2017) [30], and the Wolfcamp mineralogical data are based on FTIR data made available by the core provider.
Table 1.
Summary of Eagle Ford and Wolfcamp samples mineralogical data by wt%. Data for the Eagle Ford core were obtained from Aljamaan et al. (2017) [30], and the Wolfcamp mineralogical data are based on FTIR data made available by the core provider.
| Sample | TOC | Clay | Carbonates | Quartz | Feldspar | Pyrite | Plagioclase/Chlorite |
|---|---|---|---|---|---|---|---|
| Eagle Ford | 18 | 0 | |||||
| Wolfcamp | 25 | 15 | 50 | ||||
Table 2.
Wolfcamp core Kr porosity results comparison using pulse decay (PD), conventional CT, and new CT methods.
Table 2.
Wolfcamp core Kr porosity results comparison using pulse decay (PD), conventional CT, and new CT methods.
| Pressure (Psia) | PD (%) | Conventional CT (%) | New CT (%) |
|---|---|---|---|
| 216 | |||
| 397 | |||
| 556 |
Publisher’s Note: MDPI stays neutral with regard to jurisdictional claims in published maps and institutional affiliations. |
© 2020 by the authors. Licensee MDPI, Basel, Switzerland. This article is an open access article distributed under the terms and conditions of the Creative Commons Attribution (CC BY) license (http://creativecommons.org/licenses/by/4.0/).
Share and Cite
MDPI and ACS Style
Elkady, Y.; Lyu, Y.; Jessen, K.; Kovscek, A.R. Three-Dimensional Imaging and Quantification of Gas Storativity in Nanoporous Media via X-rays Computed Tomography. Energies 2020, 13, 6199. https://doi.org/10.3390/en13236199
AMA Style
Elkady Y, Lyu Y, Jessen K, Kovscek AR. Three-Dimensional Imaging and Quantification of Gas Storativity in Nanoporous Media via X-rays Computed Tomography. Energies. 2020; 13(23):6199. https://doi.org/10.3390/en13236199
Chicago/Turabian StyleElkady, Youssef, Ye Lyu, Kristian Jessen, and Anthony R. Kovscek. 2020. "Three-Dimensional Imaging and Quantification of Gas Storativity in Nanoporous Media via X-rays Computed Tomography" Energies 13, no. 23: 6199. https://doi.org/10.3390/en13236199
Note that from the first issue of 2016, this journal uses article numbers instead of page numbers. See further details here.